

1. Background
Colorectal cancer (CRC) is one of the most common malignant tumors, which has been introduced as the third most common cancer and the third leading cause of death worldwide (1). The incidence of CRC increased by 5% between 2007 and 2017 worldwide (1, 2). In Iran, 5,000 new cases of this cancer are reported annually (3). The emergence of CRC is a complex process that occurs due to a series of factors, including dietary and environmental factors and somatic and hereditary mutations (3).
In addition, genetic factors such as alterations in the expression of some microRNAs (miRNA) also contribute to the development of CRC (4). MicroRNAs can act as oncogenes or tumor suppressors by inhibiting the expression of cancer-related target genes. Besides, functional differences between different types of tumors and various stages of cancer are associated with the expression of microRNAs (5).
Moreover, some studies have reported the aberrant expression of mir146a in CRC (4). MiR-146a rs2910164 polymorphism is seen in the population in two states, including G and C alleles. Most studies on the association between miR-146a polymorphism and CRC in the study population have shown that the C allele of miR-146a polymorphism reduces the risk of cancer compared to the G allele (6). The G allele increases the expression of the mature miR-146a. Increased expression of miR-146a leads to decreased expression of the target genes of that (mRNA transcribed from the TRAF6 and IRAK1 genes). Decreased expression of TRAF6 and IRAK1 genes reduces the signaling pathway of two receptors, toll-like receptors (TLRs) and cytokines, e.g., TNF-α, in response to molecular patterns associated with various pathogens, thereby increasing the risk of cancer (7).
2. Objectives
In the present study, the molecular analysis of rs2910164 polymorphism from the miRNA146a gene and its association with TNF-α gene expression in patients with CRC were investigated in the Iranian population.
3. Methods
In this study, 65 formalin-fixed paraffin-embedded (FFPE) tissue samples from patients with cancerous lesions of colorectal tissue (37 cases over 50 years were considered as the case group and 28 cases under 50 years were considered as the control group). The informed consents were obtained from patients enrolled in the study and admitted in Imam Khomeini Hospital of Karaj. The specimens were evaluated histopathologically and confirmed by a pathologist. The number of selected samples for the case and control groups was calculated according to the sample size formula (8).
3.1. DNA Extraction from Samples
After deparaffinization of the blocks, DNA was extracted by DNA extraction CinnaGen Inc., according to the manufacturer’s protocol, and stored at -20 °C. DNA was extracted from 0.8% agarose gel.
3.2. Tetra-ARMS PCR Reaction for Proliferation of rs2910164 Polymorphism
Genotype for SNP MiR-146a rs2910164 G > C was amplified by Tetra-ARMS PCR in a thermal cycler (Primus 25, Peqlab, Germany) by CinnaGen kits, as well as synthetic primers synthesized by CinnaGenCo (Table 1). The material was added to PCR-specific tubes, and one sample was considered a negative control that 5 µL of distilled water was added instead of DNA. The reaction mixture was prepared in a 25 µL volume and, after preparation, was transferred. To the thermocycler apparatus with the program as follows: initial isolation of two DNA strands (95°C, 300 s) 1×, separation of two DNA strands (95°C, 30 s) 35×, pattern of DNA binding to primer (61°C, 25 s) 35×, DNA extension (72°C, 25 s) 35×, and the final extension (72°C, 600 s) 1×. Also, the formation of the desired parts in PCR products was investigated by electrophoresis on 1.5% agarose gel.
Sequences of Primers Used for rs2910164 Polymorphism from miRNA146a Gene
3.3. RNA Isolation and Quantitative Real-Time PCR (qRT-PCR)
Total RNA was extracted from the tissues with a CinnaPure RNA kit, according to the manufacturer’s protocols. RNA was quantified by NanoDrop spectrophotometer (BioTek Epoch, America). Before reverse transcription reaction, the RNA samples were mixed with a DNA-removing mixture for 2 minutes at 42°C to remove any DNA contamination. After DNA removal, the QuantaScript RT enzyme was transcribed, and the RNA was transcribed into the cDNA. Synthesis of cDNA from these genes was performed using the QuantiEect® Reverse Transcription Kit (QIAGEN) and specific stem-loop primers for all types of genes, according to the protocol.
3.4. Sequence of Specific Stem-Loop Primers for Genes Includes
SNORD-47 (U47) (10):
5'-GTCGTATGCAGAGCAGGGTCCGAGGTATTCGCACTGC
ATACGACAACCTC-3'
MirRNA146a (10):
5'-GTCGTATGCAGAGCAGGGTCCGAGGTATTCGCACTG
CATACGACAACCCAT-3'.
The sequences of primers used are given in Table 2.
Primer Sequences for Real-time PCR
The expression level of TNF-α and miR146a in tissues was measured by quantitative real-time PCR (qRT-PCR) with Snord-47 as the internal reference. Real-time PCR was performed using the ABI 7500 real-time PCR system (ABI, America) and SYBR Green PCR Master Mix (Takara) kit. The amplification conditions for qRT-PCR were as follows: initial denaturation 95 °C for 300 s for 1 cycle, denaturation 95 °C for 40 s for 35 cycles, annealing 60 °C for 45 s for 35 cycles, extension 70 °C for 60 s for 35 cycles, and final extension 70 °C for 600 s for 1 cycle. The relative expression of miRNA was calculated using Ct values. The difference between the threshold of the desired gene and the internal control gene (housekeeping) can be achieved by obtaining the relative expression of the gene by the 2-ΔΔCT method.
3.5. Statistical Analysis
The data were analyzed and expressed as mean values ± standard deviation. Finally, data were analyzed using Epi Info software (version 7.1.3.10) and MedCalc (Version 19.2.0). Values were statistically significant when P-value was < 0.05.
4. Results
4.1. Tetra-ARMS PCR Results
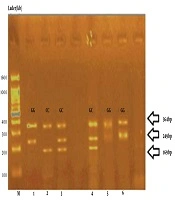
The frequency of genotypes from rs2910164 polymorphism of the miRNA146a gene was evaluated using Tetra-ARMS PCR method. First, the rs2910164 polymorphism of the miRNA146a gene was amplified in all specimens using the PCR method. The desired fragment was 364 bp for miRNA146a, which was performed using foreign primers and acted as an internal control in the PCR method, with 364 bp bands that were present in all samples (Figure 1).

Tetra-ARMS PCR product electrophoresis results for polymorphism rs2910164.
According to the statistical analysis of the rs2910164 polymorphism of the miRNA146a gene, the chance of suffering from those with a GG genotype is more than those with CC genotype. We concluded that GG genotype was a polymorphism of the miRNA146a gene that predisposed CRC (Table 3).
| Genotype | Total Number of Case (N = 37), No. (%) | Total Number of Control (N = 28), No. (%) | OR 95% CI | χ2A | Mean ± SDB | P-value |
|---|---|---|---|---|---|---|
| G | 20 (54.05) | 8 (28.57) | 5.82 | |||
| GC | 14 (37.83) | 13 (46.42) | 2.58 | 0.00006 | ||
| CC | 3 (8.10) | 7 (25) | 1 | 14.04 | 10.83 ± 5.52 | |
| G | 54 (72.97) | 29 (51.78) | 1 | 0.001 | ||
| C | 20 (27.08) | 27 (48.21) | 0.401 |
4.2. Comparison of the expression of TNF-α and miRNA146a
In this method, the normalized CT value is measured relative to a control sample, and we also need internal standards, their CT values should be deducted from the CT specimen value (normalization). The relative difference of the test sample Vs. the control is calculated by 2-ΔΔCT formula:
1) Fold change = 2 -ΔΔCT = 2-(ΔCt case - ΔCt control ) = 2-(ΔCt) case /2-(ΔCt) control
2) Fold change miRNA146a = 2-(ΔCt) case /2-(ΔCt) control = 7.8/1.3 = 6
3) Fold change TNF-α = 2-(ΔCt) case /2-(ΔCt) control = 3.4/1.5 = 2
The results of the comparison of miRNA146a and TNF-α gene expression in both case and control groups showed that miRNA146a gene expression was about 6 folds, and TNF-α was about 2 folds higher in the case group than in the controls (Figure 2).
 in the case and control groups.")
Comparison of TNF-α and miRNA gene expression (relative to the U47 gene after normalization) in the case and control groups.
4.3. The Association Between Types of miRNA146a Gene Polymorphisms by TNF-α Gene Expression
The results showed that there is a significant association between the frequency of GG, GC, and CC genotypes and the level of TNF-α expression in the affected individuals (Table 4 and Figure 3). In other words, GG genotype in patients with CRC over 50 years increases the expression of the TNF-α gene in comparison to the CC genotype of miRNA-146a gene polymorphism.
| Genotype | Frequency of Genotypes Case, % | Expression of TNF-α Gene, % | OR 95% CI | P-value |
|---|---|---|---|---|
| GG | 54 | 55 | 0.113 | |
| GC | 38 | 39 | 0.122 | 0.009 |
| CC | 8 | 26 | 1 | |
| G | 73 | 74 | 1 | 0.0001 |
| C | 27 | 26 | 0.013 |
Association between# miRNA146a Polymorphism Genotypes and the Expression of TNF-α Gene

Comparison of miRNA146a gene polymorphism genotypes with the expression of the TNF-α gene.
5. Discussion
This study involves several research aspects. First, the molecular analysis of rs2910164 polymorphism from miRNA146a gene in CRC, and second, the study of the expression of miRNA146a and TNF-α genes in CRC, and finally, the association between TNF-α gene expression and genotype polymorphisms rs2910164 from miRNA146a gene in CRC.
Numerous studies have shown the regulatory role of miRNAs in various types of cancer in which the role of miRNA146a in various types of malignancies has been proven, and rs2910164, as a polymorphism of miRNA146a gene, is effective in some cancers (6). The role of TNF-α in various types of cancer has also been shown in numerous studies (13). Therefore, a multifaceted study of these factors can help identify biomarkers that are effective in CRC.
The results of the present study showed that the G allele was associated with an increased risk of CRC, and, on the other hand, a significant correlation was found between GG genotype and rs2910164 polymorphism from miRNA146a gene in the CRC samples. Previous studies have also demonstrated the association between this SNP and other cancers. For example, a meta-analysis of several studies by Alidoust et al. (4) showed that miR-146a rs2910164 with a reduced risk of CRC was associated with a dominant genetic model in Europe. Gao et al. (14) revealed a significant correlation between miRNA gene rs2910164 polymorphism and the risk of CRC in males.
However, some studies, unlike our study, did not find a significant association between this polymorphism and cancer. For example, Chayeb et al. (15) found no statistically significant association between that rs2910164 in miR-146a and CRC risk. Pan et al. (16) conducted a meta-analysis of recent rs2910164 in miR-146a who found there was no risk of CRC. This study was inconsistent with the present study, possibly due to the small number and non-random selection of studies in the meta-analysis.
Genetic polymorphism predisposes a person to cancer and is heavily dependent on environmental mutagens. The reason for this difference in research findings may be different types of races and geographical conditions, as well as differences in the type of life in each region (17). On the other hand, in the present study, the increase in the expression of the miRNA146a gene in people with CRC has been observed in comparison to healthy subjects, and various studies have also shown similar results to this study. For example, Taganov et al.'s (18) study found that the expression of adult miRNA-146a in THP-1 cells is increased with lipopolysaccharide (LPS) microbial components and cytokines, including interleukin 1 beta (IL-1β) and TNF-α. Shankaran et al. (7) showed that miR-146a polymorphism increased the susceptibility to CRC apparently by influencing the expression of its target genes in an Indian population.
In the present study, like mir146a, the expression of TNF-α has increased in CRC, and other studies have also shown the importance of TNF-α in cancers. For example, the study conducted by Al Obeed et al. (13) on patients with CRC in Saudi Arabia demonstrated that increased expression was observed in advanced stages of cancer. Furthermore, in another study conducted by Perng et al. (19), it was demonstrated that the expression of miRNA-146a regulated the production of IL-8 produced by TNF-α in mesenchymal stem cells and differentiated epithelial cells of the lung. Also, Bani et al. (20) examined the association between the 308 G > A variant of the TNF-α gene and risk of CRC in the Iranian population. They concluded that carriers of TNF-α-308G/A polymorphism were associated with an increased risk of CRC.
5.1. Conclusions
Considering the results of this study, the expression of TNF-α and miRNA146a gene in patients over 50 years was higher than the patients under 50 years, and further studies showed that GG genotype increased the expression of TNF-α gene by miRNA146a gene polymorphism than CC genotype.
5.2. Suggestions
In order to achieve more accurate results, a molecular study of the rs2910164 polymorphism of the miRNA146a gene in larger populations should be performed by examining all possible factors affecting it. This polymorphism can also be used as a diagnostic biomarker in patients suspected or susceptible to CRC.
