


1. Background
As a result of type 2 diabetes (T2D), abnormalities such as high blood glucose levels are caused, as well as an inefficient secretion or lack of insulin production (1). The first clinical sign of Type 2 diabetes is insulin resistance, in which the cells fail to respond to insulin secreted from the pancreas (2). Although T2D can occur at any age, most cases occur in the middle ages or later in life. Symptoms and signs develop gradually over the years (3), including increased frequency of urination (polyuria), abnormal thirst (polydipsia), vision problems, fatigue, tingling or loss of feeling in feet and hands (numbness) called diabetic neuropathy, wounds with poor healing, and weight loss. Uncontrolled increased blood sugar can result in chronic disorders such as cardiac disorders and stroke, damage to nerves, and problems related to several body organs, including kidneys and eyes (4). Diabetes and depression are two of the most common reasons for referring patients to primary healthcare centers. Epidemiological evidence indicates that depression and diabetes are closely related. It has been shown that diabetes can increase the risk of diabetes (5), and those suffering from T2D are at a greater risk of developing depression twofold (6). A major complication of depression in patients with type 2 diabetes is their poor adherence to prescription medications and dietary regimens, uncontrolled blood sugar levels, deteriorating quality of life, and increased medical expenses (7). In addition, depression may lead to unhealthy behaviors, such as tobacco use, lack of physical activity, and increased caloric intake, which can raise the risk of type 2 diabetes (8). Additionally, it causes physiological irregularities, such as activating the hypothalamic-pituitary-adrenal axis, sympathoadrenal system, and pro-inflammatory cytokines, which contribute to insulin resistance and diabetes (9, 10). The interleukin (IL)-6 family of cytokines, encoded by the IL-6 gene on chromosome 7p21, use a signaling receptor subunit known as glycoprotein 130 kDa (gp130) for signaling (11, 12). IL-6 is produced by several types of cells in humans, including immune cells (13), vascular smooth muscle cells (14), skeletal muscle, and adipocytes (15). IL-6 mediates chronic and acute inflammation. Moreover, it plays a vital role in downstream inflammatory cascades, including C-reactive protein and fibrinogen production. By providing several signals, IL-6 regulates cell growth, immune reactions, and the secretion of acute phase proteins (16). Furthermore, it is a significant regulator of the immune response, inflammation, and hematopoiesis. It has been suggested that pro-inflammatory cytokines produced by activated macrophages, such as IL-6, may stimulate the development of depression (17). It appears that elevated expression of IL-6 is associated with both the onset and severity of depression (18).
2. Objectives
This study examined the effect of IL-6 gene expression on diabetes-induced depression in patients with type 2 diabetes based on the evidence mentioned earlier.
3. Methods
3.1. Selection of Participants
The Ethics Committee approved the present study of the Endocrinology and Metabolism Research Institute (EMRI), Tehran University of Medical Sciences (TUMS). Written informed consent was obtained from all subjects. A total of 100 T2DM patients, aged-matched, from the Endocrinology and Metabolism Research Center (EMRC) Clinic of Diabetes and Metabolic Disorders, were included in the study. Participants were selected using the following criteria:
(1) Hemoglobin A1C (HbA1C) poor control, defined as an HbA1c level of ≥ 9%;
(2) When a patient was diagnosed with definite T2DM, defined as a fasting blood sugar level of 126 mg/dL on at least two occasions, HbA1C ≥ 6.5%, random blood sugar 200 mg/dL or glucose tolerance test > 180 (blood test was performed two hours after 75 grams of glucose had been administered);
(3) More than one year of suffering from T2DM;
(4) The absence of long-term diabetic complications, such as retinopathy, nephropathy, and foot ulcers. An individual with severe retinopathy had macular edema, proliferative retinopathy, or severe non-proliferative diabetic retinopathy (NPDR). A patient with severe nephropathy was defined as having blood creatinine > 1.5 mg/dL in men and > 1.4 mg/dL in women;
(5) No history of using antidepressants and Thiazolidinedione;
(6) Having no history of psychiatric disorders or chronic diseases such as renal insufficiency, liver failure, or rheumatoid arthritis;
(7) No history of smoking and alcohol consumption.
Some demographic variables, such as age, gender, marital status, level of education, ethnicity, history of diabetes and depression in the family, weight, and height, were collected from all subjects.
Based on the presence or absence of depression, T2DM subjects were divided into two groups: the depressive diabetes group (DD group, n = 50) and the non-depressive diabetes group (NDD group, n = 50). Depressive symptoms were assessed using the Persian version of the Center for Epidemiologic Studies Depression Scale (CES-D).
3.2. Real-time Quantitative PCR
An analysis of IL-6 gene expression was performed on fresh unstimulated PBMCs (Peripheral Blood Mononuclear Cells) isolated from heparinized blood samples taken from all participants. The lymphocytes were separated using Ficoll (1.077); then, the total RNA was extracted using TriPure Isolation Reagent (Roche Applied Science), according to the manufacturer's instructions. Afterward, expanded reverse transcriptase (Roche Applied Science) and random hexanucleotides primers were used to reverse-transcribe one µg aliquot of total RNA from each specimen into single-stranded complementary DNA (cDNA). Quantitative real-time PCR using primers shown in Table 1 was used for internal quantitative control (Hprt) of cDNA in all samples. The PCR reactions were conducted in a final volume of 20 µl reaction mixtures containing 10 mL RT2 Real-time TM SYBR Green/ROX PCR Master, primer pairs, five ng cDNA, and nuclease-free water. An ABI Step-One quantitative PCR system was used to conduct PCR reactions in duplicate. In the thermocycling procedure, the initial polymerase activation step was performed at 95°C for two minutes, followed by 40 cycles at 95°C for five seconds and 53°C for forty seconds. In order to confirm a single gene-specific peak and identify primer dimer generation, melting curves were generated. Besides the quantitative results, samples were run on the gel to ensure the presence of RNA and the absence of DNA contamination. The accuracy of the analysis was ensured after the detection of nucleotide bands. The reverse transcriptase enzyme was used to synthesize cDNA from the samples after ensuring the quality of the extracted RNA. The quality of cDNA was evaluated using the RT-PCR technique and the GAPDH primer to detect cDNA contamination. The experiment was repeated three times after determining the functionality of primers and ensuring their suitability for each sample (cases and controls). Each sample was also replicated three times using GAPDH primer as a reference gene and internal control. In order to verify the response of the melting curve, samples were run on an agarose gel. The multiplication diagram indicates a one-round reaction.
| Locus Amplified | Sequence (5'->3') Primer | Length | Tm | GC% | Self Complementarity | Self 3' Complementarity | Amplicon Size (bp) |
|---|---|---|---|---|---|---|---|
| GAPDH-F | ACACCCACTCCTCCACCTTTG | 21 | 61.94 | 57.14 | 2.00 | 0.00 | 112 |
| GAPDH-R | TCCACCACCCTGTTGCTGTAG | 21 | 61.99 | 57.14 | 4.00 | 2.00 | |
| IL-6-F | GGTACATCCTCGACGGCATC | 20 | 60.32 | 60.00 | 4.00 | 3.00 | 81 |
| IL-6-R | GTGCCTCTTTGCTGCTTTCA | 20 | 59.33 | 50.00 | 3.00 | 1.00 |
3.3. Data Analysis
Initially, data were normalized against GAPDH, a reference gene. SPSS version 22 was used to analyze the relative gene expression using the 2-ΔΔCT. The student's t-test was used to analyze the differences in gene expression of IL-6 between the case and control groups at a significance level of P < 0.05.
3.4. Ethics Approval
The informed consent was obtained from the patients prior to the sampling procedure in this study. The current study was approved by the Ethics Committee of Tehran University of Medical Sciences' Endocrinology and Metabolism Research Institute (IR.TUMS.EMRI.REC.1399.035).
4. Results
Table 2 represents the demographic characteristics of all participants. In this study, 100 patients with definite T2D were divided into two groups of case and control patients. An assessment of the indices of diabetes, including fasting blood glucose levels, hemoglobin A1C levels, and plasma creatinine levels, was conducted in this study. Patients with depression (55 ± 8) were younger than those without depression (56.9 ± 8.3), and the body mass index of the diabetic group with depression (28 ± 4.25) was higher than that of the non-depressed group (27.6 ± 5). There was also an increase in fasting blood glucose levels in the diabetic group compared with those without depression; however, this increase was not statistically significant. Additionally, diabetics with depression had lower HgbA1C levels (7 ± 0.1) than diabetics without depression (7 ± 0.9%), but this decrease was not statistically significant (Table 2).
| Variables | NDD Group (n = 120) | DD Group (n = 120) | P-Value |
|---|---|---|---|
| Age (y) | 56.9 ± 8.3 | 55 ± 8.2 | 0.076 |
| BMI (kg/m2) | 27.6 ± 5 | 28 ± 4.25 | 0.499 |
| HbA1C (%) | 7.1 ± 0.9 | 7 ± 0.1 | 0.805 |
| FBP (mmol/L) | 8.5 ± 4.0 | 8.6 ± 3.0 | 0.546 |
| Creatinine(μmol/L) | 82.3 ± 16.2 | 83.6 ± 15.4 | 0.083 |
Abbreviations: DD, depressive diabetes group; NDD, non-depressive diabetes group; BMI, body mass index; HbA1C, glycosylated hemoglobin.
a Statistical significance (P-value < 0.05); Values are expressed as means ± SD.
As interleukin 6 is a pro-inflammatory factor in depression and causes the disease to recur, we assessed gene expression analysis in depressed patients with type 2 diabetes and compared the results with those with type 2 diabetes alone. Real-time PCR was carried out on all samples to evaluate the expression of IL-6.
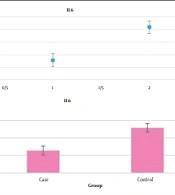
4.1. IL-6 Gene Expression Level in Case and Control Groups
We have shown in this article the level of gene expression in the control and control groups. In Figure 1 it it is shown that IL-6 gene expression is slightly lower in T2D cases (0.62 ± 0.39) suffering from depression compared to cases without depression (0.65 ± 0.43). However, these differences are not significant (P > 0.05).

The level of IL-6 gene expression in cases with and without depression
5. Discussion
According to our findingsIn diabetic patients with depression, IL-6 gene expression was reduced in peripheral mononuclear cells (PBMCs) compared to diabetic patients without depression, but this was not statistically significant (P > 0.05). Considering that interleukin-6 is an inflammatory cytokine, it can be argued that inflammatory cytokines contribute to inflammation after microbe exposure and immune-related diseases by stimulating the immune system (19). In addition, several studies have investigated the pattern of inflammatory cytokines in depressed individuals since depression can have a significant impact on the immune system. According to Jazayeri et al., serum concentrations of cytokines, such as IL-6, are elevated in patients with depression (20). Wong et al. reported that patients with T2D had significantly increased levels of cytokines, such as interleukin 6. In our study, the IL-6 gene expression level was higher in the control group than in the case group, indicating that this gene's level has increased in individuals with T2D. There may, however, be a different reason for the decrease in gene expression in the case group. A decrease in lactate dehydrogenase levels may contribute to the decrease in extracellular lactate levels, increasing IL-6 levels. Moreover, our hypothesis regarding the increase in IL-6 expression in T2D patients with depression was rejected since the level of IL-6 expression was diminished in T2D patients. Our findings are consistent with those of Arababadi et al. and Wong et al. (19, 21).
Thus, it can be concluded that further research is necessary to determine the reason for the reduction of IL-6 in patients with T2D and depression. Further, IL-6 expression levels are higher in individuals with T2D without depression compared with those with T2D with depression, suggesting that elevated levels of IL-6 are more closely associated with T2D rather than depression.
5.1. Conclusions
Because depression is considered a multifactorial disorder, lower levels of IL-6 cannot be attributed to the development of depression in individuals with type 2 diabetes. This study found that the level of interleukin 6 in people with type 2 diabetes with depression decreased compared to those with type 2 diabetes without depression, which was not statistically significant. Therefore, it is possible to make an argument in this case. Because it is impossible to control all participants in the study, despite the ban on the use of various drugs, including anti-neuropathy, anti-myopathy, and any drug associated with type 2 diabetes, these individuals may have used one of these medications. In previous studies, it was found that drugs such as Liraglutide, which is used to treat neuropathic symptoms in patients with type 2 diabetes, as well as aspirin, which is used to treat cardiovascular problems in these patients, reduced the expression of interleukin 6.
