1. Background
Diabetic neuropathy (DN) with damage to glial neurons, their axons, and endothelial cells leads to impaired brain function (1). Insulin signaling in the brain regulates neuronal survival, synaptic plasticity, and cognitive and locomotor functions (2). Previous studies in humans and experimental animals have shown that locomotor abnormality, cognition impairment, and sensory discrimination in diabetic patients may be due to molecular and pathological alterations in the cerebellum (3). Ultrastructural changes and increased apoptosis have been reported in the cerebellum of type 1 diabetic rats (4). Mitochondrial dysfunction, endoplasmic reticulum stress, non-enzymatic glycation of proteins, glucose oxidation, increased lipid peroxidation and decreased concentrations of tissue antioxidants can promote ROS accumulation and cellular damage, and contribute to the progression of diabetic complications in various tissues such as the brain. The brain is more vulnerable to oxidative stress than other tissues due to its high oxygen utilization and relative lack of antioxidant enzymes (5).
Atrophy of the cerebellum has been reported in diabetic patients, and this is not associated with the duration of the disease or glycemic control (6). There is evidence demonstrating that diabetes induces neural apoptosis by caspase-dependent mechanisms in the brain of the experimental diabetes model (6). The neuro preventive effect of regular exercise may be related to the attenuation of cell death and oxidative stress by increasing the levels of low molecular weight antioxidants and oxidative damage repair enzymes or the suppression of the release of apoptotic factors (7). According to research, there is little information about the potential protective effect of endurance training against oxidative stress and apoptosis in the cerebellum of diabetic rats.
2. Objectives
This study aimed to determine if six weeks of endurance training have an effect on oxidative stress and apoptosis in the cerebellum of diabetic rats.
3. Methods
3.1. Experimental Animals and Grouping
In this study, 20 Wistar rats weighing 200 - 220 g were prepared from the experimental animal center of Shahid Chamran University in Ahvaz, Iran. The rats were housed in standard cages at a temperature of 23 ± 1°C and humidity with the 12/12 h light/dark cycle. Rats had free access to water ad libitum and rat chow (Pars Company, Tehran, Iran). The animals were allocated in four groups, including (1) normal control group (CON), (2) normal exercise group (TH), (3) diabetes control group (DC), and (4) diabetes exercise group (TD). Animals in the DC and TD groups were injected with a single intraperitoneal injection of 50 mg/kg STZ dissolved in cold citrate buffer (pH = 4.5) after 12 h fasting. Three days after STZ injection, all injected rats were checked for the induction of diabetes by the assessment of blood glucose levels by tail prick using a hand-held glucometer (EasyGluco, Mainland, China). Animals with fasting blood glucose levels above 250 mg/dL were accepted as diabetic. The CON and TH groups received only a saline injection. The results of blood glucose of different experimental groups were presented in our previous report (8).
3.2. Exercise Training Protocols
Rats in the diabetes and healthy exercise groups performed moderate-intensity endurance training on a treadmill for five days a week for six weeks. The duration and speed of the training gradually increased from 10 min and 10 m/min in the first week to 20 min and 10 m/min in the second week, 20 min and 15 m/min in the third week, 30 min and 15 m/min in the fourth week, and 30 min and 18 m/min in the fifth week (9).
3.3. Tissue Sampling
At the end of the experiment, rats were euthanized by using a combination of xylazine (10 mg/kg) and ketamine (100 mg/kg). Removed cerebellum tissues were frozen at -70°C for further analysis.
3.4. Assessment of Oxidant/Antioxidant Factors
3.4.1. Sample Preparation
The cerebellum was homogenized in 1 ml of ice-cold lysis buffer (50 mM Tris-HCl, pH 7.4, 150 mM NaCl, 1% NP-40, 1% Triton X-100, 200 mM NaF) containing protease inhibitor cocktail (Sigma, St. Louis, MO, USA). The supernatants were collected and stored at -70°C until use. The protein concentration of the supernatant was estimated using the Bradford technique.
3.4.2. Lipid Peroxidation Assay
The MDA level in cerebellum tissue was measured using the thiobarbituric acid reactive substance (TBARS) assay as described previously (10). The results of MDA were expressed as nmol/mg of protein.
3.4.3. Assay of Antioxidant Enzymes Activity
Catalase activity was determined spectrophotometrically as described previously (11). The level of superoxide dismutase (SOD) was measured by using a RANSOD kit (Randox labs. Crumlin, UK) as recommended by the manufacturer. The SOD activity was expressed as U/mg protein. The activity of glutathione peroxidase (GPx) was measured according to the manufacturer’s instruction by ZellBio kit (Zell Bio, GmBH Germany). The GPx activity was expressed as U/mg protein.
3.5. Gene Expression Analysis of Apoptotic Genes
3.5.1. Total RNA Isolation and cDNA Synthesis
The total RNA was isolated from 100 mg cerebellum using an RNXTM RNA isolation kit (SinaClon. Inc, Iran). The RNA quantity and quality were discovered using Eppendorf µCuvette G1.0 micro-volume measuring cell (Eppendorf BioPhotometer D30, Eppendorf, Germany). As reported by the manufacturer, 1 μg of total RNA for each sample was reversely copied out by the YTA cDNA synthesis kit using random primers (Yektatajhiz Company, Iran).
3.5.2. qReal-Time PCR Analysis
The real-time PCR was performed using the Lightcycler® Detection System (Roche, USA) by the qPCRTM Green Master Kit for SYBR Green I® (Yektatajhiz Company, Iran) as recommended by the manufacturers. Table 1 shows the oligonucleotide sequences. Relative expression levels of the target genes were compared to rat GAPDH as the housekeeping gene. The thermal program consisted of 95°C for 5 min, followed by 40 cycles of 94°C for 15 s, 60°C for 15 s, and 72°C for 30 s. The experiments were performed with three replications. The results were analyzed by Lightcycler 96® software using the comparative 2-ΔΔCt method. All qPCR analyses were performed according to the minimum information for publication of quantitative real-time PCR experiments (MIQE) guideline (12).
| Gene Name | Sequences | Size (bp) | GenBank Accession No. |
|---|---|---|---|
| Bax | 145 | NM_017059.2 | |
| F | TGCTACAGGGTTTCATCCAG | ||
| R | TGTTGTTGTCCAGTTCATCG | ||
| Bcl2 | 135 | NM_016993.1 | |
| F | ATCGCTCTGTGGATGACTGAGTAC | ||
| R | AGAGACAGCCAGGAGAAATCAAAC | ||
| Caspase3 | 181 | XM_006253130.3 | |
| F | AATTCAAGGGACGGGTCATG | ||
| R | CAGATCCCGTGTATTGTGTCA | ||
| GAPDH | 119 | XM_017593963.1 | |
| F | AGTTCAACGGCACAGTCAAG | ||
| R | TACTCAGCACCAGCATCACC |
3.6. Evaluation of Cytosolic Level of Cytochrome c
To obtain the cytosolic protein, tissues were minced and gently homogenized with four volumes of ice-cold lysis buffer containing 0.25 M sucrose, 10 mM Tris-HCl, pH 7.4, 1 mM EDTA, 250 μg/mL bovine serum albumin, and protease inhibitor cocktail (Sigma, St. Louis, MO, USA). Samples were then centrifuged at 14,000 × g for 15 min at 4°C, and the supernatants were stored at -80°C. Cytochrome c concentrations were measured using rat-specific ELISA kits (MyBioscience, USA) and expressed as ng/mg protein.
3.7. Statistical Analysis
All statistical surveys were performed using SPSS version 20 software (SPSS Inc., Chicago, IL, USA). Data were presented as mean ± SEM. Initially, the normal distribution of data and the homogeneity of variances were checked using the Shapiro-Wilk and Leven tests. One-way Analysis of Variance (ANOVA) and Tukey post hoc test were applied for multiple comparisons of different factors between the groups. A significance level of P < 0.05 was considered for all tests.
4. Results
4.1. Cerebellar Oxidant/Antioxidant Status in Diabetic Rats Following Exercise Training
As shown in Table 2, rats in the DC group showed decreased levels of SOD and catalase activity in the cerebellum six weeks after diabetes induction compared to healthy animals (P < 0.05). Although SOD and catalase activities increased in the cerebellum of diabetic rats (TD group) after endurance training (P < 0.05), they had lower levels compared to healthy animals (CON and TH groups), and their levels did not return to the normal value (P < 0.05) (Table 2). Healthy rats in the exercise group (TH) had higher cerebellar catalase and SOD activities compared to the normal control group (CON group) (P < 0.05) (Table 2).
Besides, GPx activity showed a significant elevation in the cerebellum of diabetic rats compared to healthy animals (P < 0.05) (Table 2). Our exercise protocol had no significant effect on cerebellar GPX activity when compared to the diabetes control group (P > 0.05) (Table 2).
The results showed that diabetic induction caused a significant increase in the cerebellar MDA concentration, and the six-week endurance training could attenuate the observed elevation of MDA in the cerebellum of diabetic rats (P < 0.05) (Table 2). Cerebellar MDA levels were significantly decreased in the normal exercise group following the six-week endurance training when compared to the normal control group (P < 0.05) (Table 2).
| Group Name | SOD (U/mg Protein) | GPx (U/mg Protein) | Catalase (U/mg Protein) | MDA (nmol/mg Protein) |
|---|---|---|---|---|
| Control (CON) | 5.18 ± 0.60 A | 4.78 ± 1.44 A | 2.53 ± 0.49 A | 2.64 ± 0.98 A |
| Diabetes (DC) | 2.07 ± 0.41 B | 3.37 ± 0.76 B | 0.81 ± 0.15 B | 6.81 ± 1.34 B |
| Normal exercise (TH) | 6.55 ± 0.56 C | 4.84 ± 0.62 A | 3.59 ± 0.37 C | 1.72 ± 0.59 C |
| Diabetes exercise (TD) | 3.70 ± 0.64 D | 3.42 ± 0.73 B | 1.36 ± 0.23 D | 4.33 ± 1.03 D |
Abbreviations: CON, normal control group; TH, normal exercise group; DC, diabetes control group; TD, diabetes exercise group.
aValues are presented as mean ± SEM.
bDifferent letters in each column demonstrate significant differences at P < 0.05.
4.2. Endurance Training and Expression of Apoptosis-Related Genes
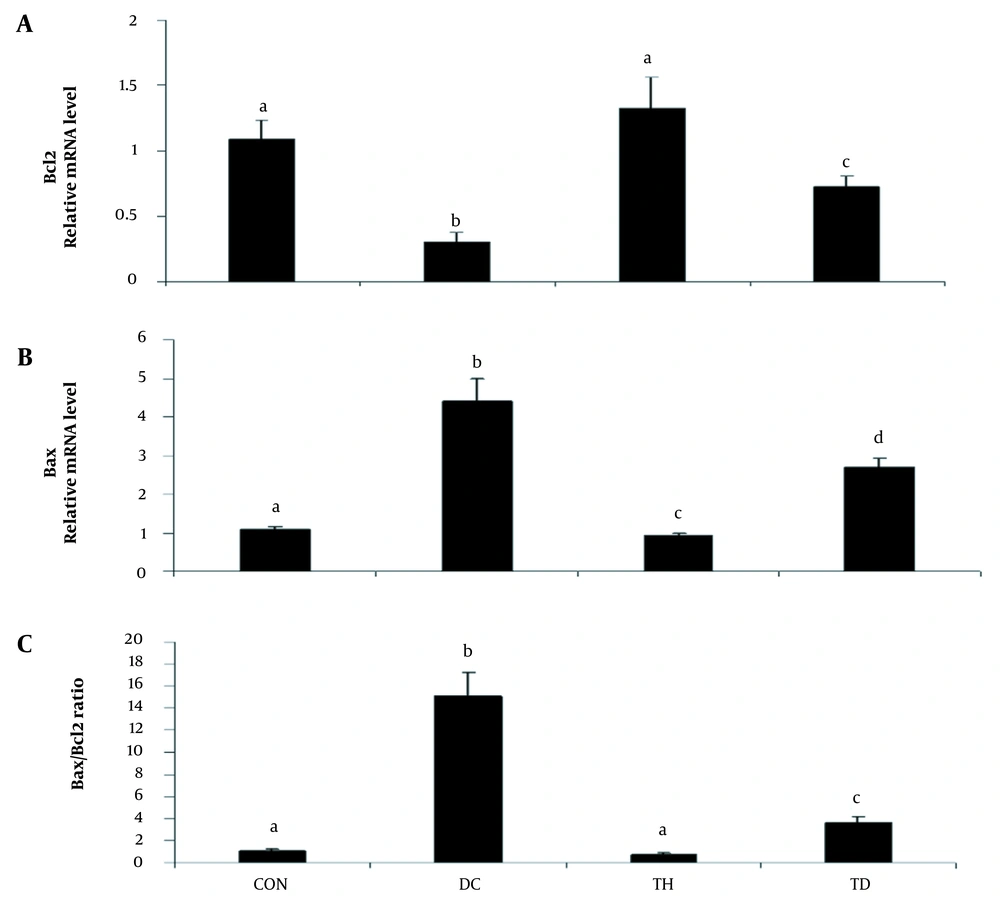
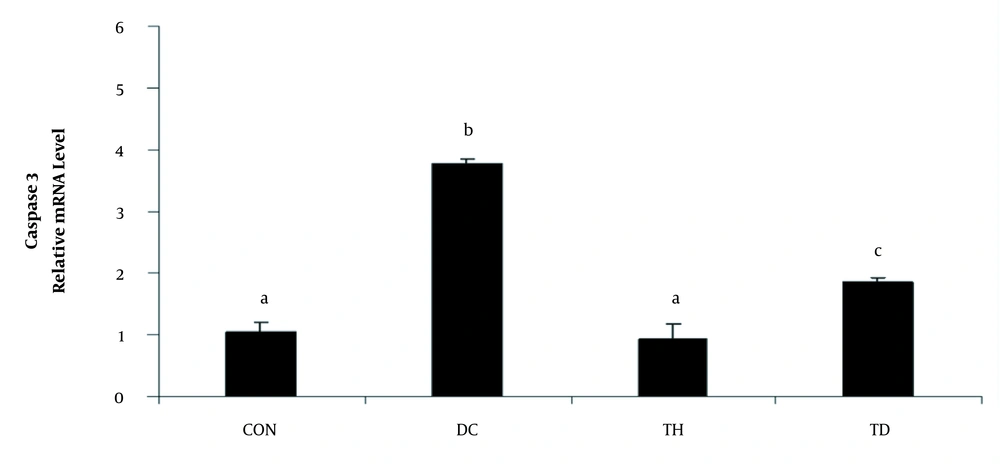
As shown in Figures 1 and 2, the analysis of the transcription of bax, bcl2, and caspase3 mRNA showed increased levels of bax and caspase 3 and decreased levels of bcl2 genes in the cerebellum of diabetic animals when compared to the normal control group (P < 0.05). A higher bax/bcl2 ratio was observed in the cerebellum of rats following diabetes induction compared to the normal control group (P < 0.05) (Figure 1C). Six weeks of treadmill exercise training could attenuate the expression levels of bax, bcl2 (Figure 1A and B), and caspase3 (Figure 2) genes and could reduce the bax/bcl2 ratio (Figure 1C). Six weeks of endurance training had no significant effect on the gene expression of bax in the cerebellum of the normal control group (P > 0.05) (Figure 1A), while it could significantly increase the mRNA level of bcl2 in the normal exercise group (P < 0.05) (Figure 1B).
The relative expression of Bax (A), Bcl2 (B), and Bax/Bcl2 expression ratio (C) in the cerebellum of diabetic rats in different groups. Values are presented as mean ± SEM. Different letters demonstrate significant differences between groups at P < 0.05. CON: normal control group; TH: normal exercise group; DC: diabetes control group; TD: diabetes exercise group.
The relative expression of caspase 3 in the cerebellum of different experimental animals. Values are presented as mean ± SEM. Different letters demonstrate significant differences between groups at P < 0.05. CON: normal control group; TH: normal exercise group; DC: diabetes control group; TD: diabetes exercise group.
4.3. Effect of Endurance Training on Cytochrome c
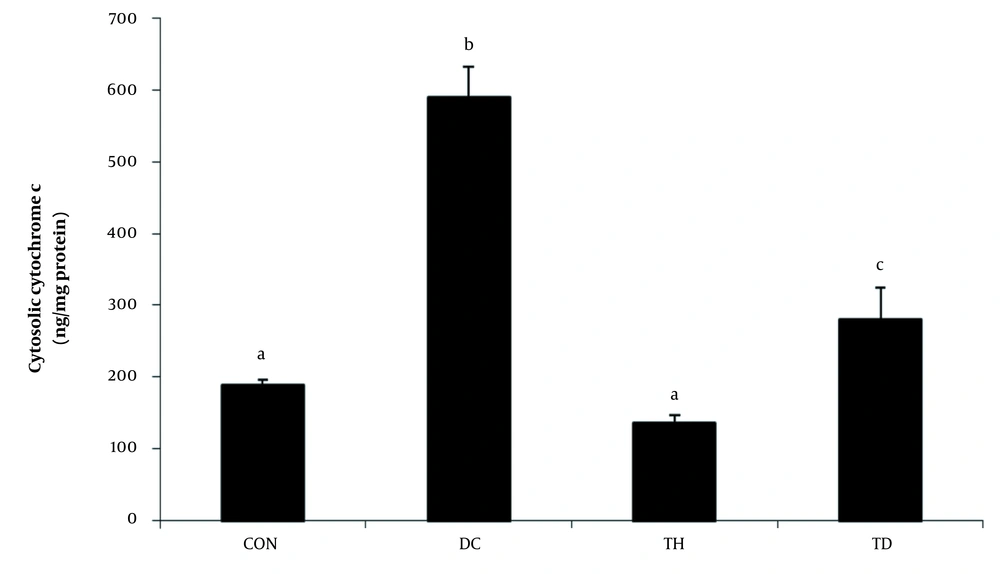
A significant elevation in the cytoplasmic levels of cytochrome c was observed in the cerebellum of diabetic rats six weeks after diabetes induction (P < 0.05) (Figure 3). Our results showed that the levels of cytochrome c were decreased in the cerebellum of diabetic rats following six weeks of endurance training (P < 0.05) (Figure 3). The normal exercise group showed lower levels of cytoplasmic cytochrome c concentration compared to the normal control group (P < 0.05) (Figure 3).
Cytosolic levels of cytochrome c in the cerebellum of different experimental animals. Values are presented as mean ± SEM. Different letters demonstrate significant differences between groups at P < 0.05. CON: normal control group; TH: normal exercise group; DC: diabetes control group; TD: diabetes exercise group.
5. Discussion
The results of the present study demonstrated that diabetic rats showed the upregulation of the pro-apoptotic genes (caspase 3 and bax) and decreased levels of the anti-apoptotic gene (bcl2) in the cerebellum six weeks after diabetes induction compared to healthy animals. Apoptosis incidence was further confirmed by the detection of the increased cytosolic level of cytochrome c in the cerebellum of diabetic rats. The results also showed the elevation of MDA concentration and the reduction of antioxidant enzymes, catalase, SOD, and GPx, in the cerebellum of diabetic rats, confirming the incidence of oxidative stress following prolonged hyperglycemia. Endurance training for six weeks could attenuate apoptosis-related changes concomitant with the elevation of antioxidant capacity of the cerebellum in diabetic rats. Our results showed that the cerebellar activities of SOD and catalase increased in the cerebellum of diabetic rats following endurance training compared to the diabetes control group, while GPX activity had no obvious change at the end of the experiment. The release of cytochrome c, as the final effector of apoptosis, and the bax/bcl2 expression ratio, as an initial modulator of apoptosis pathway, also reduced in the diabetes exercise group.
The results of previous research have proven the role of oxidative stress in nerve damage in the diabetic brain and the positive effects of endurance training on diabetes-associated oxidative stress (7). Radak et al. (13) showed that physical exercise increased the activity of SOD in the stem and corpus striatum, while other brain areas did not change as in the cerebellum. Aksu et al. (14) reported that endurance training increased SOD antioxidant enzyme levels in different parts of the brain, such as the hippocampus, and enhanced the antioxidant capacity of the brain. Taken together, we suggest that the regulation of the antioxidant defense system in different regions of the brain by physical exercise probably depends on the type, intensity, and duration of physical exercise, as well as the health and pathophysiological status of experimental animals, which need to be precisely determined in future studies.
In our study, we found that endurance exercise could reduce the levels of cytochrome c in the cytosol and downregulate the expression of the main initiators of the intrinsic pathway of apoptosis such as caspase 3 and bax in the cerebellum of diabetic animals. In line with our findings, cerebellar alterations such as increased cell death, activation of caspases 3 and 6, and decrease of cell proliferation have been found in the cerebellum of STZ-induced diabetic rats, suggesting the incidence of apoptosis in the cerebellum following chronic hyperglycemia (15). The results of a study by Jafari Anarkooli et al. (16) showed that after eight weeks of diabetes induction using STZ, bax expression considerably increased in the hippocampus of STZ-induced diabetic rats, while the expression of Bcl-2 reduced.
The causes of oxidative stress and release of final effectors of apoptosis in the cerebellum of diabetic rats demonstrated in our study may be due to mitochondrial dysfunction and beneficial effects of our exercise protocol on these alterations, which may be related to the improvement of mitochondrial biogenesis (17). Recent research has shown that exercise can balance the NAD+/NADH ratio and prevent NAD+ accumulation in mitochondria by the activation of mitochondrial shuttles of NAD+, NAM phosphoribosyl transferase, PPAR related O2 consumption, and uncoupling of ATP synthesis (18). It is also possible that exercise can inhibit NAD+ accumulation and subsequent apoptotic events by reducing the blood glucose concentration and glucose uptake by the brain. To confirm this opinion, recent research by Honkala et al. (19) showed that aerobic interval exercise could reduce the brain glucose uptake in different regions of the brain cortex. Further studies are needed to determine the signaling pathways of endurance training to reduce the apoptotic factors in the cerebellum of diabetic animals.
5.1. Conclusions
The present study provided the first evidence that six weeks of endurance exercise training improved the oxidative defense system and attenuated apoptosis events in the cerebellum of diabetic rats. Further studies are needed to identify the best time to start aerobic exercise after diabetes incidence and the best exercise protocol with various durations and intensities to obtain the best effects.


