
1. Background
Breast cancer (BC) is the second most prevalent cancer in females (1). This cancer is the second cause of mortality in developing countries and the most significant cause in developed countries (2). Many factors may be responsible for susceptibility to BC, such as estrogen, diet, lifestyle, environmental chemicals, oxidative stress, and carbon dioxide, which are involved in the progression and pathogenesis of BC (3). Oxygen-free radicals (OFR) are oxidative stress agents found in cells subjected to an aerobic environment in pathological and physiological conditions in breast tissues (1). A balance is found between antioxidant defense and free radicals at normal cellular levels. The polymorphisms of enzyme-releasing genes possibly contribute to the elimination of free radicals, affecting the sensitivity of individuals to BC. Various antioxidant systems, including PON1 (paraoxonase1), are available against oxidative stress (4). The PON1 enzyme is produced in the human liver and then transmitted to the bloodstream, where it is linked to high-density lipoprotein (HDL) (4). Besides, PON1 is an HDL-dependent enzyme that maintains the function and integrity of HDL with an antioxidant action for Low-density Lipoprotein (LDL) antioxidants, which are more sensitive against oxidation (5, 6). The PON1 gene is one of the multifactorial enzymes of the family of paraoxonase gene antioxidants (EC.3.1.1.2) (4, 7). With the advancement of genetic studies of PON1, PON1-L55M, and PON1-Q192R, as the commonest functional genetic polymorphisms in PON1, are found at positions 55 and 192 (8). The PON1-Q192R polymorphism (rs662A>G) is due to the substitution of glutamine (Q genotype) for arginine (R genotype) 192 of the gene 6 exons of the PON1 gene (9). Besides, PON1-L55M (rs854560) is caused by replacing 55 leucine (L genotype) with methionine (M genotype) at third exon 55 (9). Also, Q192R and L55M, as two functional SNPs, are linked to the risk of different tumors (9).
Due to the importance of PON1 to develop tumors and the relationship between phenotypes and genotypes, it was speculated that the PON1 gene Q192R variation and L55M could be associated with tumor vulnerability. Several studies have been conducted in the last two decade to examine the relationship between PON1 polymorphism and BC risk (3, 7, 10-19).
2. Objectives
This study conducted a comprehensive meta-analysis to determine the relationship between L55M and Q192R polymorphisms and BC risk. We performed a more comprehensive analysis by examining all data obtained from studies before December 2021.
3. Methods
3.1. Search Strategy
PubMed, Embase, Google Scholar, and Web of Science databases were searched for all related articles before December 2021 using the keywords paraoxonase1 or PON1, Q192R, L55M, and BC. We also manually searched references for further articles or studies on this topic. All the studies were limited to humans.
3.1.1. Inclusion and Exclusion Criteria
We selected articles based on the following criteria: (1) Reports evaluating the relationship between PON1-Q192R or PON1-L55M polymorphisms and BC risk, (2) studies on patients and controls, and (3) studies controlling the frequency of specific genotypes in cases and controls (from the text of the article). In addition, we did not include (1) reports that only surveyed patient samples, (2) no specific genotypic studies of PON1-L55M or PON1-Q192R polymorphisms, (3) animal studies, (4) repeated studies, (5) case reports, and (6) review studies.
3.2. Data Extraction
All papers were double-checked, and data were extracted by a standard form. For each report, the following information was collected: (1) First author name, (2) publication year, (3) country, (4) ethnicity, (5) genotypic methods, (6) source of controls, (7) the number of patients, (8) the number of genotypes for three polymorphisms in controls and patients, and (9) P-value for Hardy-Weinberg equilibrium (HWE) in controls.
3.3. Statistical Analysis
Odds ratio (OR) and confidence intervals (95% CIs) were applied to assess the relationship between PON1-L55M or PON1-Q192R polymorphisms and BC risk in five genetic models: allele contrast (R vs. Q; L vs. M), homozygote (RR vs. QQ; MM vs. LL), heterozygote (QR vs. QQ; LM vs. LL), recessive (RR vs. QR/QQ; MM vs. LM/LL), and dominant (QQ vs. RR/QR; LL vs. MM/LM). We also conducted subgroup analyses based on ethnicity and genotyping methods. We calculated the heterogeneity of the studies by Cochran's QQ statistical test (chi-square test) (20). The heterogeneity was determined by calculating the P-values (21), and a P > 0.10 indicated the lack of significant heterogeneity. Besides, ORs were pooled using the fixed-effects model; otherwise, we used the random-effects model (22). Also, sensitivity analysis was used for estimating the data stability. Data analysis was done with STATA 14.0 software, and a P < 0.05 was regarded as significant.
For each control group in the studies, the observed frequency of the PON1-L55M or PON1-Q192R polymorphism for HWE was evaluated using χ2 statistics (23). The control group agreed with the HWE if the P-value was < 0.05. We used this website to calculate the data and obtain CI, OR, P-value, and Q-statistic.

Flow chart of meta-analysis for inclusion and exclusion of articles
4. Results
4.1. Study Characteristics
Twelve case-control publications, including 2,519 cases and 3,250 controls, met the inclusion criteria (Tables 1 and 2) (3, 7, 10-19). Figure 1 shows the flow chart of the articles’ screening process. Also, 10 studies with 3,000 controls and 2,286 cases were done on the PON1-Q192R polymorphism (Table 1), and eight articles including 2,159 controls and 2,259 cases were found on the PON1-L55M polymorphism (Table 2).
| Study | Year | Controls/Cases | Genotyping Method | Country (Ethnicity) | Source of Controls | Genotypes of Controls | Genotypes of Cases | |||||
|---|---|---|---|---|---|---|---|---|---|---|---|---|
| QR | RR | HWE a < 3.84 | QR | RR | ||||||||
| Wu et al. (15) | 2017 | 378/365 | TaqMan | China (East Asian) | H-B b | 167 | 156 | 55 | 3.42 | 155 | 156 | 54 |
| Kaya et al. (14) | 2016 | 35/32 | TaqMan | Turkey (Caucasian) | H-B | 5 | 13 | 17 | 0.88 | 10 | 11 | 11 |
| Bayati (12) | 2016 | 100/83 | PCR-RFLP | Iran (Iranian) | H-B | 8 | 83 | 9 | 43.6 c | 2 | 62 | 19 |
| Rinaldi (11) | 2014 | 152/144 | PCR-RFLP | Europe (Southern Italy) | H-B | 143 | 7 | 2 | 14.62 c | 110 | 30 | 4 |
| Hussein et al. (10) | 2011 | 100/100 | PCR-RFLP | Egypt (Caucasian) | P-B d | 46 | 42 | 12 | 0.25 | 51 | 41 | 8 |
| Naidu et al. (7) | 2010 | 252/387 | PCR-RFLP | Malaysia (East Asian) | P-B | 115 | 115 | 22 | 0.81 | 200 | 158 | 29 |
| Antognelli et al. (3) | 2009 | 544/547 | PCR-RFLP | Italy (Caucasian) | P-B | 340 | 152 | 52 | 27.19 c | 484 | 50 | 13 |
| Gallicchio et al. (19) | 2007 | 904/58 | PCR-RFLP | USA (Caucasian) | P-B | 469 | 353 | 82 | 1.93 | 38 | 15 | 5 |
| Ağaçhan et al. (18) | 2006 | 52/87 | PCR-RFLP | Turkey (Causasian) | P-B | 17 | 29 | 6 | 1.461 | 17 | 4 | 12 |
| Stevens et al. (17) | 2006 | 483/483 | PCR-RFLP | USA (Causasian) | P-B | 238 | 198 | 47 | 0.38 | 259 | 182 | 42 |
Studies Assessed in the Meta-analysis for Q192R Polymorphism
| Study | Year | Controls/Cases | Genotyping Method | Country (Ethnicity) | Source of Controls | Genotypes of Controls | Genotypes of Cases | |||||
|---|---|---|---|---|---|---|---|---|---|---|---|---|
| LL | LM | MM | HWE a < 3.84 | LL | LM | MM | ||||||
| Ramzanpour et al. (16) | 2020 | 150/150 | PCR-RELP | Iran (Iranian) | H-B | 66 | 59 | 25 | 3.41 (Y) | 47 | 65 | 38 |
| Wu et al. (15) | 2017 | 378/365 | TaqMan | China (East Asian) | H-B b | 346 | 30 | 2 | 3.24 (Y) | 284 | 72 | 9 |
| Hamta et al. (13) | 2016 | 100/83 | PCR-RELP | Iran (Iranian) | H-B | 4 | 81 | 15 | 40.93 c (N) | 2 | 69 | 12 |
| Rinaldi (11) | 2014 | 152/144 | PCR-RELP | Europe (Southern Italy) | H-B | 130 | 7 | 15 | 95.69 c | 70 | 58 | 16 |
| Hussein et al. (10) | 2011 | 100/100 | PCR-RELP | Egypt (Caucasian) | P-B d | 35 | 23 | 6 | 0.58 (y) | 19 | 21 | 60 |
| Naidu et al. (7) | 2010 | 252/387 | PCR-RFLP | Malaysia (East Asian) | H-B | 126 | 109 | 17 | 1.04 (Y) | 159 | 178 | 50 |
| Antognelli et al. (3) | 2009 | 544/547 | PCR-RFLP | Italy (Caucasian) | P-B | 188 | 125 | 231 | 157.2 c (N) | 107 | 155 | 325 |
| Stevens et al. (17) | 2006 | 483/483 | PCR-RFLP | USA (Caucasian) | P-B | 202 | 233 | 58 | 0.88 (Y) | 176 | 230 | 77 |
Studies Assessed in the Meta-analysis for L55M Polymorphism
Moreover, regarding the PON1-Q192R polymorphism, three studies were done in Asians and seven studies in Caucasians. Also, we found two studies utilizing the TaqMan assay, whereas eight studies used PCR-RFLP. Regarding the PON1-L55M polymorphism, four studies were done on each of Asians and Caucasians. In addition, one study utilized the TaqMan assay, and seven studies used PCR-RFLP.
4.2. Meta-analysis
4.2.1. Association Between PON1-Q192R and Breast Cancer Susceptibility
In the allele contrast model, there was a relationship between the PON1-Q192R allele and decreased BC risk (Table 3): R vs. Q: OR = 0.793, 95%CI = 0.726 - 0.866; RR vs. QQ: OR = 0.756, 95%CI = 0.623 - 0.918; QR vs. QQ: OR = 0.721, 95%CI = 0.640 - 0.812; and RR+RQ vs. QQ: OR = 0.728, 95%CI = 0.652 - 0.813.
| Variables | Cases/Controls | df | Q-statistics | OR | 95% CI | P-value a |
|---|---|---|---|---|---|---|
| Q192R polymorphism | ||||||
| All studies | 2286/3000 | |||||
| R vs. Q | 9 | 5.17 | 0.7932 | 0.7264 - 0.8660 | < 0.0001 | |
| QR vs. QQ | 9 | 5.391 | 0.721 | 0.6402 - 0.8120 | < 0.0001 | |
| RR vs. QQ | 9 | 2.824 | 0.7565 | 0.6233 - 0.9182 | 0.0047 | |
| QR+RR vs. QQ | 9 | 5.608 | 0.7284 | 0.6521 - 0.8137 | < 0.0001 | |
| RR vs. QQ+QR | 9 | 1.588 | 0.8585 | 0.7112 - 1.0364 | 0.1123 | |
| HWE | ||||||
| Y (three studies excluded) | 1512/2204 | |||||
| R vs. Q | 6 | 0.906 | 0.9543 | 0.8623 - 1.0560 | 0.3648 | |
| QR vs. QQ | 6 | 1.369 | 0.9062 | 0.7869 - 1.0435 | 0.1711 | |
| RR vs. QQ | 6 | 0.295 | 0.9673 | 0.7758 - 1.2061 | 0.7678 | |
| QR+RR vs. QQ | 6 | 1.251 | 0.919 | 0.8051 - 1.0491 | 0.2111 | |
| RR vs. QQ+QR | 6 | 3.691 | 0.6686 | 0.5399 - 0.8280 | 0.0002 | |
| N (three studies excluded) | 774/796 | |||||
| R vs. Q | 2 | 6.637 | 0.5336 | 0.4432 - 0.6423 | < 0.0001 | |
| QR vs. QQ | 2 | 5.957 | 0.8434 | 0.3806 - 0.6140 | < 0.0001 | |
| RR vs. QQ | 2 | 3.462 | 0.4708 | 0.3073 - 0.7212 | 0.0005 | |
| QR+RR vs. QQ | 2 | 6.521 | 0.4808 | 0.3858 - 0.5992 | < 0.0001 | |
| RR vs. QQ+QR | 2 | 3.912 | 0.429 | 0.2807 - 0.6555 | 0.0001 | |
| Ethnicities | ||||||
| Caucasians | 1332/2183 | |||||
| R vs. Q | 6 | 8.125 | 0.6197 | 0.5522 - 0.6956 | < 0.0001 | |
| QR vs. QQ | 6 | 7.791 | 0.5445 | 0.4673 - 0.6345 | < 0.0001 | |
| RR vs. QQ | 6 | 4.376 | 0.5657 | 0.4384 - 0.7302 | < 0.0001 | |
| QR+RR vs. QQ | 6 | 8.484 | 0.5347 | 0.4626 - 0.6179 | < 0.0001 | |
| RR vs. QQ+QR | 6 | 2.937 | 0.6868 | 0.5345 - 0.8825 | 0.0033 | |
| Asians | 954/817 | |||||
| R vs. Q | 2 | 0.757 | 0.9448 | 0.8158 - 1.0943 | 0.4489 | |
| QR vs. QQ | 2 | 1.362 | 0.8628 | 0.6978 - 1.0669 | 0.1731 | |
| RR vs. QQ | 2 | 0.224 | 0.9635 | 0.6954 - 1.3349 | 0.8229 | |
| QR+RR vs. QQ | 2 | 1.213 | 0.8825 | 0.7211 - 1.0799 | 0.2249 | |
| RR vs. QQ+QR | 2 | 0.264 | 1.042 | 0.7675 - 1.4148 | 0.7919 | |
| Source of controls | ||||||
| Population-based | 1662/2335 | |||||
| R vs. Q | 5 | 7.728 | 0.6577 | 0.5914 - 0.7314 | < 0.0001 | |
| QR vs. QQ | 5 | 7.35 | 0.5911 | 0.5138 - 0.6801 | < 0.0001 | |
| RR vs. QQ | 5 | 4.436 | 0.576 | 0.4514 - 0.7350 | < 0.0001 | |
| QR+RR vs. QQ | 5 | 7.95 | 0.5881 | 0.5159 - 0.6703 | < 0.0001 | |
| RR vs. QQ+QR | 5 | 2.98 | 0.6956 | 0.5478 - 0.8831 | 0.0029 | |
| Hospital-based | 624/665 | |||||
| R vs. Q | 3 | 1.561 | 1.1394 | 0.9672 - 1.3422 | 0.1186 | |
| QR vs. QQ | 3 | 1.279 | 1.1661 | 0.9215 - 1.4756 | 0.2009 | |
| RR vs. QQ | 3 | 1.222 | 1.2363 | 0.8798 - 1.7372 | 0.2216 | |
| QR+RR vs. QQ | 3 | 1.503 | 1.1831 | 0.9502 - 1.4731 | 0.1328 | |
| RR vs. QQ+QR | 0.857 | 1.1512 | 0.8343 - 1.5886 | 0.3914 | ||
| Genotyping method | ||||||
| PCR-RFLP | 1745/1613 | |||||
| R vs. Q | 7 | 6.295 | 0.7276 | 0.6591 - 0.8034 | < 0.0001 | |
| QR vs. QQ | 7 | 6.313 | 0.6561 | 0.5757 - 0.7479 | < 0.0001 | |
| RR vs. QQ | 7 | 3.395 | 0.6743 | 0.5371 - 0.8466 | 0.0007 | |
| QR+RR vs. QQ | 7 | 6.665 | 0.6596 | 0.5837 - 0.7455 | < 0.0001 | |
| RR vs. QQ+QR | 7 | 2.111 | 0.7868 | 0.6298 - 0.9830 | 0.0347 | |
| TaqMan | 541/1387 | |||||
| R vs. Q | 1 | 0.203 | 0.9794 | 0.8010 - 1.1975 | 0.8394 | |
| QR vs. QQ | 1 | 0.192 | 1.0301 | 0.7614 - 1.3936 | 0.8476 | |
| RR vs. QQ | 1 | 0.299 | 0.9411 | 0.6323 - 1.4005 | 0.7646 | |
| QR+RR vs. QQ | 1 | 0.024 | 1.0035 | 0.7588 - 1.3271 | 0.9805 | |
| RR vs. QQ+QR | 1 | 0.402 | 0.9273 | 0.6419 - 1.3395 | 0.6873 |
Odds Ratios and 95% Confidence Intervals of the Relationship Between Q192R Polymorphism in PON1 Gene and Breast Cancer Risk a
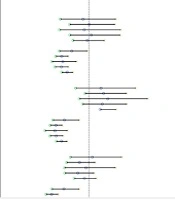
Also, based on race, a decreased cancer risk was detected in the recession model (RR+RQ vs. RR: OR = 0.5404, 95%CI = 0.4673 - 0.6248) in Caucasians (Figure 2). Consistently, in the stratification assessment of the control group, the overall risk of BC reduced in the heterozygote comparison and dominant model (RQ vs. QQ: OR = 0.5911, 95%CI = 0.5138 - 0.6801; RR+RQ vs. QQ: OR = 0.5881, 95%CI = 0.5159 - 0.6703) in the population-based group (Figure 2). Besides, risk factors were found in the subgroup analysis based on the genotyping method. Figure 2 shows the Forest plot of the meta-analysis of the relationship between cancer risk and PON1-Q192R polymorphism.

Forest plot of the meta-analysis of the relationship between PON1-Q192R polymorphism and breast cancer risk. OR, odds ratio; CI, confidence interval.
4.2.2. Association Between PON1-L55M and Breast Cancer
The PON1-L55M polymorphism showed a significant association with increased BC risk in all genetic models (Table 4): M vs. L: OR = 1.6041, 95%CI = 1.4712 - 1.7490; MM vs. LL: OR = 2.0198, 95%CI = 1.7249 - 2.3650; ML vs. LL: OR = 1.6142, 95%CI = 1.4103 - 1.8476; MM vs. ML+LL: OR = 1.6391, 95%CI = 1.4161 - 1.8972; and ML+MM vs. LL: OR = 1.7587, 95%CI = 1.5602 - 1.9823. Figure 3 shows the Forest plot of the meta-analysis of the association between BC risk and PON1-L55M polymorphism. Consistently, there was an increased risk in the five genetic models in Caucasians: M vs. L: OR = 2.2304, 95% CI = 2.0017 - 2.4852; MM vs. LL: OR = 2.3005, 95% CI = 1.8946 - 2.7933; ML vs. LL: OR = 1.7842, 95% CI = 1.4781 - 2.1537; MM vs. ML+LL: OR = 1.7393, 95%CI = 1.4665 - 2.0628; and ML+MM vs. LL: OR = 2.0135, 95%CI = 1.7093 - 2.3718, Asians: M vs. L: OR = 1.5108, 95% CI = 1.3040 - 1.7505; MM vs. LL: OR = 2.0352, 95% CI = 1.4493 - 2.8579; ML vs. LL: OR = 1.5162, 95% CI = 1.2455 - 1.8457; MM vs. ML+LL:OR = 1.7315, 95%CI = 1.2438 - 2.4103; and ML+MM vs. LL: OR = 1.6068, 95%CI = 1.3360 - 1.9324 (Table 4), hospital - based groups: M vs. L: OR = 0.6667, 95%CI = 0.5649 - 0.7869; MM vs. LL: OR = 2.198, 95%CI = 1.4836 - 2.7499; ML vs. LL: OR = 1.8479, 95%CI = 1.5340 - 2.2262; MM vs. ML+LL: OR = 1.6118, 95%CI = 1.1931 - 2.1774; and ML+MM vs. LL: OR = 1.8833, 95%CI = 1.5838 - 2.2394, and population - based groups: M vs. L: OR = 1.6781, 95%CI = 1.4922 - 1.8872; MM vs. LL: OR = 2.204, 95%CI = 1.7908 - 2.7124; ML vs. LL:OR = 1.4996, 95%CI = 1.2238 - 1.8376; MM vs. ML+LL: OR = 1.7829, 95%CI = 1.4928 - 2.1293; and ML+MM vs. LL:OR = 1.807, 95%CI = 1.5116 - 2.1601. Also, an increased risk was detected based on the genotyping method.
| Variables | Cases/Controls | df | Q-statistics | OR | 95% CI | P-Value a |
|---|---|---|---|---|---|---|
| L55M polymorphism | ||||||
| All studies | 2286/3000 | |||||
| M vs. L | 7 | 10.711 | 1.6041 | 1.4712 - 1.7490 | < 0.0001 | |
| LM vs. LL | 7 | 6.95 | 1.6142 | 1.4103 - 1.8476 | < 0.0001 | |
| MM vs. LL | 7 | 8.731 | 2.0198 | 1.7249 - 2.3650 | < 0.0001 | |
| LM+MM vs. LL | 7 | 9.243 | 1.7587 | 1.5602 - 1.9823 | < 0.0001 | |
| MM vs. LL+LM | 7 | 6.624 | 1.6391 | 1.4161 - 1.8972 | < 0.0001 | |
| HWE | ||||||
| Y (three studies excluded) | 1512/2204 | |||||
| M vs. L | 4 | 7.946 | 1.5975 | 1.4232 - 1.7932 | < 0.0001 | |
| LM vs. LL | 4 | 4.196 | 1.4105 | 1.2011 - 1.6563 | < 0.0001 | |
| MM vs. LL | 4 | 7.027 | 2.4513 | 1.9089 - 3.1479 | < 0.0001 | |
| LM+MM vs. LL | 4 | 6.269 | 1.6105 | 1.3876 - 1.8693 | < 0.0001 | |
| MM vs. LL+LM | 4 | 6.138 | 2.1286 | 1.6724 - 2.7092 | < 0.0001 | |
| N (three studies excluded) | 774/796 | |||||
| M vs. L | 2 | 8.317 | 1.8123 | 1.5754 - 2.0849 | < 0.0001 | |
| LM vs. LL | 2 | 6.669 | 2.3816 | 1.8455 - 3.0735 | < 0.0001 | |
| MM vs. LL | 2 | 7.175 | 2.4331 | 1.9083 - 3.1019 | < 0.0001 | |
| LM+MM vs. LL | 2 | 7.906 | 2.4099 | 1.9378 - 2.9971 | < 0.0001 | |
| MM vs. LL+LM | 2 | 4.358 | 1.5696 | 1.2815 - 1.9224 | < 0.0001 | |
| Ethnicities | ||||||
| Caucasians | 1332/2183 | |||||
| M vs. L | 3 | 14.533 | 2.2304 | 2.0017 - 2.4852 | < 0.0001 | |
| LM vs. LL | 3 | 6.029 | 1.7842 | 1.4781 - 2.1537 | < 0.0001 | |
| MM vs. LL | 3 | 8.412 | 2.3005 | 1.8946 - 2.7933 | < 0.0001 | |
| LM+MM vs. LL | 3 | 8.374 | 2.0135 | 1.7093 - 2.3718 | < 0.0001 | |
| MM vs. LL+LM | 3 | 6.359 | 1.7393 | 1.4665 - 2.0628 | < 0.0001 | |
| Asians | 954/817 | |||||
| M vs. L | 3 | 5.493 | 1.5108 | 1.3040 - 1.7505 | < 0.0001 | |
| LM vs. LL | 3 | 4.149 | 1.5162 | 1.2455 - 1.8457 | < 0.0001 | |
| MM vs. LL | 3 | 4.103 | 2.0352 | 1.4493 - 2.8579 | < 0.0001 | |
| LM+MM vs. LL | 3 | 5.037 | 1.6068 | 1.3360 - 1.9324 | < 0.0001 | |
| MM vs. LL+LM | 3 | 3.253 | 1.7315 | 1.2438 - 2.4103 | 0.0011 | |
| Source of controls | ||||||
| Population-based | 1662/2335 | |||||
| M vs. L | 2 | 8.64 | 1.6781 | 1.4922 - 1.8872 | < 0.0001 | |
| LM vs. LL | 2 | 3.908 | 1.4996 | 1.2238 - 1.8376 | < 0.0001 | |
| MM vs. LL | 2 | 7.461 | 2.204 | 1.7908 - 2.7124 | < 0.0001 | |
| LM+MM vs. LL | 2 | 6.496 | 1.807 | 1.5116 - 2.1601 | < 0.0001 | |
| MM vs. LL+LM | 2 | 6.383 | 1.7829 | 1.4928 - 2.1293 | < 0.0001 | |
| Hospital-based | 624/665 | |||||
| M vs. L | 4 | 4.793 | 0.6667 | 0.5649 - 0.7869 | < 0.0001 | |
| LM vs. LL | 4 | 6.463 | 1.8479 | 1.5340 - 2.2262 | < 0.0001 | |
| MM vs. LL | 4 | 4.466 | 2.0198 | 1.4836 - 2.7499 | < 0.0001 | |
| LM+MM vs. LL | 4 | 7.163 | 1.8833 | 1.5838 - 2.2394 | < 0.0001 | |
| MM vs. LL+LM | 4 | 3.11 | 1.6118 | 1.1931 - 2.1774 | 0.0019 | |
| Genotyping method | ||||||
| PCR-RFLP | 1745/1613 | |||||
| M vs. L | 6 | 9.445 | 1.5627 | 1.4244 - 1.7143 | < 0.0001 | |
| LM vs. LL | 6 | 13.814 | 15.431 | 10.4659 - 22.7509 | < 0.0001 | |
| MM vs. LL | 6 | 0.655 | 0.9395 | 0.7796 - 1.1323 | 0.5125 | |
| LM+MM vs. LL | 6 | 8.006 | 2.0346 | 1.7098 - 2.4210 | < 0.0001 | |
| MM vs. LL+LM | 6 | 9.350 | 0.4367 | 0.3671 - 0.5195 | < 0.0001 | |
| TaqMan | 541/1387 | |||||
| M vs. L | 0 | 5.247 | 2.9862 | 1.9845 - 4.4936 | < 0.0001 | |
| LM vs. LL | 0 | 4.633 | 2.9239 | 1.8571 - 4.6036 | < 0.0001 | |
| MM vs. LL | 0 | 2.165 | 5.4824 | 1.1751 - 25.5787 | 0.0304 | |
| LM+MM vs. LL | 0 | 5.036 | 3.0838 | 1.9895 - 4.7802 | < 0.0001 | |
| MM vs. LL+LM | 0 | 1.985 | 4.7528 | 1.0199 - 22.1487 | 0.0471 |
Odds Ratios and 95% Confidence Intervals of the Relationship Between L55M Polymorphism in PON1 Gene and Breast Cancer Risk

Forest plot of the meta-analysis of the relationship between PON1-L55M polymorphism and breast cancer risk. OR, odds ratio; CI, confidence interval.
4.2.3. Publication Bias and Sensitivity Analysis
A sensitivity analysis was done to detect individual articles' effect on the whole data by excluding a study from the pooled analysis. No study markedly influenced the pooled OR. Figure 4 shows the plot of the sensitivity analysis to evaluate the relationship between cancer risk and PON1-Q192R (RR vs. QQ). Also, we performed Begg’s funnel plot and Egger’s test to evaluate publication bias (Figure 5). The results did not reveal publication bias concerning the PON1 (Q192R and L55M) gene. Therefore, the findings are robust because of no significant publication bias in the meta-analysis.
. CI, confidence interval; OR, odds ratio. Sequentially calculated findings of each paper are omitted. Both broken line ends indicate 95% CI.")
Sensitivity analysis of PON1-Q192R in overall OR coefficients (RR vs. QQ). CI, confidence interval; OR, odds ratio. Sequentially calculated findings of each paper are omitted. Both broken line ends indicate 95% CI.
. SE, standard error; OR, odds ratio")
Funnel plot of PON1-Q192R in overall OR coefficients (RR vs. QQ). SE, standard error; OR, odds ratio
5. Discussion
As known, PON1 is one of the xenobiotic-metabolizing enzymes reducing oxidative stress. Genetic polymorphisms affect the enzyme, affecting individual sensitivity to certain pathologies (24). Different variants of PON1, such as L55M and Q192R, are biologically responsible for cancer. The PON1 (L55M and Q192R) gene polymorphisms are involved in different cancers, such as BC (15). For example, Ramzanpour et al. (16), Wu et al. (15), Rinaldi (11), Hussein et al. (10), Naidu et al. (7), Antognelli et al. (3), and Stevens et al. (17) showed a significant relationship between the PON1-L55M polymorphism and BC risk, which is consistent with our results. However, Hamta et al. (13) showed no significant association between PON1-L55M polymorphisms and BC risk.
Also, Wu et al. (15), Kaya et al. (14), Hussein et al. (10), Naidu et al. (7), Antognelli et al. (3), Gallicchio et al. (19), and Stevens et al. (17) indicated no significant relationship between the PON1-Q192R polymorphism and BC risk, which is consistent with our results. However, in studies conducted by Bayati (12), Ağaçhan et al. (18), and Rinaldi (11), there was a significant correlation between polymorphisms and BC risk, which was not in line with our results due to several reasons, including the small number of samples and errors in testing.
In our meta-analysis, a significant relationship was observed between the PON1-L55M polymorphism and BC risk in all genetic models, whereas no relationship was observed between the PON1-Q192R allele and decreased BC risk (except in the recessive model). Therefore, PON1 (L55M and Q192R) gene polymorphisms are involved in BC development. Also, genetic factors and other contributors, such as lifestyle and nutrition, have a significant effect on PON1 enzyme activity, leading to BC risk reduction (25). Besides, PON1 belongs to lipid peroxidation scavenging systems affecting BC progression (26). In the ethnographic analysis, ethnic groups showed different findings, possibly because of the living environment, genetic factors, and ethnic living habits. Earlier meta-analyses declared an association between PON1 polymorphism and breast cancer risk (9, 27-33).
For the first time, we assessed the PON1 typical functional polymorphisms in all published case-control studies in a comprehensive meta-analysis. In comparison with earlier studies, we did a more detailed analysis for demonstrating our results. The data were up-to-date and qualified studies were included, enabling us to accurately assess the relationship between PON1 gene SNPs and BC risk. Despite the relationship between PON1 (L55M and Q192R) gene polymorphism and BC risk, some limitations should be mentioned. The number of publications was limited, and Caucasians accounted for most of the registered publications.
5.1. Conclusions
PON1- Q192R can significantly decrease BC risk, and the PON1-L55M polymorphism is a risk factor for BC. Studies with a larger sample size at protein levels are needed to confirm whether PON1 polymorphisms are possible genetic markers of tumor prognosis and identify its effect on BC risk.
