1. Background
Glioblastoma multiforme (GBM), grade IV astrocytoma, is the most aggressive and lethal form of central nervous system cancer that arises from the transformation of glial cells. The incidence of GBM increases with age and differs by sex (1, 2). Current therapy methods for glioblastomas are total tumor resection and radiotherapy. Due to the limited benefits of available treatments, poor prognosis and recurrence of the disease are the typical outcomes of GBM (3).
Studying GBM using the established cell culture methods in a controlled environment allows scientists to disclose the effect of conditioned medium (CM) on tumor biology (4).
2. Objectives
This study aimed to investigate the CM’s effect of GBM cell lines on each other. The molecular basis of the observed cellular impact of CMs was interrogated with qRT-PCR using a panel of genes with cell-cycle regulatory (CDKN1A and CDKN1B), growth-inhibitory (GADD45A), tumor-suppressor (p53 and BRCA1), and pro-apoptotic (BAX and PUMA) roles (5). According to our findings, it was hoped that this study would be beneficial for a more detailed exploration of the secretome content of GBM cells.
3. Methods
3.1. Cell Culture Maintenance
LN229 (ATCC:CRL-2611TM) and U87 (ATCC:HTB-14) glioblastoma cell lines were used in this study. U87 cell line were cultured in 10% heat-inactivated fetal bovine serum (FBS; Gibco) and 1% penicillin/streptomycin (Gibco) in high-glucose DMEM (Sigma, #D6429). The LN229 cell line was cultured in DMEM supplemented with 5% FBS and 1% penicillin/streptomycin. All cell lines were maintained in a humidified chamber with 5% CO2 at 37°C, culture mediums were replaced every other day, and cells were passaged at around 80% confluency. For the following steps, all cell lines were harvested with 0.25% Trypsin-EDTA (Gibco, #25200056) and counted with a thoma cell counting chamber (ISOLAB, #I.075.03.002.001) using 0.4% Trypan blue solution (Gibco, #15250661). All assays were performed in three replicates for each time point and control.
3.2. Harvesting Conditioned Mediums
To collect the CMs, 0.3 × 10⁶ cells/well were seeded to a 6-well plate (ThermoFisher Scientific) in a 2 mL culture medium and incubated for 24 hours. The culture medium was replaced after 24 hours of incubation, and CMs were collected 6, 12, and 24 hours after medium replacement. For the 48th h CM, cells were seeded at 0.2 × 10⁶ confluency, incubated for 24 hours, the culture medium was replaced, and conditioned mediums were collected 48 hours after medium replacement. Conditioned mediums were filtered using a 0.22 μm filter (ISOLAB, #094.07.001) and stored at 4°C until the following experiments.
3.3. MTT Assay
To determine the toxicity of CMs on each other, MTT assay was performed using CellTiter 96® Non-Radioactive Cell Proliferation Assay kit (Promega, #G4000) according to the manufacturer’s protocol. The 0.1 × 10⁵ cells were seeded to a 96-well plate (ThermoFisher Scientific) in a 100 μL medium. Cells were incubated for 24 hours for the attachment of cells, and following the 24 hours of incubation, the culture medium was replaced. Each cell line was treated with other cells’ CMs collected at different time points. As a negative control, DMEM, and as a positive control, 10% DMSO was used.
3.4. Colony Formation Assay (CFA)
As for CFA, cells were cultured in a 96-well plate with 2 × 10³ seeding density in a 100 μL medium and incubated for 24 hours. Afterward, the culture medium was replaced with the CMs or DMEM, and cells were incubated until the control group reached an 80% confluency. Throughout the experiment, CM or DMEM was replaced every other day. The same experimental setup was followed for the cells in the negative control group treated with 10% DMSO. The impact of CMs on colony-forming ability was examined by following a previously described protocol (6). The formed colonies were photographed under the microscope and then counted with the ImageJ 1.52v image analysis software (htpp://imagej.nih.gov/ij) “ColonyCounter” plugin.
3.5. Wound Healing Assay (WHA)
CMs collected at 48th h from LN229, and U87 cell lines were used to compare the effects of CM on the migration capacity of cells. LN229 and U87 cell lines were seeded with 0.5 × 10⁵ cells/well confluency to a 24-well plate (ThermoFisher Scientific) in a 1 mL culture medium and incubated for 24 hours. After incubation, culture mediums were replaced with 500 μL CMs or DMEM. After 24 hours, a gap was created by straight scratch using 200 μL pipette tips. Then, the cell medium was replaced to get rid of dead and de-attached cells, and finally, 0th, 6th, and 24th-hour images of cells were taken. ImageJ’s “MRI Wound Healing Tool” plugin was employed to analyze and quantify the closure rates of the created wounds.
3.6. Flow Cytometry Assay
The proliferation rate was evaluated using the Click-ITTM EdU cell proliferation kit (ThermoFisher Scientific, #C10425). Briefly, cells were seeded with 2 × 10⁵ density in a 1 mL medium in 12-well plates (ThermoFisher Scientific). After 24-hour incubation, the culture medium was replaced with a 600 μL CM or DMEM, and cells were incubated for an additional 24 hours. For the next steps, the manufacturer’s protocol was followed. Flow cytometry analyses were performed with Navios EX (Beckman Coulter) instrument.
3.7. Gene Expression Profiling
U87 and LN229 cells (3 × 10⁵) were seeded in a 6-well plate in a 2 mL medium and incubated for 24 h. Then, the culture mediums were replaced with a 1 mL CM or DMEM. Upon an additional 24-hour incubation in CM or DMEM, cells were harvested. TRIzol reagent (ThermoFisher Scientific, #15596026) was used to isolate total RNA according to the manufacturer’s instructions. The quality of isolated RNAs was checked on a 1% agarose gel, and RNAs were quantified with Qubit4 Fluorometer (Invitrogen, Thermofisher Scientific). The cDNA synthesis was carried out with M-MuLV Reverse Transcriptase (NEB, #M0253L), and qPCR reactions were conducted using gene-specific primers (Table 1) with SensiFAST SYBR No-ROX kit (Bioline, #BIO-98005) as described previously (7). The GAPDH gene was used as the housekeeping gene for normalization.
| Primer Name | Sequence Information |
|---|---|
| BAX forward | 5’-CAAACTGGTGCTCAAGGCCC |
| BAX reverse | 5’-GGGCGTCCCAAAGTAGGAGA |
| PUMA forward | GACCTCAACGCACAGTACGAG |
| PUMA reverse | AGGAGTCCCATGATGAGATTGT |
| CDKN1A forward | 5’-TACCCTTGTGCCTCGCTCAG |
| CDKN1A reverse | 5’-GGCGGATTAGGGCTTCCTCT |
| CDKN1B forward | 5’-AGACTGATCCGTCGGACAGC |
| CDKN1B reverse | 5’-CACAGAACCGGCATTTGGG |
| GADD45A forward | 5’-GATGCCCTGGAGGAAGTGCT |
| GADD45A reverse | 5’-GATGCCCTGGAGGAAGTGCT |
| TP53 forward | 5’-GCGTGTTTGTGCCTGTCCTG |
| TP53 reverse | 5’-TGGTTTCTTCTTTGGCTGGG |
| ATM forward | 5’-GGTATAGAAAAGCACCAGTCCAGTATTG |
| ATM reverse | 5’-GGTATAGAAAAGCACCAGTCCAGTATTG |
| BRCA1 forward | 5’-GCATGCTGAAACTTCTCAACCA |
| BRCA1 reverse | 5’-GTGTCAAGCTGAAAAGCACAAATGA |
| GAPDH forward | 5’-GCAAATTCCATGGCACCGT |
| GAPDH reverse | 5’-TCGCCCCACTTGATTTTGG |
3.8. Statistical Analysis
Statistical analyses and graphing were performed in GraphPad Prism 5.0 software (GraphPad Software, Inc.) and R language (4.3.2). The normality of data distribution was tested performing the Shapiro-Wilk test. One-way analysis of variance (ANOVA) followed by Tukey’s post hoc test was employed for the normally distributed data, and the Kruskal-Wallis test followed by Dunn’s post hoc test was employed as a non-parametric test for non-normal distributed data in MTT and CFA results. Pairwise comparisons in wound healing were analyzed using Wilcoxon or t-tests based on the normality of the data. Statistical significance was set at a P-value < 0.05.
4. Results
4.1. LN229 and U87 CMs Collected at 48th h Displayed Growth-Limiting Activity on GBM Cells
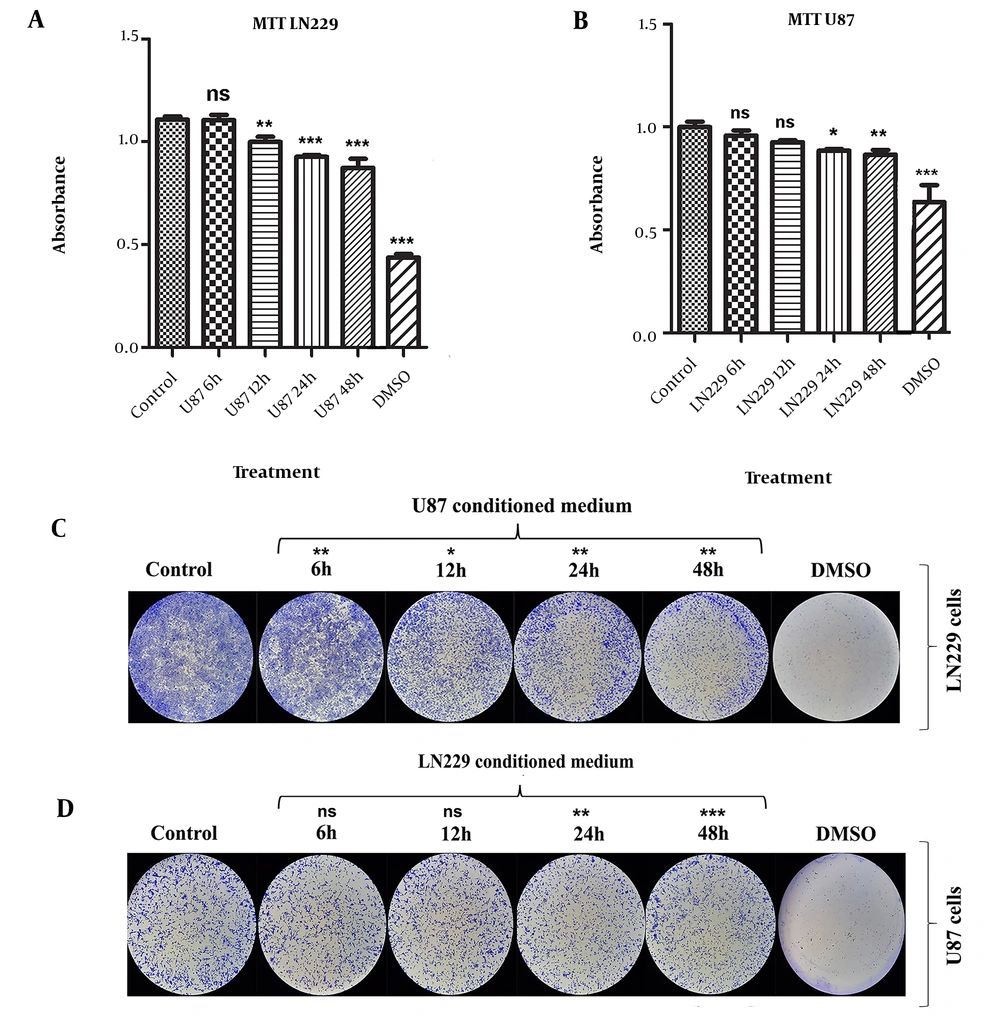
In LN229 cells, the viability of cells was significantly decreased when cells were treated with CMs derived from U87 at 12th (10%), 24th (16%), and 48th (21%) h time points (P-value < 0.01 for CM harvested from U87 at 12th h and P-value < 0.001 for the rest) (Figure 1A). The effect of 6th h U87 CM was nonsignificant (Figure 1A). CMs collected from U87 at all time points (6th, 12th, 24th, 48th h) significantly reduced the formed LN229 colonies (P-value < 0.05 for the 12th h treatment group; P-value < 0.01 for other treatment groups) (Figure 1C).
According to the results from MTT and CFA, CMs derived from LN229 cells at 6thand 12th h did not significantly change the viability or colony formation potential of U87 cells (Figure 1B - D). However, harvested CMs at 24th and 48th h significantly reduced the viability of U87 cells by 11% and 13%, respectively (P-value < 0.05 for 24th h and P-value < 0.01 for 48th h treatment groups) (Figure 1B). CFA results for 24th and 48th h CMs of LN229 cells confirmed the MTT results by significantly decreasing the colony-forming capacity of U87 cells (P-value < 0.01 for 24th h and P-value < 0.001 for 48th h treatment groups) (Figure 1D).
The subsequent experiments were performed using 48th h CMs after considering our results from MTT and CFA, which highlighted that LN229 and U87 48th h CMs had a significant growth-limiting effect on each other. Hereafter, “LN229-CM” and “U87-CM” will be used to refer to CM harvested at 48th h from LN229 cells and U87 cells, respectively.
4.2. LN229-CM Significantly Decreased the U87 Cell Migration
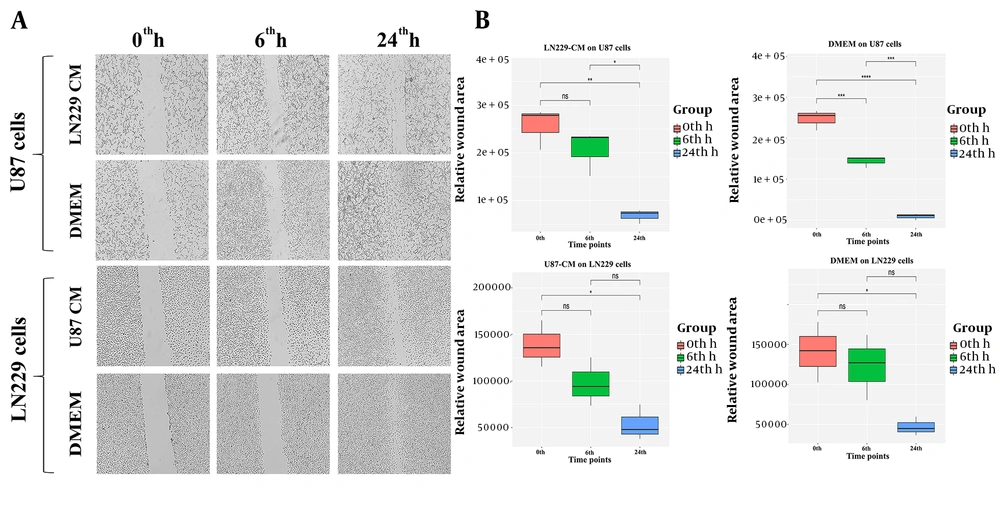
Wound healing assay was conducted to evaluate the effect of CMs on the migration capacity. First, a statistical analysis was performed within each group. The wound area was almost completely closed 24-h post scratch for control U87 cells (P-value < 0.001) (Figure 2A - B). The size of the scratch at the 6th h time point was significantly reduced for control U87 cells compared to the 0th-h scratch size (P-value < 0.001) (Figure 2B). The decreasing trend in wound size was extended to 24th-h compared to the 6th-h time point in control U87 cells (P-value < 0.001) (Figure 2B). Interestingly, there was no significant difference in scratch size between 0th-h and 6th-h for LN229-CM treated U87 cells (Figure 2B). On the other hand, the closure rate between 24th-h compared to 0th-h and 6th-h time points was found to be significant (P-value < 0.01 and P-value < 0.05, respectively) (Figure 2B).
As for the control and U87-CM treated LN229 cells, the 6th-h wound closure rate was nonsignificant. Control LN229 cells significantly closed the wound at the 24th h time point in comparison to the 0th h time point (P-value < 0.05) (Figure 2B). The wound area between the 6th h and 24th h time points was also compared, and the change in wound size between these time points was found nonsignificant for control LN229 cells (Figure 2B). Wound size at 24th h time point for U87-CM treated LN229 cells was significantly decreased compared to the 0th h time point (P-value < 0.05) (Figure 2B). For the same treatment, the comparison of scratch size between 24th h and 6th h time points was nonsignificant.
Next, we compared the healing success between treated and control groups for the same cell line. There was a significant difference in wound healing rate for both 6th h and 24th h time points between LN229-CM treated and non-treated U87 cells (P-value < 0.05). For LN229 cells, there was no significant difference between the CM treatment and control groups.
4.3. U87-CM Exhibited an Anti-proliferative Effect on LN229 Cells
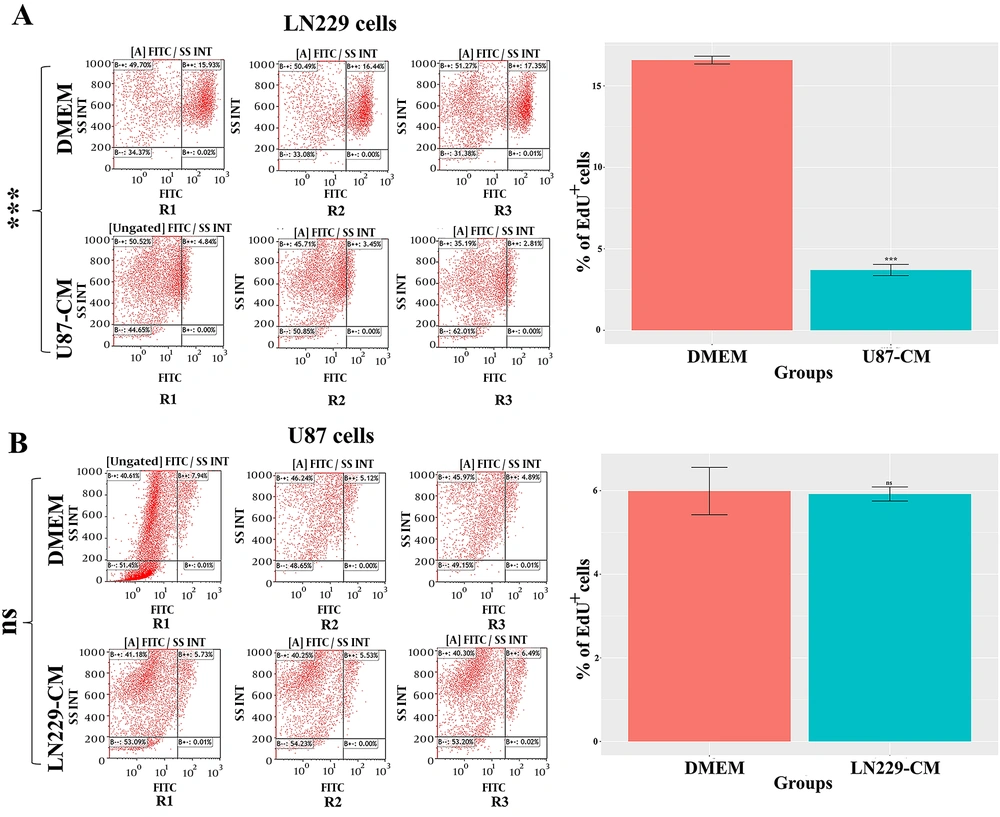
From the MTT and CFA results, it was speculated that the growth-limiting effect of LN229-CM and U87-CM might have been attributed to an altered proliferation rate. To further interrogate the anti- or pro-proliferative impact of CMs, the EdU based proliferation assay was carried out. For U87-CM treated LN229 cells, a significant decrease in proliferation rate was observed compared to non-treated LN229 cells (P-value < 0.001) (Figure 3A). However, LN229-CM treatment did not significantly affect the proliferation rate of U87 cells (Figure 3B).
4.4. Levels of Anti-proliferative Genes in U87 and LN229 Cells Were Altered Following the CM Treatment
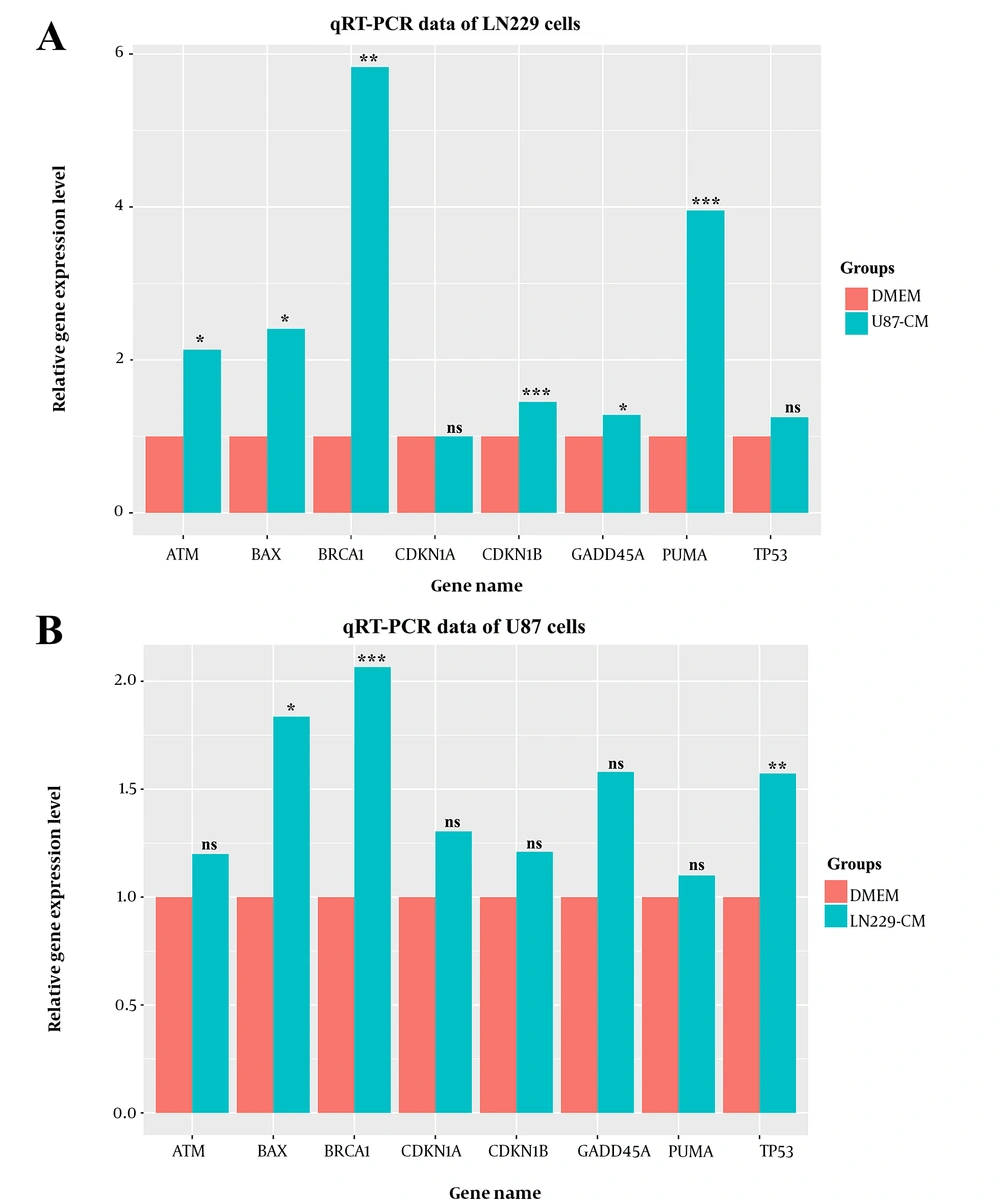
The qRT-PCR was performed to reveal the impact of CMs on gene expression levels. Housekeeping genes were used to normalize the expression levels, and relative expression levels were depicted in Figure 4.
Among the anti-proliferative genes, BAX and BRCA1 genes were significantly upregulated in the CM treatment groups, whereas the difference was nonsignificant for the CDKN1A gene (Figure 4A - B). While GADD45A, CDKN1B, ATM, and PUMA gene expression levels were significantly upregulated in U87-CM treated LN229 cells, change in expression levels was nonsignificant in U87 cells (Figure 4A - B). The TP53 level was higher in LN229-CM treated U87 cells, and its level was not significantly altered in U87-CM treated LN229 cells (Figure 4A - B).
5. Discussion
CM has been extensively used in in-vitro studies to mimic the microenvironment of cellular niche and, therefore, dissect the role of secretome on molecular processes (4). It has been documented that CM derived from various cell types has substantial and multiple effects on target cells’ proliferation (8), motility (9), epithelial-mesenchymal transition (10), gene expression (11), cell viability (12), and death (13). This study, therefore, aimed to investigate the effect of CMs derived from cell lines on each other.
Our study results obtained from MTT and CFA unveiled that GBM CMs have considerably anti-growth effects on each other, particularly for the CMs collected at the 48th h time point. To explore the protein composition of 24th h CMs harvested from GBM cells (HNGC2, U87, and LN229), a proteome analysis was conducted, and proliferation-related proteins such as TIMP1, SERPIN F1, and mTOR were identified commonly as part of secretome content (13). Intriguingly, CMs of GBM cell lines (U87, U373, and U251) collected after 24 h significantly decreased the proliferation rate of the cells following the reciprocal CM treatment (14). Therefore, the content of the secretome may have an inhibitory effect on the cell division rate of target cells. Based on the literature, to the best of our knowledge, 48th h CM of GBM cells has not been studied extensively before. It is plausible to suggest that 48th h CM of GBM cells could contain anti-proliferative signals, which should be addressed in future studies.
To further evaluate the growth-limiting effect of CMs of GBM cells on each other, the cell division rate was determined by EdU labelling. Cell proliferation results confirmed that U87-CM contained anti-proliferative factors for LN229 cells (Figure 3A). In contrast, LN229-CM had no significant effect on the proliferation rate of U87 cells (Figure 3B). As shown in a previous study, CMs harvested from GBM cells exhibited potential inhibitory effects on each other (14). The given study found that the CM of U251 and U373 cells decreased the proliferation rate of U87. Interestingly, the CM of U87 cells did not significantly affect the proliferation rate of U251 or U373 cells. As mentioned earlier, the results from other studies regarding the diverse impact of GBM CMs on each other were in line with our findings.
A significant anti-migratory effect of LN229-CM on U87 cells was observed (Figure 2A - B); however, U87-CM did not significantly affect the LN229 migration ability. In a recent study, CM collected from the B16F10 mouse melanoma cancer cells reduced macrophage motility (15). On the other hand, there are some contrary reports on the migratory effect of CM. It has been reported that CMs derived from malignant breast cancer cell lines MDA-MB-231 and MDA-MB-453 increase the migration capacity of non-tumorigenic MCF10A cells (16). The ambiguous effect of CM on the migration capacity might be attributed to the CM origin and target cells. More studies are required to unveil the content of LN229 and U87 CMs as well as to extend our current understanding of the contribution of CMs to cell migration capacity.
To get more insights into the anti-proliferative activity of CMs, the expression level of several anti-proliferative genes was evaluated in our study. Upon CM treatment, most of the anti-proliferative genes’ (GADD45A, CDKN1B, BAX, ATM, BRCA1, and PUMA) expression level was significantly upregulated in CM-treated LN229 cells compared to the control group. Increased anti-proliferative activity of genes in U87-CM treated LN229 cells provided plausible explanations for the decreased viability (Figure 1) and proliferation rate (Figure 3A). The diminished proliferation rate following CM treatment may have been associated with the inhibition of cell cycle progression by the increased GADD45A and CDKN1B levels. Moreover, upregulated pro-apoptotic factors may have accounted for the increased rate of cell death, which may have further decreased the number of alive cells following the CM treatment.
In contrast, a similar expression level for most anti-proliferative genes was detected in CM-treated and non-treated U87 cells. Moreover, no significant differences were observed in GADD45A, CDKN1A, CDKN1B, ATM, and PUMA levels. BAX, BRCA1, and TP53 were significantly upregulated in CM-treated cells which may have highlighted the anti-proliferative content of harvested CM. Altogether, activation of anti-proliferative gene expression upon CM treatment indicated a negative regulatory function of CMs on viability. Decreased viability upon CM treatment might have been associated with an elevated apoptosis and cell cycle arrest rate.
Several factors limited this study and its conclusions. Gene expression profile upon CM treatment may have been investigated using high throughput sequencing technologies which would allow the comprehensive elucidation of altered pathways. Moreover, cell lines at different glioma stages were likely more informative in revealing the CM effect on cancer development and aggressiveness.
5.1. Conclusions
In this study, CMs of GBM cell lines were used on each other to investigate the CMs’ effect at the cellular and molecular levels. It was demonstrated that GBM CMs collected at 48th h decreased the viability and modulated the gene expression of each other. Furthermore, the migration capacity of CM-treated U87 cells was remarkably reduced. Activation of anti-proliferative gene expression programs underlined the necessity of further studies to dissect the molecular content of the secretome.
