1. Background
Sulfonamides are among the synthetic antibiotics. They have been extensively used to treat bacterial infections for both humans and animals without affecting other cells (1). Sulfacetamide and sulfadiazine belong to the above-mentioned group of antibiotics. They work by stopping the growth of microorganisms such as bacteria (2). Sulfacetamide can affect Streptococci, Staphylococci, E. coli, Klebsiella pneumoniae, Pseudomonas pyocyanea, Salmonella species, Proteus vulgaris, and Nocardia and Antinomies. These antibiotics are being used increasingly worldwide. These compounds enter the environment through different sources; namely, pharmaceutical industries, agricultural activities, etc. Low level of antibiotics promotes the growth of bacteria (3) and produces antibiotic resistance bacteria gens. As a result, remediation and quantitation of these compounds is necessary, and a great number of methods have been introduced in this regard (4-8). Chromatographic techniques have been extensively used to determine sulfonamides mixture in wastes and during the remediation process. The accuracy and precision of the obtained chromatographic data is important to obtain accurate results. Researchers usually use calibration curve to quantify the chemical compounds. They usually rely on the good correlation between calibration data. Some researchers use individually injected calibration curve to calculate 2 or more analyte in the mixture. In our research, we realized that figure of merits such as linear range, accuracy and precision in determining a compound in the mixture of their analogues are greatly affected by number of components present.
2. Objectives
However, the present study aimed at investigating the synergic effect of sulfacetamide and sulfadiazine in their HPLC determination in aqueous media. Finally, it was found that how accuracy of the results are affected by calibration curves of the mixture of both sulfonamide standards.
3. Methods
Sulfadiazine and sulfacetamide were obtained from Sigma (USA). All other required reagents and HPLC grade solvents were prepared from Merck (Germany).
Stock solution of 1000 µg mL-1 sulfadiazine and sulfacetamide in MeOH was prepared. These solutions were kept at -25°C away from light for 2 months without any changes in their potency. Intermediate solutions of 100 µg mL-1 were prepared on adding 1 mL of their corresponding stock solutions in a 10 mL volumetric flask and diluted to the mark with doubly distilled water. These solutions were stable for about 2 weeks. Working solutions were prepared daily by stepwise dilution of intermediate solutions.
Mixture of sulfacetamide and sulfadiazine in the range of 0.1 - 40 µg mL-1 was prepared by adding appropriate amount of intermediate solutions of each sulfonamide and then diluted to the mark with distilled water.
3.1. High Performance Liquid Chromatography (HPLC) Procedure
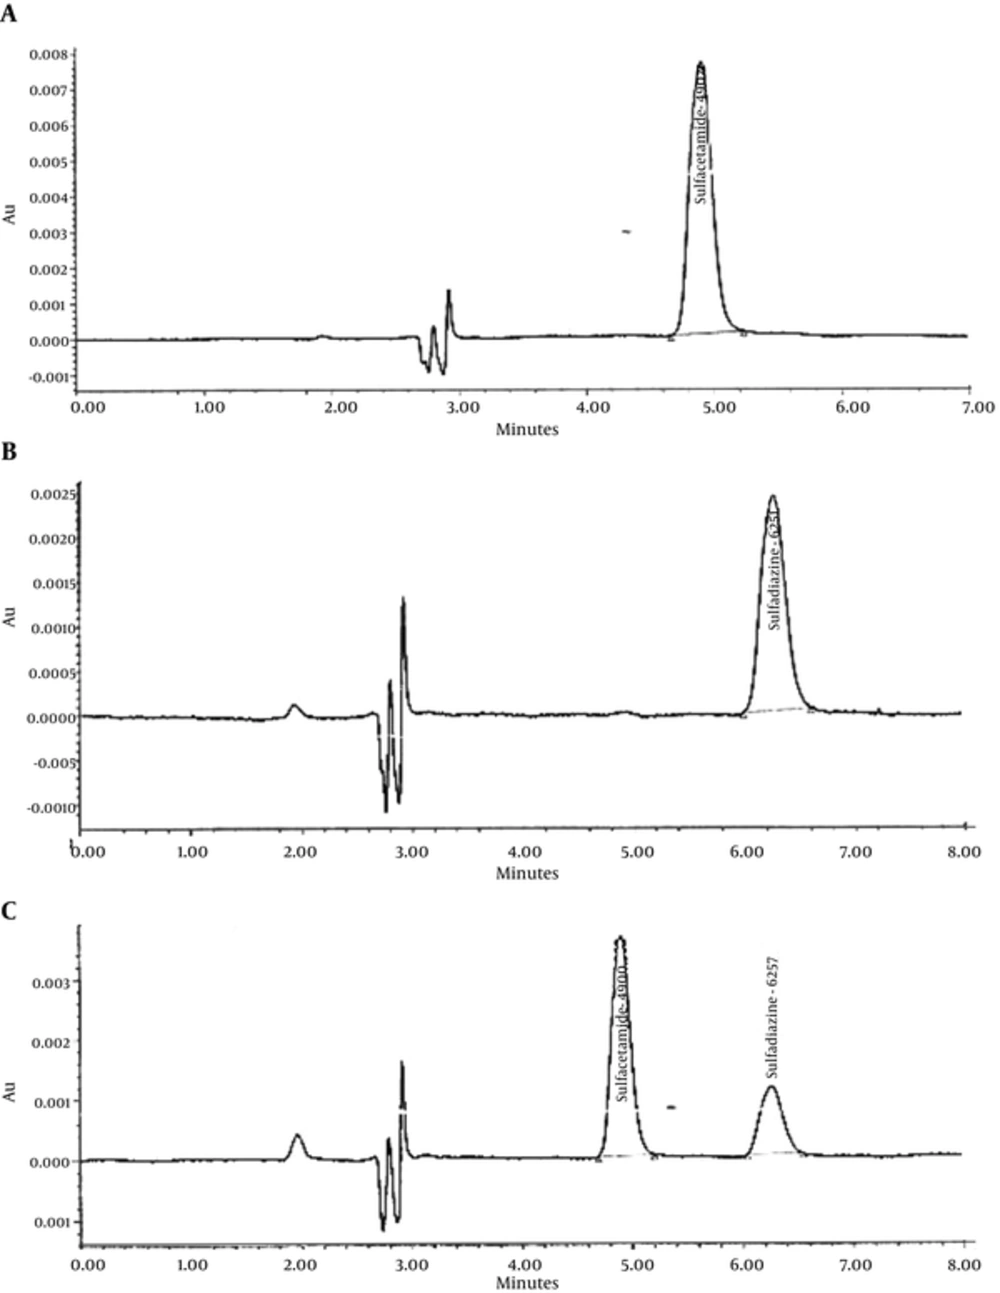
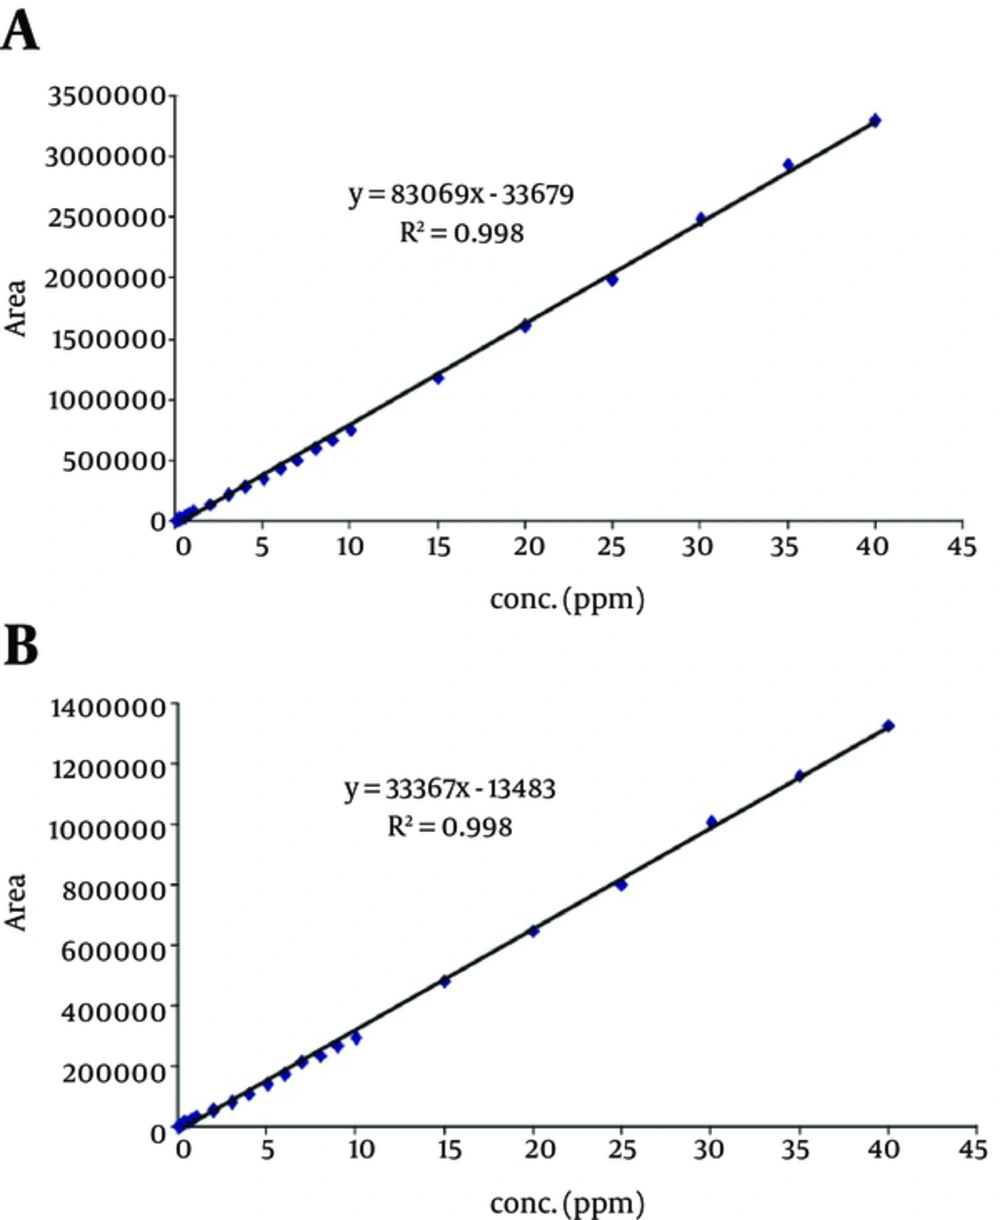
A Water 600 HPLC system (USA) equipped with PDA detector and in line degasser was used. The mobile phase consists of H2O: MeOH (75: 25) adjusted to pH 3.25 using 20% formic acid. Twenty microliter of standards and samples were consequently injected on ODS2 C18 (250 × 4.6 mm, 5 µm) column. The column temperature was set at 35°C. Mobile phase was passed through the column at the rate of 1 mL min-1. Chromatograms were recorded at 270 nm. A typical chromatograms of separately injected and mixture of sulfacetamide and sulfadiazine are illustrated in Figure 1. Retention times are identified on the figures. Calibration curves, presented in Figure 2, were linear in the range of 0.1 - 40 µg mL-1 for sulfacetamide and sulfadiazine before mixing.
HPLC chromatograms of a, sulfacetamide; b, sulfadiazine, and c, mixture of sulfacetamide and sulfadiazine; conditions: ODS2 C18 (250 × 4.6 mm, 5µm) at 35°C, mobile phase: H2O: MeOH (78:22) adjusted to pH3.25 using formic acid with flow rate of 1 mg min-1, λ = 270 nm, injection volume: 25 µL.
4. Results and Discussion
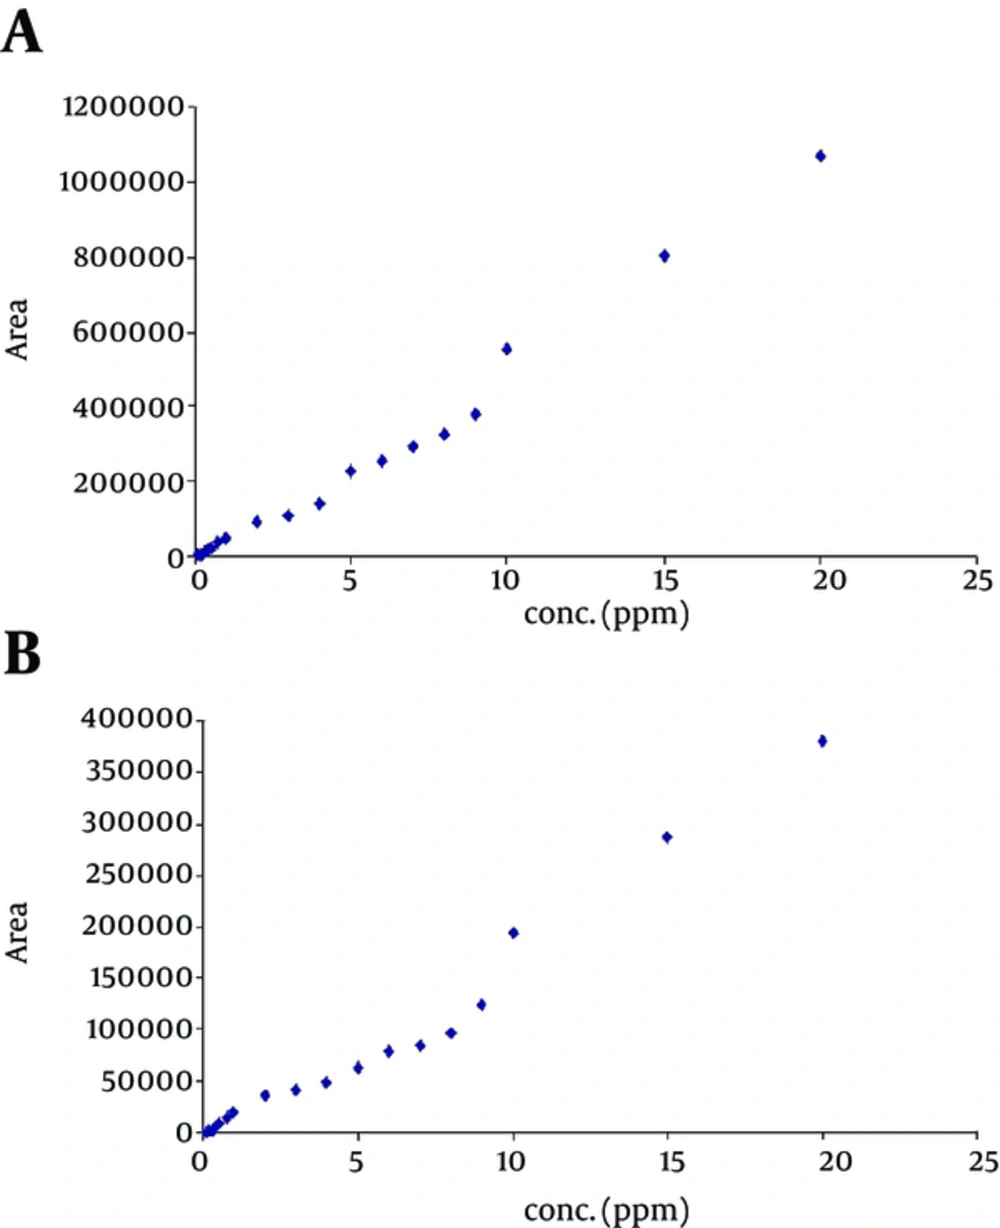
To ensure the reliability of data obtained for HPLC determination of sulfacetamide and sulfadiazine in mixtures, calibration curve for separately injected standards were compared with those of the above- mentioned sulfonamides mixture. Calibration curves for separately injected solution of each sulfonamide (Figure 2) showed good linearity over the concentration range of 0.1 to 40 µg mL-1. Then, working standards of mixed sulfonamides in the range of 0.1 - 20 µg mL-1 were injected to HPLC, and calibration curves were extracted from chromatogram of the mixtures. The calibration curves showed 3 different calibration regions (0.1 - 2, 3 - 9, 10 - 20 µg mL-1, Figure 3). This phenomenon can be related to the interactive effect of the compounds in the mixture. Table 1 summarizes the calibration ranges and equations as well as their corresponding correlation coefficients for sulfacetamide and sulfadiazine in their mixture. The correlation coefficient for the overall range was 0.984 and 0.964 for sulfacetamide and sulfadiazine, respectively. The correlation coefficients confirm acceptable linearity, but the accuracy and precision of the data were problematic. Table 2 identifies the precision of the measurements for the 2 mentioned antibiotics in mixtures using exact calibration curve, meaning that each concentration, depending on its concentration, was determined through one of the 3 calibration curves reported in Table 1. The recoveries in the range of 96 to 108 and CVs between 0.03 and 0.87 indicated good reproducibility and accuracy. Table 3 compares the recoveries obtained for synthetic samples with 0.5, 1 and 5 µg mL-1 of both sulfonamides by the overall calibration range (0.1 - 20 µg mL-1, in mixture) and its 3 derived calibration curves (the 3 last rows of Table 1). As illustrated in the table, if exact calibration curve is selected, the obtained data would be reliable. For concentrations higher than 5 µg mL-1, only slight variation in accuracy was obtained whether we used overall or segmented calibration curve in our calculations. Overall calibration curve could not be used for lower concentrations. Thus, more precaution is needed while analyzing mixture of antibiotics or any other chemicals.
HPLC calibration curve for a, sulfacetamide, and b, sulfadiazine extracted from chromatogram of a mixture of these sulfonamide. Conditions: ODS2 C18 (250 × 4.6mm, 5 µm) at 35°C, mobile phase: H2O: MeOH (78: 22) adjusted to pH 3.25 using formic acid with flow rate of 1 mg min-1, λ=270 nm, injection volume: 25 µL.
| Sulfadiazine | Sulfacetamide | Linear Range | ||
|---|---|---|---|---|
| R2 | Cal. Eq. | R2 | Cal. Eq. | mg mL-1 |
| 0.964 | Area = 184498C - 12153 | 0.984 | Area = 50762C- 19341 | 0.1 - 20 |
| 0.989 | Area = 19545 C - 1616.9 | 0.996 | Area = 48522C - 1760.5 | 0.1 - 2 |
| 0.965 | Area = 12977 C - 1199.0 | 0.982 | Area = 44475 C - 18796 | 3 - 9 |
| 1 | Area = 18747 C + 5562.7 | 0.999 | Area = 51655 C +34777 | 10 - 20 |
Calibration Ranges and Equations for for Sulfacetamide and Sulfadiazine When Mixture of These Sulfonamides is Injected to HPLC
| Con. | Sulfacetamide | Sulfadiazine | ||
|---|---|---|---|---|
| mg mL-1 | CV Within days | CV Between Days | CV Within days | CV Between Days |
| 0.5 | 0.23 | 0.50 | 0.85 | 0.17 |
| 1 | 0.87 | 0.18 | 0.15 | 0.45 |
| 5 | 0.03 | 0.59 | 0.07 | 0.59 |
Precision of the Present HPLC Results for the Mixture of Sulfadiazine and Sulfacetamide
| Sulfacetamide | Sulfadiazine | |||||||
|---|---|---|---|---|---|---|---|---|
| Actual Con.µg ml-1 | Calculateda µg ml-1 | R (%) | Calculated µg ml-1 | R (%) | Calculateda µg ml-1 | R (%) | Calculated µg ml-1 | %R |
| 0.5 | 0.805 | 161.1 | 0.480b | 96.0 | 1.144 | 228.2 | 0.541b | 108.2 |
| 1 | 1.307 | 130.7 | 1.005b | 100.5 | 1.668 | 166.8 | 1.03b | 103.0 |
| 5 | 4.815 | 96.3 | 5.483c | 109.7 | 4.058 | 81.16 | 4.93c | 98.5 |
| 15 | 16.198 | 107.99 | 15.383d | 102.6 | 16.218 | 108.12 | 15.017d | 100.1 |
Comparison of the Accuracy of the Results Obtained by Mixture Calibration Curve Over 0.1 - 20 µg mL-1 and Its Three Derived Calibration Curve
5. Conclusions
The extent of the synergic effect of analytes in every determination method should be evaluated. To do so, the figure of merit of method for each analyte (accuracy, precision, sensitivity) in the chromatographic determination of mixtures should be examined and compared with those obtained from individually injected samples. Based on the results of this study, acceptable correlations (0.9 - 0.98) may result in inaccurate data. However, never trust the correlation coefficient of calibrations curves. The matrix may even makes the situation worse, while analyzing real samples. In such cases, matrix match calibration is required.


