1. Background
Only 2% of the human genome comprises protein-coding transcripts, whereas most of the genome produces noncoding RNAs (ncRNAs). Long ncRNAs (lncRNAs) are ncRNAs with a length of more than 200 nucleotides (1). Overall, lncRNAs are involved in chromatin remodeling, gene expression control, cell differentiation, metabolism, and immunological response (2-4). The lncRNA can also operate as a molecular attract or decoy and sequester regulatory molecules, such as proteins and microRNA, from their target genes (5). Long noncoding RNAs play an essential role in cancer expansion and can function as tumor suppressors or promoters. In addition, the abnormal expression of many lncRNAs has been observed in cancers (6). Despite various descriptions of the functional roles of lncRNAs, many of their mechanisms of action have yet to be discovered. However, their vital role in cells has been proven, and lncRNAs can be used as diagnostic and prognostic biomarkers, as well as novel therapeutic targets for cancer treatment.
Breast cancer (BC) is the most commonly diagnosed cancer in women and the fifth leading cause of cancer-related death in 2020 (7). Perception of the biology of this virulent disease is one of the primary conditions for choosing the proper treatment. Noncoding RNAs play an important role in regulating the expression of specific genes and are involved in the main biological processes of BC. For example, the expression of lncRNA BORG is associated with metastasis and recurrence in BC. Therefore, its inhibition can significantly reduce carcinogenicity (8). On the other hand, studies have shown that lncRNA HOTAIR can increase the activity of hormone receptors, such as estrogen, and cause resistance to Tamoxifen (9). Furthermore, the expression of several lncRNAs, such as AFAP1-AS1 and GACAT3, can predict the prognosis of BC patients and be associated with a faint prognosis (10, 11). Finally, many studies have shown that the expression of lncRNAs can control cell division, apoptosis, migration, and invasion of BC cells (12). Therefore, it can be concluded that the role of lncRNAs in BC can be very significant and is essential in various aspects, including carcinogenic mechanisms, diagnosis, prognosis, and drug sensitivity.
The role of lncRNAs in the pathogenesis of many cancers, particularly BC, has been established, but the function of many of them in BC remains unknown.
2. Objectives
This study aimed to identify the lncRNA most associated with the poor prognosis of BC patients and suggest medications related to its expression. For this purpose, the cancer genome atlas (TCGA) data were used to examine the expression and association of lncRNAs with prognosis in BC. Next, the lncRNA that had the most significant impact on patient survival was selected, and its association with drug sensitivity was assessed using PharmacoGX data. Finally, using GEO data, medicines affecting the expression of candidate lncRNA were identified. Moreover, the effect of drug treatment on its expression was evaluated in vitro.
3. Methods
3.1. TCGA Data Analysis and Prognosis
TCGA data were used to identify the lncRNA that could have the most significant effect on the survival of BC patients. For this purpose, first, using the TCGAbiolinks package, the transcriptome data (RNAseq) of BC were downloaded in raw format (HTseq-Counts), the information of which is summarized in Table 1 (13). Next, using the edgeR package, genes with zero or near zero expression were removed from the expression matrix, and data normalization was performed by the TMM method. The counts per million (CPM) criterion was used to remove genes, and genes with a CPM of less than 10% in more than 50% of the samples were removed from the expression matrix (14). After data normalization, all data were transferred logarithmically based on 2, and the resulting expression matrix was used for all analyses. In order to investigate the relationship of the expression of all lncRNAs with the prognosis of patients, clinical data from TCGA and expression matrix in scaled mode (Z-score) were used. Clinical data for each cancer were sorted based on the latest follow-up. Initially, patients with a survival of 1 day or less, NA, and lost follow-up data were excluded from the study. For consideration of patients whose cause of death was cancer, only those who were with tumors at the time of death were considered.
| Characteristics | Number |
|---|---|
| Normal sample | 113 |
| Tumor sample | 1109 |
| ER+/PR+ | 317 |
| TP | 98 |
| TN | 116 |
3.2. Common Mutations and Network Co-Expression
The DNAseq data available in the TCGA database was used to correlate the expression of MIR 4435-2HG with common mutations in BC. First, mutation data (MAF file) processed by the Mutect2 pipeline were downloaded using the TCGAbiolinks package (15). Afterward, the samples were divided using the downloaded MAF based on the obtained mutations. The co-expression network was used to investigate the pathway in which MIR4435-2HG could play a role. For this aim, the correlation of the expression level of MIR4435-2HG and all genes in the expression matrix was assessed. Finally, genes with a correlation coefficient greater than 0.5 and P < 0.01 with MIR4435-2HG were selected.
3.3. Databases
Using the HGNC database (https://www.genenames.org), the list of all lncRNAs information was extracted. To enrich the data obtained from the co-expression network, the Enrichr database (https://maayanlab.cloud/Enrichr/) and MsigDB repository were used. GRAY pharmacoset from PhamacoGx was used to identify drug sensitivity associated with MIR4435-2HG expression (16). This pharmacoset contains the expression information of more than 50 BC cell lines and the IC50 value for more than 100 medications. The correlation of the expression level of MIR4435-2HG in each BC cell line and the IC50 level of each drug was tested to evaluate drug sensitivity. The GEO database was utilized to identify the appropriate drugs and molecules that can reduce the level of MIR 4435-2HG. Eligible study data (GSE27473) were downloaded in raw format, and initial preprocessing, including data normalization, background correction, and logarithmic data transfer based on 2, was performed by limma package (17).
3.4. Cell Culture and Treatment
The MDA-MB468 and MCF-7 cell lines were purchased from the Iranian Biological Resource Center. These cell lines were cultured in Dulbecco’s Modified Eagle Medium supplemented with 10% fetal bovine serum, 100 u/ml penicillin, and 100 µm g/ml streptomycin and were incubated at 37°C in a humidified incubator with 5% CO2. The culture was regularly examined using an inverted microscope. To examine the cell line dependence on the hormone, a serum strip was prepared as follows: the volumetric equivalents of the desired FCS, dextran suspension, and charcoal were added to a tube and centrifuged at 2500 rpm. Serum was added to the resulting precipitate, incubated at 37°C for one hour, and then centrifuged for 20 min. The serum was then filtered through a 0.2-micron filter and stored at -20°C. More than 99% of steroid hormones are eliminated with the mentioned method. Next, treatment with estradiol (Sigma, Cat.No:50282) was performed.
3.5. Microculture Tetrazolium Test
The microculture tetrazolium test (MTT assay, Sigma) was performed to determine cell viability after treating BC cell lines. Briefly, cells were plated into 96-well plates at a density of 4×10⁴ cells/well for 24 h. Then, the cells were treated with estradiol for 24, 48, and 72 h, and untreated cells were used as the control for each cell line. 100 μL of MTT (0.5 mg/mL) was added to each well, and cells were further incubated at 37ºC for 2 h. After dissolving the precipitated formazan with 100 μL of dimethyl sulfoxide, optical density was measured at 570 nm. The results were calculated regarding the percentage of treated living cells relative to the control.
3.6. RNA Extraction, Primer Design, and Quantitative Reverse Transcription PCR
RNA extraction was performed by TRIzol (Sigma) according to the manufacturer’s instructions, and DNase was treated to remove DNA contamination. The complementary DNA synthesis was performed using an Amplicon kit. The oligo7 software, along with the NCBI database (https://www.ncbi.nlm.nih.gov/tools/primer-blast/), was used to design the primer, and the specific primer sequence for MIR4435-2HG was F: 5’-CCACCAGCCTCTCCCTGACAA-3’ and R: 5’-GGCCGACTCTCCTACACATCC-3’. The SYBR Green (TaKaRa) method was used with specially designed primers to evaluate the level of MIR4435-2HG. The GAPDH expression level with primer sequence F: 5’-TGCCGCCTGGAGAAACC-3’ and R: 5’-TGAAGTCGCAGGAGACAACC-3’ was considered as internal control, and the expression level was calculated based on the 2-ΔΔCt method (18).
3.7. Statistical Analysis
All initial preprocessing on TCGA and GEO data was performed by R (V 4.0.2). All graphs were drawn using GraphPad Prism software (V 8.4). The Cox regression test was used to identify survival-related lncRNAs, and the log-rank test was used to assess significance. The linear model method was used to examine the difference in expression between the groups, and multiple hypothesis testing was used for significance. Pearson’s correlation test was used to identify genes that co-expressed with MIR4435-2HG, and Cytoscape (V 3.8.2) was used to draw the co-expression network.
4. Results
4.1. Increased Expression of MIR4435-2HG in BC and its High Association with Poor Prognosis
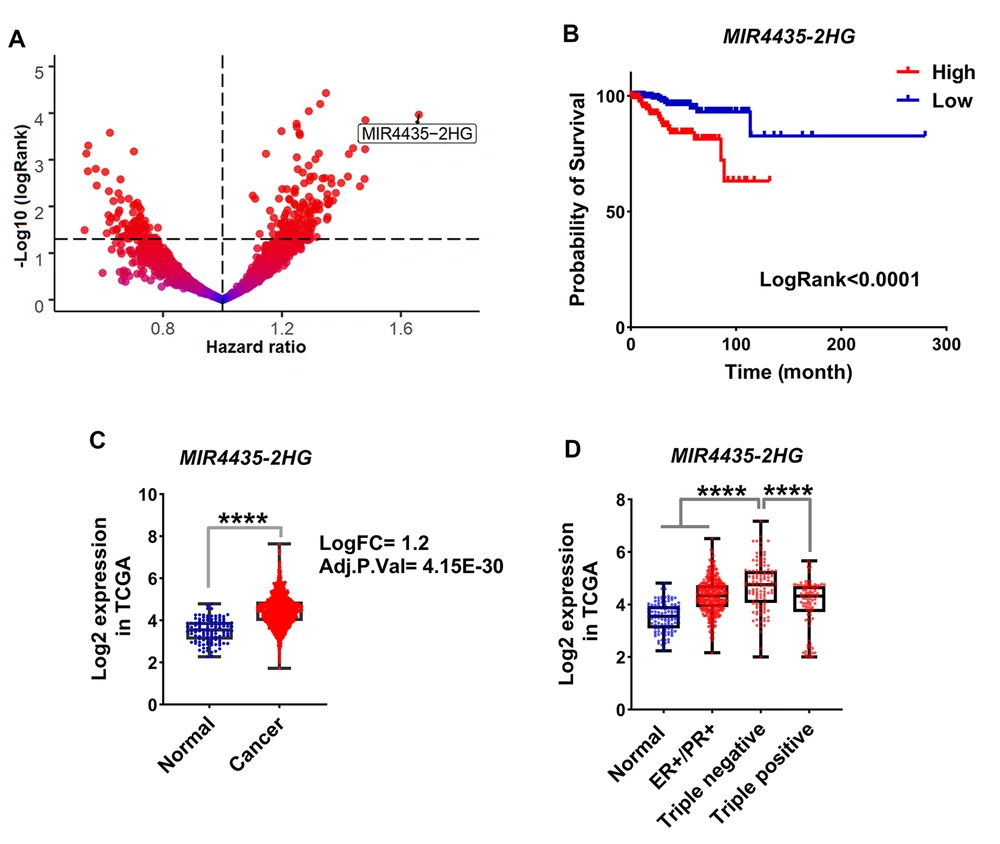
TCGA data was used to identify lncRNA, which is most associated with poor prognoses in BC patients. Initially, the expression of all lncRNAs present in the expression matrix was extracted using HGNC data. The expression level of the extracted lncRNAs was prepared as a Z-score. Using clinical information, the Cox regression test was applied to identify lncRNA level association with poor prognosis. The results showed that the level of MIR4435-2HG had the highest association with poor prognosis in BC (Figure 1A, HR > 1.6, log-rank < 0.0001). In addition, Kaplan-Meier results indicated that samples in which MIR4435-2HG expression is higher are associated with poor prognosis (Figure 1B, log-rank < 0.01). The expression level of this lncRNA in cancer samples increased more than twice that of the normal samples (Figure 1C, FDR < 0.001). In order to further investigate whether MIR4435-2HG level is dependent on the phenotype of BC, its expression level was evaluated in three main subtypes of BC, including estrogen- and progesterone-positive (ER+/PR+), triple-positive (ER+/PR+/HER2+), and triple-negative (ER-/PR-/HER2-). The results showed that the MIR4435-2HG level was significantly higher in triple-negative samples compared to other subgroups (Figure 1D, FDR < 0.0001). Our findings indicated that MIR4435-2HG could play an oncogenic role in BC, and its expression appears to be dependent on the function of estrogen and progesterone activity. In addition, the obtained data suggest that the expression of MIR4435-2HG can be used as a prognosis biomarker in BC.
MIR4435-2HG expression level increases in BC and is associated with poor prognosis in patients. A, Volcanic diagrams for all lncRNAs expressed in BC and their association with survival are shown. Cox regression results for TCGA data were used to plot the graph and hazard ratio (HR) and logRank were considered; B, The Kaplan-Meier plot is shown for association of MIR4435-2HG level with survival rate in BC specimens. The samples were divided into two categories including down and up expression based on the median expression level of MIR4435 2HG in all samples; C, MIR4435-2HG level in tumor samples compared to normal is shown based on TCGA data; D, MIR4435-2HG expression in BC samples is shown based on the status of estrogen, progesterone and HER2 receptors (P **** < 0.0001)
4.2. Association of MIR4435-2HG Expression with TP53 Mutation and Metastasis-Related Pathways
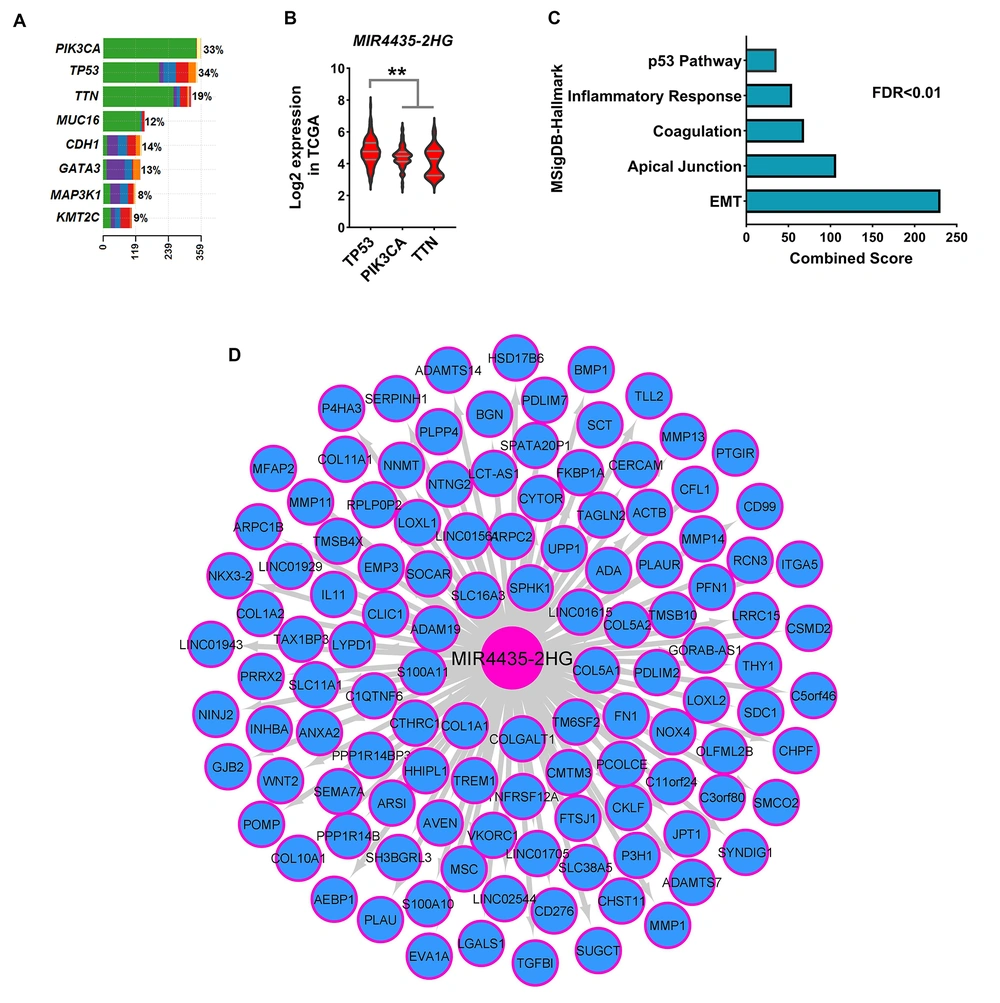
Changes in gene expression are highly dependent on mutations in genes. Therefore, common mutations in BC were identified using DNAseq data from the TCGA database, and the association of mutations with MIR4435-2HG level was assessed. The results showed that TP53, PIK3CA, and TTN genes had the highest mutation rates among BC samples (Figure 2A). Moreover, the expression level of MIR4435-2HG was higher in samples with TP53 mutation than other common mutations (Figure 2B, FDR < 0.01). A co-expression network was used to identify the pathways in which MIR4435-2HG could play a role. The results showed that the level of MIR4435-2HG was associated with metastatic pathway genes, such as epithelial-mesenchymal transition (EMT) (Figure 2C, FDR < 0.01). Many genes associated with the TP53 pathway had an expressive correlation with MIR4435-2HG expression (Figure 2C). The expression levels of all genes expressively correlated with MIR4435-2HG expression are shown in Figure 2D. These results suggest that MIR4435-2HG could play a role in the malignancy and metastasis of BC, and it seems to be more expressed in phenotypes with TP53 mutation.
Level of MIR4435-2HG with expression of genes of metastatic pathways, had a co-expression. A and B, The frequency of common mutations in BC based on the mutect2 method is shown. Also, MIR4435-2HG expression in tumor samples based on the type of mutation showed that the level of MIR4435-2HG was associated with TP53 mutation. C, Enrichment results for all genes present in the co-expression network significantly correlated with the expression level of MIR4435-2HG. MsigDB database information is used for enrichment. D, The co-expression network is shown for all genes that had an expression correlation with MIR4435-2HG at R> 0.5 and P < 0.01. The Pearson correlation test was performed between MIR4435-2HG expression and all genes in 1222 breast cancer sampl.
4.3. Expression Level of MIR 4435-2HG as a Biomarker for Drug Selection
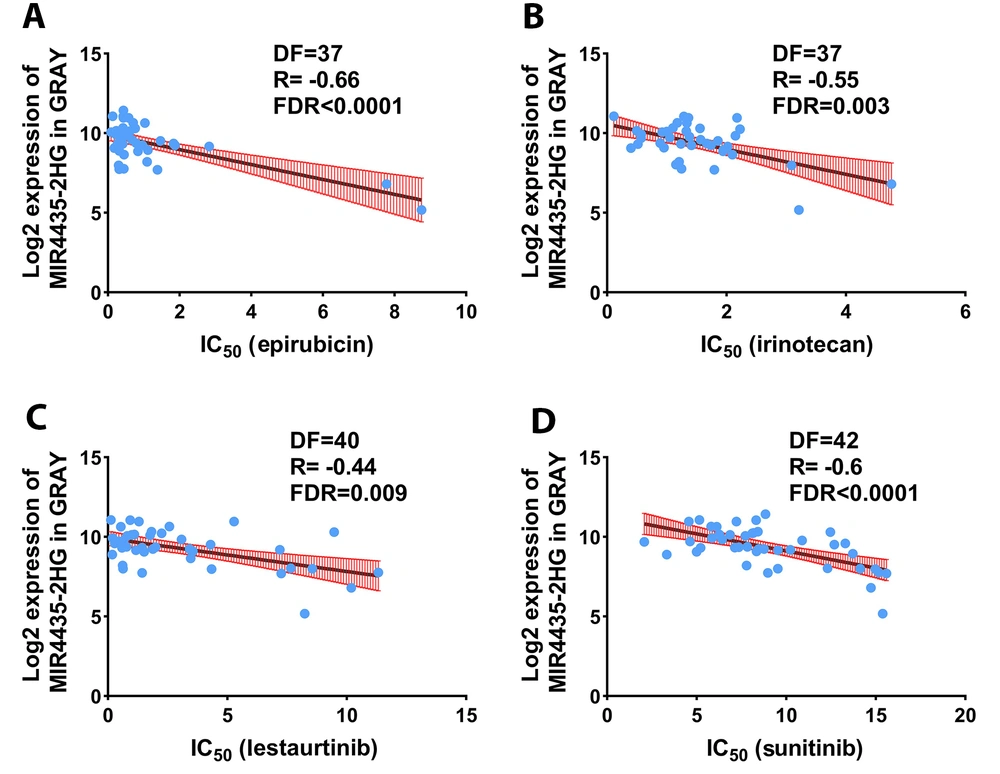
The expression of genes can play a role in drug resistance and sensitivity. Consequently, the association of MIR4435-2HG expression with drug sensitivity and resistance was evaluated based on PharmacoGX data. The results showed that MIR4435-2HG levels were correlated with sensitivity to some medications, including epirubicin, irinotecan, lestaurtinib, and sunitinib (Figure 3, R < - 0.4, FDR < 0.001). The expression of MIR4435-2HG was not associated with resistance to any medicines. These results indicate that the MIR4435-2HG level can be used as a marker for the selection of the mentioned medicines.
Expression of MIR4435-2HG can be considered as a biomarker for drug sensitivity. The association of MIR4435-2HG expression with IC50 of conventional chemotherapy drugs is demonstrated. The expression level of MIR4435-2HG in each BC cell line in pharmacoGX data was extracted and the IC50 level for each drug in each cell line was extracted. Pearson correlation test was used to evaluate drug sensitivity or resistance to MIR4435-2HG expression.
4.4. Estradiol Reduces the Level of MIR 4435-2HG in BC Cell Lines
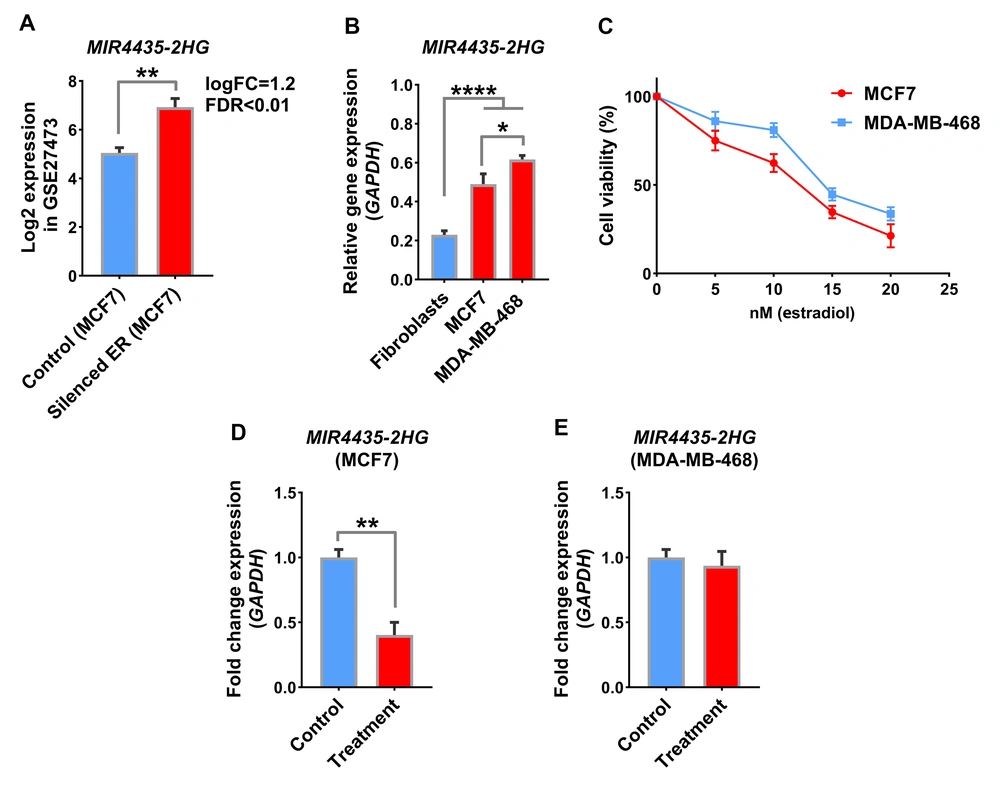
Previous results showed that MIR4435-2HG was upregulated in tumor samples and was associated with a poor prognosis in patients. We were trying to find a medication that could directly or indirectly reduce this lncRNA. A search in the GEO database showed that estrogen receptor (ER) silencing in the GSE27473 study could significantly increase MIR4435-2HG expression in the MCF7 cell line (Figure 4A, logFC = 1.2, FDR < 0.01). In addition, as shown in Figure 1D, BC samples in which the ER receptor is active showed lower expression levels for MIR4435-2HG. Therefore, the idea was formed that ER receptor activation by its ligands, such as estradiol, could affect MIR4435-2HG expression. For this purpose, the MCF7 cell line as an ER+/PR+ model, the MDA-MB-468 cell line as a triple-negative model, and the fibroblast as a non-cancerous cell line were used to evaluate the mentioned items. The results showed that the MIR4435-2HG level in the MDA-MB-468 cancer cell line was higher than in MCF7, and the expression rate of this lncRNA was higher in both BC cell lines compared to fibroblasts (Figure 4B, P < 0.01). The MTT assay indicated that 10 nM estradiol could be a suitable concentration for treating cell lines with this drug (Figure 4C). The effect of estradiol on MIR4435-2HG expression showed that the level of this lncRNA significantly declined in response to the medicine in the MCF7 cell line. However, MIR4435-2HG did not change in the MDA-MB-468 cell line in response to the medications (Figure 4D, P < 0.01). These results suggest that in samples with increased ER+ phenotype with MIR4435-2HG, estradiol could be a suitable drug to reduce the expression of this lncRNA and malignancy.
ER activity can regulate MIR4435-2HG expression in BC cell lines. A, MIR4435-2HG level is shown in the GEO data with access number GSE27473. In this study, transcriptome changes in response to ER activity through knockdown in MCF7 cell lines were evaluated; B, MIR4435-2HG expression is shown in BC cell lines including MCF7 and MDA-MB-468 compared to non-cancerous fibroblast cell lines; C, MTT results with estradiol treatment are displayed in two BC cell lines; D, The level of MIR4435-2HG in response to estradiol treatment is displayed in two BC cell lines. The effect of treatment on MIR4435-2HG expression was not significant in the MDA-MB-468 cell line, which is a model for a triple-negative phenotype.
5. Discussion
The role of lncRNAs in many cellular processes has been proven, and they are mentioned as essential molecules in many diseases, including cancer. To date, it has been shown that many lncRNAs can be good candidates for the targeted treatment of cancers, including BC (12). Medications based on the inhibition of lncRNAs, such as antisense oligonucleotides, have entered the second clinical phase (19). Therefore, identifying the lncRNAs involved in the pathogenesis of diseases can be very useful and increase our understanding of the mechanisms involved in disease progression.
The data of this study showed that the expression level of MIR4435-2HG had the highest association and the greatest effect on the poor prognosis of BC patients, and its expression in tumor samples rose significantly compared to normal. Studies have reported that MIR4435-2HG expression level can be associated with poor prognosis in colorectal cancer patients, and decreased expression can reduce proliferation and increase apoptosis in colorectal cancer (20). In addition, augmented expression of MIR4435-2HG has been observed in lung cancer and is associated with a poor prognosis in patients (21). The results in silico demonstrated that the level of MIR4435-2HG was richer in samples with TP53 mutation compared to other samples. Moreover, the co-expression network showed that MIR4435-2HG was co-expressed with genes associated with the TP53 and EMT pathways. Studies on the function of MIR4435-2HG in BC cells have shown that silencing MIR4435-2HG can inhibit the EMT process through the Wnt/β‑catenin signaling pathway (22). In addition, it has been reported in prostate cancer that MIR4435-2HG expression in prostate cancer samples increases compared to normal and raises the invasion and migration of prostate cancer cells (23). These findings suggest that the expression of MIR4435-2HG could be an excellent biomarker for poor prognosis in BC, and it can be used as a therapeutic target in BC patients with TP53 mutation.
Previous studies showed that epirubicin can be a suitable agent for BC patients in advanced stages with metastasis (24). On the other hand, our results demonstrated that MIR4435-2HG expression is expressively correlated with genes of metastatic pathways, such as EMT, and is associated with hypersensitivity to epirubicin. In addition, further analysis showed that high levels of MIR4435-2HG expression could be used to select drugs, and irinotecan, lestaurtinib, and sunitinib are helpful. Furthermore, GEO and in vitro data showed that MIR4435-2HG level decreases due to ER activation, and the activating ligands of ER, such as estradiol, can be suitable agents to reduce MIR4435-2HG expression. Alpha ER can inhibit EMT and be used as a treatment method in BC (25). It is, therefore, suggested that ER can reduce metastasis through MIR4435-2HG. The most important limitations of this study were the lack of epidemiological data and in vitro studies for drug sensitivity. As a result, the data on drug sensitivity needs more clinical information. In this regard, our results suggested that MIR4435-2HG could be a strong biomarker for BC survival, and its level may diminish under ER influence.
5.1. Conclusions
According to our findings, it had an oncogenic function and can be a useful biomarker for BC prognosis. Furthermore, it can also be used to select the appropriate medication. In patients who are ER+, MIR4435-2HG expression can be reduced by activating the ER receptor.


