1. Background
Morphine is widely regarded as the most effective opioid analgesic for severe pain management. Despite its efficacy, prolonged use often leads to tolerance, dependence, addiction, and withdrawal symptoms upon cessation (1, 2). Morphine exerts its rewarding effects primarily by stimulating mu-opioid receptors on GABAergic interneurons in the ventral tegmental area (VTA). This action inhibits GABA release, leading to the disinhibition of mesocorticolimbic dopaminergic neurons projecting to the nucleus accumbens (NAc), hippocampus, and prefrontal cortex (PFC) (3). Studies indicate that morphine addiction and withdrawal involve neuroadaptations at cellular and molecular levels within the mesocorticolimbic pathway (4). Traditionally known for its role in motor control and coordination, the cerebellum has recently been recognized for its broader impact on brain function, influenced by a decade of research (5). Carta et al. recently highlighted a direct synaptic connection between the cerebellum and the VTA, suggesting the cerebellum's direct involvement in the reward system (6).
Voltage-gated calcium channels are a diverse group of cation channels that activate upon membrane depolarization, facilitating the entry of calcium ions into cells. These channels are categorized based on their alpha subunits into Cav1.1, Cav1.2, Cav1.3, and Cav1.4 (L-type), Cav2.1 (P-type), Cav2.2 (N-type), Cav2.3 (R-type), and Cav3.1, Cav3.2, and Cav3.3 (T-type) (7). The influx of calcium ions triggered by these channels initiates several vital physiological responses, including neurotransmitter release, kinase activation, and gene expression (8). Morphine analgesia is partially mediated by its binding to mu-opioid receptors, which blocks calcium channels and subsequently decreases intracellular calcium concentrations (9). T-type calcium channels have been shown to play a significant role in the development of morphine antinociceptive tolerance, dependence, and withdrawal syndrome (10). Inhibition of the Cav2.3 calcium channel has been shown to enhance morphine analgesia and reduce tolerance in mice (11). Additionally, empirical studies have demonstrated the involvement of T-type calcium channels in the mechanism behind hyperalgesia induced by low doses of morphine in adult male rats (12).
Neurotrophic factors are crucial for physiological and developmental processes in both the peripheral and central nervous systems (13). Brain-derived neurotrophic factor (BDNF) is essential for brain plasticity, particularly in learning and memory processes (14). Increasing evidence suggests that BDNF expression rises after morphine administration in various brain regions, including the nucleus paragigantocellularis and the VTA (15, 16). Therefore, BDNF plays a pivotal role in neuroadaptation within the reward system and opioid addiction (17). Variations in BDNF levels observed during morphine withdrawal suggest that BDNF may contribute not only to opioid addiction but also to the withdrawal process (18).
2. Objectives
The aim of our study was to explore potential changes in the expression of calcium channels and neurotrophic factors in the cerebellum following morphine dependence and subsequent withdrawal. To this end, we assessed the mRNA levels of Cav1.1, Cav1.2, Cav2.2, and Cav3.1 calcium channels. Additionally, we measured the mRNA levels of BDNF and its receptor, tropomyosin-like receptor kinase B (TrkB), glial cell-derived neurotrophic factor (GDNF) and GDNF family receptor alpha-1 (GFRA1), nerve growth factor (NGF), and NGFR in the cerebellum after morphine dependence and a 30-day withdrawal period.
3. Methods
3.1. Subjects
Male Wistar rats with an average weight of 240 ± 20 g at the beginning of the experiments were used. The animals were kept in a controlled environment with a constant temperature of 22 ± 2°C and humidity levels between 50% and 60%. Lighting was programmed to maintain a 12-hour light/dark cycle, with lights on at 7:00 AM and off at 19:00 PM. The rats had continuous access to animal feed pellets and water. The use of laboratory animals followed international standards, according to the guidelines established by the National Academy of Sciences' Institute for Laboratory Animal Research (2011). The experimental protocol was approved by the Research Ethics Committee (REC) of the University of Kurdistan (ethical approval codes: IR.UOK.REC.1399.012 and IR.UOK.REC.1399.014.
3.2. Drug Treatments
Morphine sulfate was obtained from Temad (Daroopakhsh Co., Tehran, Iran) and dissolved in physiological saline prior to administration. Five experimental groups were used, each consisting of eight rats. Initially, two groups received intraperitoneal injections of either saline (1 mL/kg, i.p.) or morphine (10 mg/kg, i.p.) twice daily for 10 days, followed by a 30-day withdrawal period without treatment. A hotplate test of analgesia was conducted on days 1 and 10 of the injections and on day 30 of withdrawal to assess antinociception in the experimental groups.
The study was expanded to include three additional experimental groups for molecular analysis. The first group received saline, while the next two groups received morphine for 10 days as described above. Two hours after the last injection on the tenth day, rats in the morphine-treated (dependent) and saline-treated control groups were euthanized. Another group, the withdrawal group, received morphine for 10 days followed by a 30-day withdrawal period before undergoing brain dissection.
3.3. Brain Dissection
Gene expression analysis was performed on the cerebellum from eight rats in each experimental group. The entire brain was swiftly removed from the cranium, and the cerebellum was dissected bilaterally on a chilled, sterile surface (19, 20). Each dissected tissue was then immediately placed in liquid nitrogen for rapid cryopreservation and subsequently stored at -80°C until total RNA extraction.
3.4. Real-time Polymerase Chain Reaction (RT-PCR)
Total RNA was extracted from twenty milligrams of each tissue sample using a high purity RNA isolation kit, following the protocol provided by Roche, Germany. Complementary DNA (cDNA) synthesis was carried out using a kit from Thermo Fisher Scientific (USA), according to the included instructions. Real-time PCR was performed on a LightCycler 96 system by Roche (Germany). Each biological sample obtained from the rats was assessed in three technical replicates. The PCR reaction volume was 20 µL, including 2 µL of gene-specific primers (5 µM), 8 µL of cDNA (4 ng/µL), and 10 µL of MasterMix (Amplicon, Denmark) (21). The thermal cycling started with a pre-incubation at 95°C for 15 minutes, followed by 40 cycles of denaturation at 95°C for 5 seconds and annealing/extension at 60°C for 30 seconds. The procedure terminated with cooling and melting phases. Gene expression levels were analyzed using the Livak (2-ΔΔCT) method (22). Table 1 lists the primer sequences specific to the genes.
| Gene and Sequences (5′-3′) | Amplicon Size, bp |
|---|---|
| GAPDH | |
| F: AGTGCCAGCCTCGTCTCATA | 77 |
| R: GGTAACCAGGCGTCCGATAC | |
| Cav1.1 | |
| F: ACGTTGACCCAGATGAGAGC | 72 |
| R: TGATCAGTCGCATGACTCGG | |
| Cav1.2 | |
| F: TTATGGCCTTCAAACGTGGC | 89 |
| R: CACAACTGAACAGCTATCCCAC | |
| Cav2.2 | |
| F: TTCAGAGATGCCTGGAACGTC | 84 |
| R: CGTTTCCGCAATCTCCGTTAC | |
| Cav3.1 | |
| F: AGAGCGAGATTCCTGGTCG | 80 |
| R: TGTGGGTGATGATCCGGTG | |
| BDNF | |
| F: CAGGTCACTCTTCTGGCATGG | 90 |
| R: GGAGGAGGGAGGGAAAGAATGT | |
| TrkB | |
| F: TGGAGGATCATGTTCGGCAC | 103 |
| R: GGCCAGTATCTGTGATCGA | |
| GDNF | |
| F: CGGACGGGACTCTAAGATGAAG | 107 |
| R: CTTCGAGAAGCCTCTTACCGG | |
| GFRA1 | |
| F: GTAAATGGTTGCGTCCTGGC | 75 |
| R: CAGGGCTCAATGGAGGAAAGA | |
| NGF | |
| F: CTCTGAGGTGCATAGCGTAATG | 89 |
| R: TATCTGTGTACGGTTCTGCCTG | |
| NGFR | |
| F: GCTGCTGCTGCTGATTCTAG | 83 |
| R: ACTCTCCGCTGTGGGTGTA |
Abbreviations: GAPDH, glyceraldehyde-3-phosphate dehydrogenase; Cav1.1, voltage-gated calcium channel 1.1; Cav1.2, voltage-gated calcium channel 1.2; Cav2.2, voltage-gated calcium channel 1.2; Cav3.1, voltage-gated calcium channel 3.1; BDNF, brain-derived neurotrophic factor; >NTRK2, neurotrophic receptor tyrosine kinase 2; GDNF, glial cell-derived neurotrophic factor; GFRA1, GDNF family receptor alpha 1; NGF, Nerve growth factor; NGFR, Nerve growth factor receptor.
3.5. Statistical Analysis
Data were analyzed starting with the Shapiro-Wilk test to confirm their normal distribution. The Brown-Forsythe test was used to check for equality of variances. Mixed between-within subjects ANOVA was conducted, analyzing hotplate data with two factors: "The drug" with two levels (saline and morphine) and "days of testing" with three levels (days 1, 10, and 30). Gene expression differences among the three experimental groups were compared using one-way ANOVA. Post hoc comparisons were performed using Tukey's test. A significance level was set at P < 0.05. Data analysis and graphical presentations were performed using GraphPad Prism version 9.5 (San Diego, California, USA). The dataset is available upon request from the corresponding author either during review or after publication.
4. Results
4.1. Repeated Morphine Injections and Analgesic Response
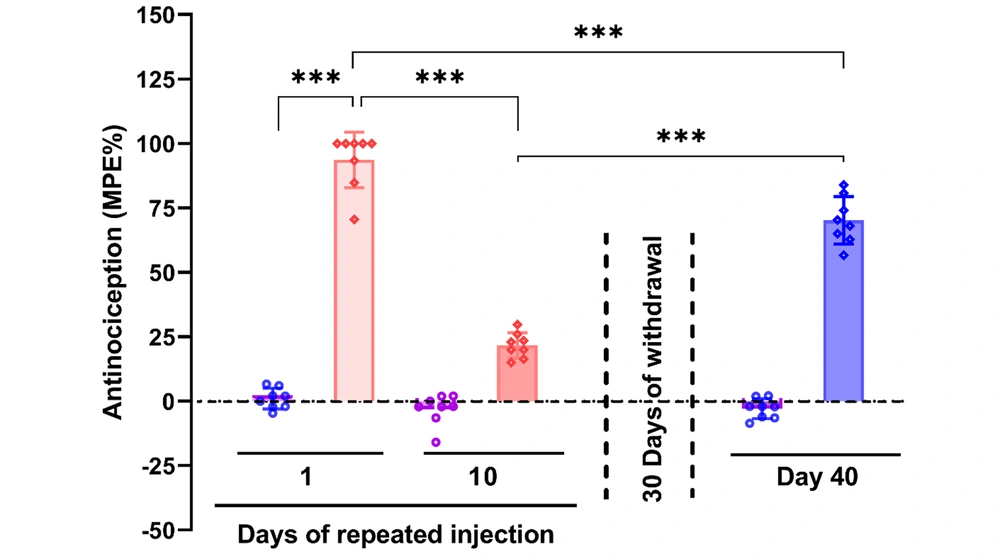
Repeated morphine injections resulted in decreased analgesic effects, which partially recovered after a 30-day withdrawal period. The hotplate test data were analyzed using a two-way repeated measures ANOVA, which revealed a significant interaction between the type of drug administered and the days of testing [F (2, 23) = 122, P < 0.001]. There was a statistically significant main effect for the drug type [saline vs. morphine, F (1, 14) = 804, P < 0.001] and the days of testing [F (2, 23) = 137, P < 0.001]. Post hoc analysis with Tukey’s test indicated significant analgesia from morphine on the first day of injection compared to the saline-treated control group (P < 0.001). However, the efficacy of morphine diminished significantly over 10 days of repeated administration (P < 0.001). Analgesia was restored to some extent after a 30-day withdrawal, although it remained significantly less effective compared to the initial day of administration (P < 0.001) (Figure 1).
Effect of 10 days of morphine treatment (10 mg/kg) and a 30-day withdrawal period on morphine analgesia. The data are presented as the mean ± standard deviation (n = 8 per experimental group). Circle or diamond dots on each bar represent the distribution of individual data in each experimental group. A two-way repeated measure using a mixed between-within subject design was employed. Analysis of variance (ANOVA) was used to ascertain the general disparities among the groups. *** P < 0.001 indicates a statistical difference between the specified groups
4.2. Changes in Voltage-Gated Ca2+ Channel Expression After Morphine Dependence and Withdrawal
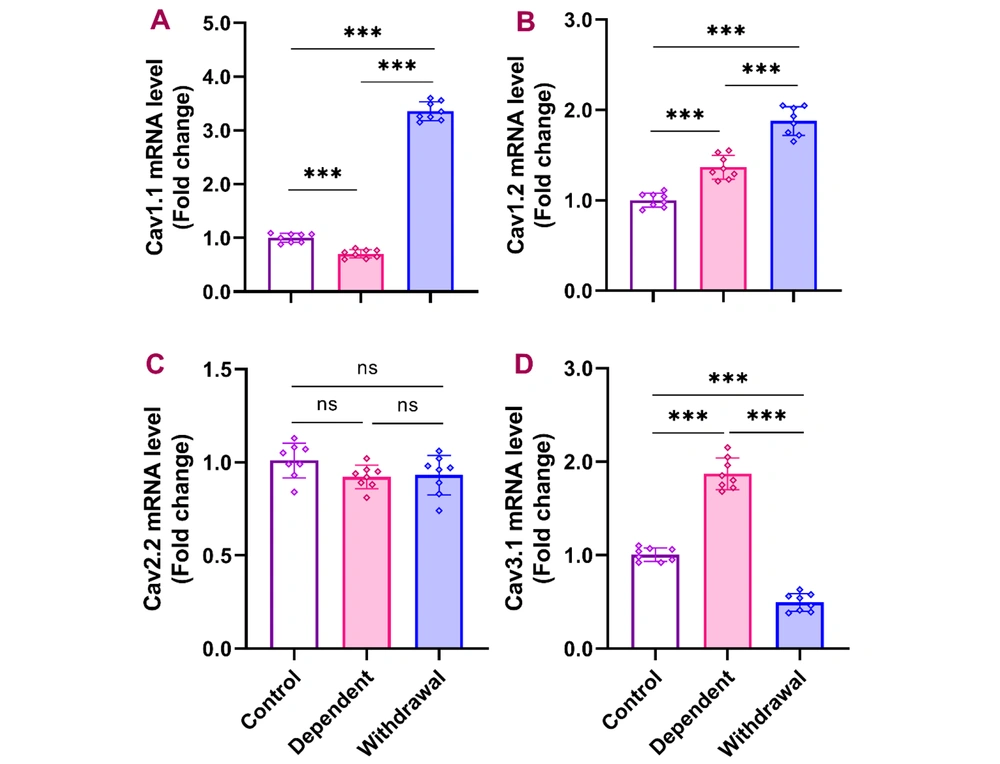
Quantitative PCR results from the cerebellum indicated that continuous morphine administration for 10 days significantly reduced Cav1.1 expression, which then significantly increased after a 30-day withdrawal compared to both the control and dependent groups [F (2, 21) = 11, P < 0.001]. Cav1.2 expression significantly increased in the dependent group compared to the control, with further significant elevation observed in the withdrawal group [F (2, 21) = 96.26, P < 0.001]. No significant differences were found in the expression of Cav2.2 across the groups [F (2, 21) = 2.395, P > 0.05]. Cav3.1 expression was significantly higher in the dependent group compared to the control and significantly decreased in the withdrawal group compared to both the dependent and control groups [F (2, 21) = 273.6, P < 0.001] (Figure 2).
Gene expression of Cav1.1, Cav1.2, Cav2.2, and Cav3.1 in the cerebellum after morphine dependence and withdrawal. The data are presented as the mean ± standard deviation (n = 8 per group). Dots on each bar represent the distribution of individual data within each experimental group. A, Cav1.1 (voltage-gated calcium channel 1.1); B, Cav1.2 (voltage-gated calcium channel 1.2); C, Cav2.2 (voltage-gated calcium channel 2.2); D, Cav3.1 (voltage-gated calcium channel 3.1). ns: Non-significant, *** P < 0.001
4.3. Changes in BDNF and TrkB Expression During Morphine Dependency and Withdrawal
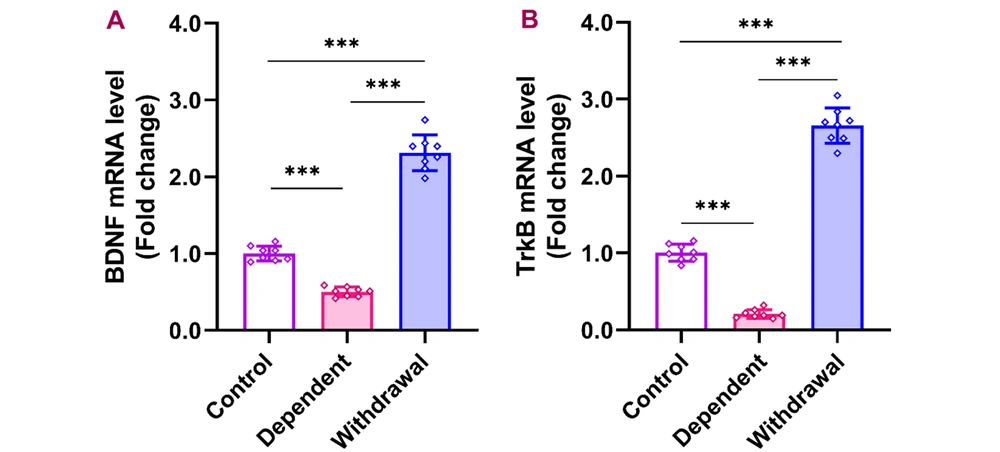
BDNF and TrkB expression in the cerebellum reduced considerably during morphine dependency, but increased markedly after a 30-day withdrawal period. The cerebellar qPCR data indicated that the expression of BDNF and its receptor, TrkB, significantly decreased during morphine dependency [BDNF: F (2, 21) = 311.0, P < 0.001; TrkB: F (2, 21) = 545.3, P < 0.001], relative to the control group. Notably, both BDNF and TrkB levels increased markedly after a 30-day withdrawal period compared to their levels during dependence and in control conditions (Figure 3).
Gene expression of BDNF and its receptor, TrkB, in the cerebellum after morphine dependence and withdrawal. The data are presented as the mean ± standard deviation (n = 8 per group). Dots on each bar show the distribution of individual data. A: BDNF (brain-derived neurotrophic factor), B: TrkB (tropomyosin receptor kinase B), *** P < 0.001
4.4. GDNF and GFRA1 Expression Changes in Response to Morphine
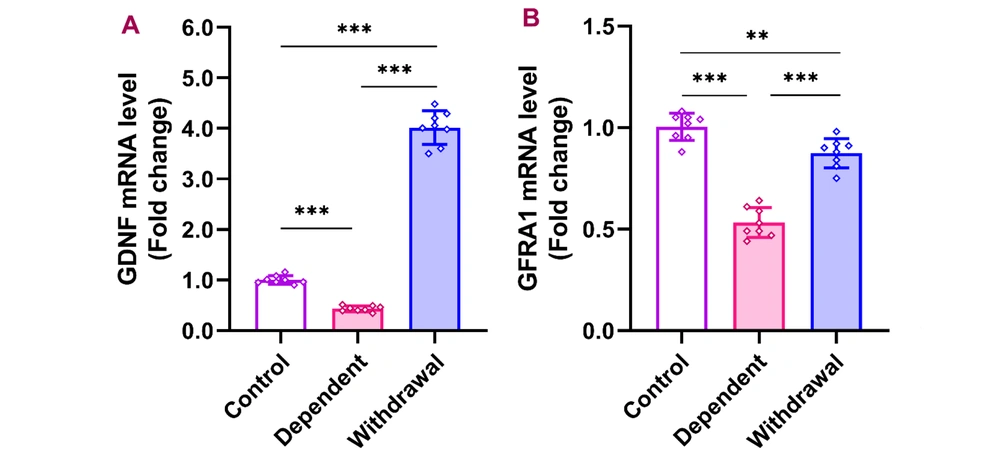
Expression levels of GDNF in the cerebellum were significantly lower in the morphine-dependent group compared to controls but increased substantially after a 30-day withdrawal [F (2, 21) = 744.9, P < 0.001]. Similarly, the expression of GDNF's receptor, GFRA1, decreased dramatically during dependence but approached control levels after withdrawal [F (2, 21) = 95.03, P < 0.001] (Figure 4).
Gene expression of GDNF and GFRA1 in the cerebellum after morphine dependence and withdrawal. The data are presented as the mean ± standard deviation (n = 8 per group). Dots on each bar indicate the distribution of individual data. A, GDNF (glial cell-derived neurotrophic factor); B, GFRA1 (GDNF family receptor alpha 1), ** P < 0.01, *** P < 0.001
4.5. Effects of Morphine Dependency and Withdrawal on NGF and NGFR Expression
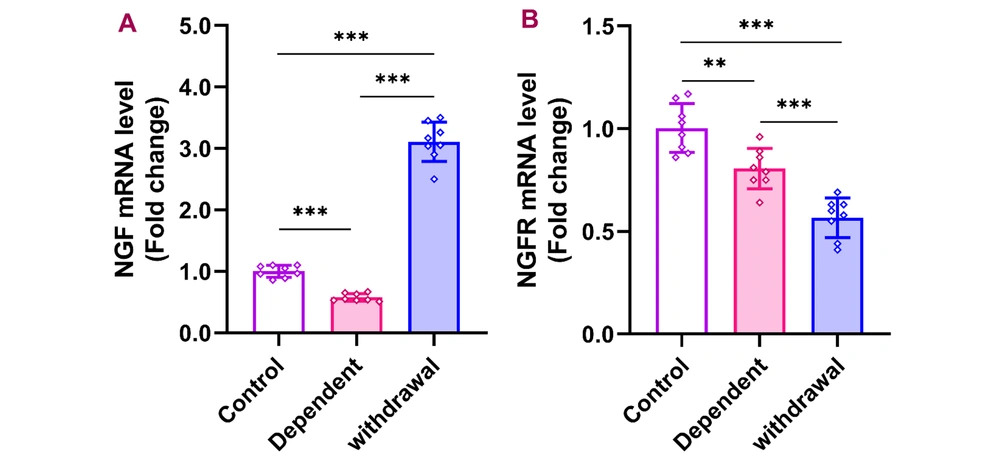
Following morphine dependency, NGF expression in the cerebellum significantly decreased but increased sharply after 30 days of withdrawal [F (2, 21) = 381.8, P < 0.001]. In contrast, NGFR expression remained significantly reduced in both the dependent and withdrawal groups compared to the control group [F (2, 21) = 34.77, P < 0.001] (Figure 5).
Gene expression of NGF and NGFR in the cerebellum after morphine dependence and withdrawal. The data are presented as the mean ± standard deviation (n = 8 per group). Dots on each bar indicate the distribution of individual data. A, NGF (nerve growth factor); B, NGFR (nerve growth factor receptor), ** P < 0.01, *** P < 0.001
5. Discussion
This study demonstrated that repeated morphine injections lead to diminished analgesia after 10 days, indicating tolerance. The analgesic effects of morphine were partly restored 30 days post-withdrawal, though not to the levels seen on the first day of administration. Chronic morphine use alters molecular and cellular pathways, especially in brain regions involved in reward and pain processing (23-25), thus changing the brain’s response to the drug (26). Prior research has shown that an eight-day regimen of morphine injections induces tolerance and dependence (26). Frequent morphine use reduces its therapeutic effects and increases addiction risk (27). Extensive studies suggest morphine primarily impacts the reward system, targeting areas like the VTA, striatum, and PFC (26, 27). Recent findings highlight a direct link between the cerebellum and VTA, suggesting novel pathways for exploring the cerebellar cortex's role in morphine's effects on the reward system (6).
Accumulating evidence suggests that chronic exposure to morphine leads to changes in gene expression in various brain areas involved in addiction (26, 28). Furthermore, discontinuing morphine use triggers withdrawal symptoms, which are associated with alterations in gene and protein expression (29). Our findings revealed that prolonged morphine treatment significantly reduced Cav1.1 expression in the cerebellum, which not only returned to baseline but also increased sharply after a 30-day withdrawal period compared to the saline-treated control group. Expression of Cav1.2 was significantly elevated in both the dependent and withdrawal groups compared to the control group. However, Cav2.2 expression did not show significant changes across the groups. Additionally, Cav3.1 expression markedly increased in the morphine-dependent group but significantly declined in the withdrawal group compared to both dependent and control groups.
Calcium channels facilitate cell membrane depolarization by allowing the influx of calcium ions, which is crucial for secretion, contraction, neurotransmission, gene expression, and various other physiological processes (30, 31). Morphine acts by activating mu-opioid receptors, which block calcium channels and inhibit the release of neurotransmitters from axon terminals. This activation sets off a molecular cascade that ultimately influences gene expression (9). Various studies have highlighted the role of T-type calcium channels in antinociception, tolerance, pain behavior, and dependence (12). These channels can affect neuronal excitability, suggesting their role in pain signal transmission at multiple levels, including peripheral nociceptors, the spinal cord, and the brain (32). Research has shown that expression of Cav1.2 and Cav1.3 increases with the development of morphine tolerance. However, blocking these channels with fluoxetine delayed morphine-induced antinociception, tolerance, and dependence (33). Considering the data cited above and the changes in the expression of calcium channels in the cerebellum observed in this study, we propose a critical role for these calcium channels in cerebellar neuroadaptation associated with morphine tolerance, dependence, and withdrawal.
Research has shown that calcium channels can be influenced by various substances, either directly or indirectly. Specifically, BDNF can inhibit the function of calcium channels in nerve terminals in the CNS (34). Our results also demonstrated that prolonged morphine treatment significantly reduced the expression of BDNF and its receptor, TrkB, in the dependent group compared to the control group. However, their expression markedly increased after a 30-day withdrawal period relative to both the control and dependent groups. Additionally, the expression of GDNF notably decreased in the dependent group compared to the control group but significantly increased after the 30-day withdrawal period relative to both control and dependent groups. The expression of GFRA1 decreased in the dependent group but partially recovered after the withdrawal period, although it did not return to control levels. Furthermore, NGF expression substantially decreased in the dependent group compared to the control group. However, after the 30-day withdrawal period, NGF expression significantly increased compared to both the control and dependent groups. Additionally, there was a notable reduction in NGFR expression at mRNA levels in both the dependent and withdrawal groups compared to the control group.
Neurotrophic factors such as BDNF, GDNF, NGF, and their receptors NGFR, TrkB, and GFRA1 play crucial roles in regulating brain survival, plasticity, and signaling (35). These neurotrophic factors, by regulating dopaminergic transmission in the NAc, which receives projections from the VTA, have been linked to the addiction process (17). BDNF is important for survival, cell growth, and differentiation (36). Studies on acute cocaine exposure have shown significant expression of BDNF in the VTA, NAc, and PFC (37). Grimm et al. observed that BDNF expression within the mesolimbic dopaminergic system increased for 90 days following cocaine cessation, whereas long-term morphine administration led to a reduction in BDNF expression in the VTA in mice (38). Moreover, clinical studies have reported both increases and decreases in serum BDNF levels in heroin addicts (35).
According to the current results, we observed a general decrease in the expression of neurotrophic factors in the cerebellum following morphine dependence, suggesting adverse effects of prolonged morphine exposure on neuronal survival. However, a 30-day withdrawal period appears to restore nearly all the examined neurotrophic factors in the cerebellum, supporting the hypothesis that cessation of morphine triggers homeostatic processes in the cerebellum. Supporting our findings, other researchers have demonstrated that morphine withdrawal increases the precursor of BDNF in the striatum and frontal cortex (18). Our recent studies have shown that repeated morphine exposure reduces BDNF protein levels in the cerebellum but increases TrkB expression there. Nevertheless, a 30-day withdrawal period partially restored the expression of BDNF and TrkB (39). Further research is needed to clarify the specific impact of morphine on the expression of neurotrophic factors in the cerebellum and their roles in morphine dependency and withdrawal.
5.1. Conclusions
The results of this experiment show that 10 days of morphine treatment induces analgesic tolerance and dependence, significantly affecting the gene expression of voltage-gated calcium channels and neurotrophic factors in the cerebellum. However, a 30-day withdrawal period in most cases not only restored the decreased levels of these factors but also sharply increased them above control levels. Our findings suggest that prolonged morphine therapy disrupts homeostatic mechanisms by altering the expression of voltage-gated calcium channels and neurotrophic factors in the cerebellum. This results in adverse consequences following morphine withdrawal and dependence.

