


1. Background
Diabetes mellitus (DM) is a chronic metabolic disorder characterized by persistent high blood sugar levels, resulting from impaired insulin secretion, action, or both. The International Diabetes Federation (IDF) estimates that approximately 537 million adults worldwide are affected by diabetes, representing a prevalence of 10.5% among individuals aged 20 to 79. Projections indicate that this number could increase to 643 million by 2030 and 783 million by 2045, reflecting a 46% rise despite a 20% growth in the global population (1). Diabetes mellitus type 2 (T2DM) accounts for approximately 98% of all diabetes cases, with significant regional variations in prevalence (2). The recent surge in diabetes cases is attributed to factors such as urbanization, sedentary lifestyles, and dietary changes, which contribute to rising obesity rates (3). In Iraq, 13.9% of adults are living with diabetes, according to the World Health Organization (WHO) report in 2020. This high prevalence presents considerable public health challenges, necessitating research into the causes, risk factors, and potential diagnostic markers for diabetes to inform effective prevention and management strategies (4).
Genetic factors play a significant role in the etiology of T2DM, with various genetic markers and polymorphisms linked to increased susceptibility (5). Long noncoding RNAs (lncRNAs) have emerged as important regulators of gene expression and metabolic processes (6, 7). One notable lncRNA, HOX transcript antisense RNA (HOTAIR), located on chromosome 12q13.13, consists of 2,158 nucleotides and plays a critical role in regulating gene expression through interactions with chromatin-modifying complexes (8, 9). HOTAIR has been implicated in glucose metabolism and insulin signaling, potentially influencing insulin sensitivity and glucose uptake (10, 11). Research suggests that HOTAIR may regulate glucose transporters such as GLUT1, which is vital for glucose uptake. Understanding the mechanisms by which HOTAIR affects glucose metabolism could identify therapeutic targets for T2DM management (12, 13). Specific single-nucleotide polymorphisms (SNPs) in the HOTAIR gene, such as rs874945, rs7958904, rs12826786, and rs1899663, may alter HOTAIR expression and contribute to T2DM risk. A meta-analysis highlighted 31 genes significantly associated with T2DM risk in Iraq, emphasizing the need for further investigation (14-16).
Although a meta-analysis by Musafer et al. identified 31 genes across 41 studies that are strongly associated with the risk of T2DM in Iraq (17), no research has been conducted on the association between HOTAIR SNPs, the expression levels of this lncRNA, and T2DM in Iraqi populations.
2. Objectives
This study examines the relationship between HOTAIR SNPs rs12826786 (C > T) and rs1899663 (G > T) and the risk of T2DM in an Iraqi population, aiming to evaluate whether HOTAIR expression can serve as a diagnostic marker for identifying individuals predisposed to diabetes.
3. Methods
3.1. Patients and Controls
This study included 48 participants aged 22 to 60, consisting of 28 patients with T2DM from Thi-Qar Governorate, Iraq, and 20 healthy controls. Patients were selected based on WHO criteria for diabetes diagnosis. Inclusion criteria required confirmed T2DM diagnoses, while exclusion criteria ruled out individuals with other types of diabetes, severe cardiovascular disease, malignancies, autoimmune disorders, recent corticosteroid treatments, recent surgeries, blood transfusions, diabetes-related complications, or uncontrolled hyperglycemia. All patients were newly diagnosed with T2DM and had not received any diabetes treatment prior to sampling, ensuring that complications or uncontrolled hyperglycemia were not present at the time of diagnosis.
3.2. Genotyping
Blood samples (5 mL) were collected in EDTA tubes, diluted tenfold, and frozen using a programmable freezer (Plate freezer RoSS.pFTU, USA) following this protocol: Cooled from 5°C to -10°C at a rate of 1°C/min, held at -10°C for 3 minutes, and then cooled from -10°C to -20°C at 1°C/min. The frozen blood was stored at -20°C until DNA extraction. For genomic DNA extraction, the samples were thawed by incubation at 37°C for 15 minutes, and the Geneaid USA gSYNCTM DNA extraction kit, specifically designed for frozen blood, was utilized.
Genotyping of SNPs rs12826786 and rs1899663 was performed using the amplification refractory mutation system (ARMS)-PCR, with primers designed using Primer3 software, as detailed in Table 1. The PCR protocol included an initial denaturation at 95°C for 5 minutes, followed by 35 cycles at 95°C for 30 seconds, 58°C for 30 seconds, and 72°C for 30 seconds, ending with a final extension at 72°C for 5 minutes. The total reaction volume was 25 μL, utilizing GoTaq® G2 Green Master Mix. PCR products were analyzed via agarose gel electrophoresis, and selected samples were sequenced with an ABI automated DNA sequencer (Applied Biosystems, USA).
| Variables and Primers | Sequence (5ʹ → 3ʹ) | Product Size (bp) |
|---|---|---|
| rs1899663 | 247 | |
| Wild type forward C allele primer | AAGCCTCTAATTGTTGTCATC | |
| Mutant forward A allele primer | AAGCCTCTAATTGTTGTCATA | |
| Generic reverse primer | TAATCAAATCCTCTTCCTTTGT | |
| rs12826786 | 140 | |
| Wild type reverse C allele primer | GAGGGAAGGAGCTTAGGATAAATG | |
| Mutant reverse T allele primer | GAGGGAAGGAGCTTAGGATAAATA | |
| Generic forward primer | ATCTGTCCAGTCGCTCGTC |
Oligonucleotide Primers Used in Amplification Refractory Mutation System PCR
3.3. HOTAIR Gene Expression Analysis
Total RNA was extracted from blood samples using the TRIzol® Reagent Kit, and its quantity and quality were evaluated with a NanoDrop 2000 Spectrophotometer (Thermo Scientific, USA). To eliminate residual genomic DNA, RNA samples were treated with DNase I. First-strand complementary DNA (cDNA) was synthesized using the QIAGEN cDNA synthesis kit (QIAGEN, Germany), with primers designed using Primer3 software, as detailed in Table 2.
| Primers | Sequence (5ʹ → 3ʹ) | Product Size (bp) | NCBI Reference |
|---|---|---|---|
| HOTAIR | 140 | ||
| F | ACCAGCAATTACACCCAAGC | ||
| R | TGCATTTCTCTGCGTGGTTC | ||
| GAPDH | 129 | ||
| F | TCACCAGGGCTGCTTTTAAC | ||
| R | TGACGGTGCCATGGAATTTG |
Forward and Reverse Primer Sequences
Quantitative real-time PCR (qRT-PCR) was performed in triplicate in a 20 µL reaction volume, consisting of 5 µL of cDNA (100 ng), 1.0 µL of each forward and reverse primer (10 pmol), 10 µL of SYBR Green master mix, and 3.0 µL of DEPC-treated water, with GAPDH as the normalization gene. Relative expression levels of the HOTAIR gene were calculated using the 2-ΔΔCT method. qRT-PCR was conducted on an ABI 7500 real-time PCR system (Applied Biosystems, USA), following specific cycling conditions: Initial denaturation at 95°C for 5 minutes, followed by 35 cycles at 95°C for 20 seconds, 60°C for 30 seconds, and 72°C for 30 seconds.
3.4. Statistical Analysis
To evaluate Hardy-Weinberg equilibrium for allele frequencies of the two SNPs, a chi-square test was conducted. Genotype and allele frequencies were compared using odds ratios (ORs), and a logistic regression model was employed to assess the association between SNP genotypes and T2DM risk. Gene expression levels in control and treated samples were analyzed using Tukey's HSD post-hoc test. Results are presented as mean ± standard error, with statistical significance set at P ≤ 0.05. Statistical analyses were performed using SPSS version 21.0.
4. Results
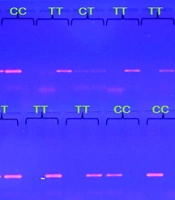
The study evaluated HOTAIR gene expression levels in individuals with T2DM, finding them to be 6.6 times higher than in healthy controls, indicating HOTAIR's potential role in T2DM pathophysiology. Regression analysis confirmed the validity of the model used (Figure 1). Agarose gel electrophoresis was employed to analyze the HOTAIR polymorphisms rs1899663 and rs12826786, identifying three genotypes for each: GG, TT, and GT (274 bp) for rs1899663, and CC, TT, and CT (140 bp) for rs12826786 (Figure 2).
 patients compared to healthy control. A, the mean of fold change (2<sup>-ΔΔCT</sup>) values between the control and patient’s groups. The error bars represent the standard deviation. This graph shows a significant difference in the mean fold change between the two groups; B, the normal P-P plot of regression standardized residual for the dependent variable \"ΔCT patients\". The plot demonstrates that the residuals follow a normal distribution, which is an important assumption for the regression analysis performed. Data are expressed as mean ± SD (n = 3). P-values < 0.05 indicate statistically significant differences.")
The relative expression of HOTAIR gene in diabetes mellitus type 2 (T2DM) patients compared to healthy control. A, the mean of fold change (2-ΔΔCT) values between the control and patient’s groups. The error bars represent the standard deviation. This graph shows a significant difference in the mean fold change between the two groups; B, the normal P-P plot of regression standardized residual for the dependent variable "ΔCT patients". The plot demonstrates that the residuals follow a normal distribution, which is an important assumption for the regression analysis performed. Data are expressed as mean ± SD (n = 3). P-values < 0.05 indicate statistically significant differences.

Amplicons for A, rs1899663; and B, rs12826786 HOTAIR gene single nucleotide polymorphism. M: Molecular ladder.
Hardy-Weinberg equilibrium (HWE) assessments yielded P-values of 0.082 for rs12826786 in patients and 0.44 in controls, indicating equilibrium. For rs1899663, the P-values were 0.525 and 0.245 in patients and controls, respectively. An online tool was used to calculate odds ratios and confidence intervals, revealing no significant association between rs1899663 and T2DM, while rs12826786 showed a significant association with the protective C allele (Table 3).
| Variables | T2DM Patients | Control | OR | CI 95% | P-Value a |
|---|---|---|---|---|---|
| rs1899663 (G > T) | |||||
| Genotype frequency | |||||
| GG | 9 (50) | 9 (50) | 0.57 | 0.176 - 1.89 | 0.36 |
| GT | 11 (64.7) | 6 (35.3) | 1.5 | 0.44 - 5.11 | 0.5 |
| TT | 8 (61.5) | 5 (38.5) | 1.2 | 0.32 - 4.4 | 0.78 |
| Allele frequency | 0.71 | 0.31 - 1.62 | 0.42 | ||
| G | 29 (54.7) | 24 (45.3) | |||
| T | 27 (62.8) | 16 (37.2) | |||
| Recessive model | 0.83 | 0.22 - 3.06 | 0.78 | ||
| GG+GT | 20 (57.1) | 15 (42.9) | |||
| TT | 8 (61.6) | 5 (38.4) | |||
| Dominant model | 0.57 | 0.17 - 1.89 | 0.36 | ||
| GG | 9 (50) | 9 (50) | |||
| TT+GT | 19 (63.3) | 11 (36.7) | |||
| rs12826786 (C > T) | |||||
| Genotype frequency | |||||
| CC | 9 (45) | 11 (55) | 0.3876 | 0.1185 - 1.2681 | 0.117 |
| CT | 8 (57.1) | 6 (42.9) | 0.933 | 0.2648 - 3.2895 | 0.9145 |
| TT | 11 (78.6) | 3 (41.4) | 3.66 | 0.86 - 15.5 | 0.077 |
| Allele frequency | 0.37 | 0.15 - 0.87 | 0.023 | ||
| C | 26 (48.1) | 28 (51.9) | |||
| T | 30 (71.4) | 12 (28.6) | |||
| Recessive model | 0.27 | 0.06 - 1.15 | 0.07 | ||
| CC+CT | 17 (50) | 17 (50) | |||
| TT | 11 (78.6) | 3 (41.4) | |||
| Dominant model | 0.7 | 0.244 - 2.19 | 0.57 | ||
| CC | 9 (45) | 11 (55) | |||
| TT+CT | 19 (52.7) | 17 (47.3) | |||
Distribution of Allele and Frequencies of HOTAIR Gene Polymorphisms: Analysis of Single-Nucleotide Polymorphisms in Diabetes Mellitus Type 2 Patients and Healthy Controls
The study also examined the relationship between these genotypes and various blood parameters, including body mass index (BMI), glycated hemoglobin (HbA1c), cholesterol, high-density lipoprotein (HDL), triglycerides, and fasting blood sugar (FBS). Statistical analysis confirmed normality and homogeneity of variance, identifying a significant association between the CT genotype of rs12826786 and higher BMI (P = 0.028) compared to the CC and TT genotypes. However, other parameters did not show significant associations, suggesting that while trends may exist, limitations in sample size and variation constrain the strength of the conclusions (Table 4).
| Variables | Reference Value | Genes | Genotype | N | Mean ± SD | P-Value a |
|---|---|---|---|---|---|---|
| BMI | 18.5 - 24.9 | rs1899663 | GG | 9 | 28.9 ± 4.9 | 0.093 |
| GT | 11 | 33.2 ± 5.7 | ||||
| TT | 8 | 27.9 ± 4.8 | ||||
| rs12826786 | CC | 9 | 28.4 ± 4.7 | 0.028 | ||
| CT | 8 | 34.81 ± 6.5 | ||||
| TT | 11 | 28.72 ± 4.9 | ||||
| HbA1c (%) | 4 - 5.6 | rs1899663 | GG | 9 | 8.24 ± 1.7 | 0.149 |
| GT | 11 | 9.55 ± 3.6 | ||||
| TT | 8 | 8.08 ± 4.4 | ||||
| rs12826786 | CC | 9 | 8.27 ± 1.3 | 0.6 | ||
| CT | 8 | 9.2 ± 4.7 | ||||
| TT | 11 | 8.72 ± 4.7 | ||||
| Total Cholesterol (mg/dL) | Less than 200 | rs1899663 | GG | 9 | 181.88 ± 22.2 | 0.78 |
| GT | 11 | 190.54 ± 32.3 | ||||
| TT | 8 | 172 ± 42.4 | ||||
| rs12826786 | CC | 9 | 172.88 ± 23.8 | 0.82 | ||
| CT | 8 | 186.5 ± 25.7 | ||||
| TT | 11 | 187 ± 44.54 | ||||
| HDL (mg/dL) | Men: Less than 40; women: Less than 50 | rs1899663 | GG | 9 | 35.1 ± 4.1 | 0.647 |
| GT | 11 | 38.36 ± 6.2 | ||||
| TT | 8 | 37.75 ± 5.9 | ||||
| rs12826786 | CC | 9 | 37.55 ± 7.7 | 0.62 | ||
| CT | 8 | 39.04 ± 9.9 | ||||
| TT | 11 | 35.45 ± 6.4 | ||||
| Triglycerides (mg/dL) | Less than 150 | rs1899663 | GG | 9 | 181.88 ± 42.7 | 0.969 |
| GT | 11 | 174.27 ± 41.5 | ||||
| TT | 8 | 180.5 ± 34.8 | ||||
| rs12826786 | CC | 9 | 181.88 ± 45.9 | 0.93 | ||
| CT | 8 | 170.75 ± 43.6 | ||||
| TT | 11 | 181.36 ± 37.6 | ||||
| FBS (mg) | 70 - 100 | rs1899663 | GG | 9 | 224.33 ± 39.1 | 0.994 |
| GT | 11 | 219.81 ± 69.4 | ||||
| TT | 8 | 225.37 ± 80.6 | ||||
| rs12826786 | CC | 9 | 194.66 ± 43.3 | 0.68 | ||
| CT | 8 | 228.51 ± 84.2 | ||||
| TT | 11 | 241.81 ± 95.1 |
Association of the rs1899663 and rs1800896 HOTAIR Gene Polymorphisms with Biochemical Parameters in Diabetes Mellitus Type 2 Patients
5. Discussion
Recent research has highlighted the role of genetic factors in understanding T2DM, with particular focus on the long non-coding RNA HOTAIR. One mechanism by which HOTAIR exerts its effects is through the inhibition of sirtuin 1 (SIRT1), a protein essential for regulating metabolism, inflammation, and aging. This inhibition disrupts beneficial metabolic processes and contributes to increased insulin resistance, emphasizing SIRT1 as a potential therapeutic target for enhancing insulin sensitivity. Additionally, HOTAIR suppresses the Akt/GSK-3β signaling pathway, resulting in diminished insulin sensitivity and impaired glycogen synthesis, thereby exacerbating hyperglycemia (18, 19).
Our study found that HOTAIR expression levels were approximately 6.6 times higher in individuals with T2DM compared to healthy controls, raising questions about its role in diabetes. Elevated HOTAIR expression is significantly stimulated by tumor necrosis factor-alpha (TNFA), which is implicated in various inflammatory diseases, including type 1 diabetes mellitus (T1DM) (20, 21). Increased HOTAIR levels further contribute to hepatic insulin resistance by activating the Akt and GSK pathways (22). Moreover, HOTAIR upregulates genes related to the cell cycle, such as PLK4 and CCNA2, which are associated with T2DM development.
Studies have demonstrated that HOTAIR acts as a molecular sponge for miR-34a, targeting SIRT1, suggesting that its overexpression may offer protective effects against diabetic cardiomyopathy (DCM) (23). Furthermore, HOTAIR has been implicated in enhancing cardiomyocyte survival through activation of the PI3K/Akt pathway (24). However, some researchers, such as Majumder et al., propose that HOTAIR's role in diabetic kidney disease may be passive (25). HOTAIR's involvement also extends to facilitating angiogenesis in diabetic retinopathy (26) and is implicated in various diabetes-related pathways, such as TNF signaling and FoxO signaling (27). These findings collectively underscore HOTAIR's critical role in glucose metabolism and its potential as a biomarker for chronic diabetes complications.
HOTAIR polymorphisms have been linked to increased risks for various conditions, including cancer and coronary artery disease, by influencing HOTAIR expression (28). Wang et al. reported associations between HOTAIR polymorphisms and lung cancer susceptibility, with environmental factors playing a significant role (28). Li et al. demonstrated that the rs4759314 A/G polymorphism affects HOTAIR promoter activity, disrupting critical pathways involved in congenital heart disease (19). However, Bayram et al. found no significant association between the HOTAIR rs920778 C/T polymorphism and gastric cancer risk in a Turkish population, highlighting that genetic impacts can vary by ethnicity or cancer type (29).
Despite extensive studies on HOTAIR in cancer, research on its polymorphisms in relation to diabetes remains limited. This gap emphasizes the need for further investigations into how HOTAIR genetic variations may influence diabetes risk and pathophysiology. In a study by Majidpour et al., the impact of polymorphisms in the HOTAIR lncRNA on chronic kidney disease (CKD) susceptibility was examined. The rs4759314 variant provided significant protection against CKD, while rs3816153 reduced risk by up to 78% in certain genotypes. Conversely, the CC+CT genotype and T allele of rs12826786 increased CKD risk. Notably, the specific haplotype (Crs12826786Trs920778Grs1899663Grs4759314G) was associated with an 86% reduced risk (16).
The study by Chuang et al. assessed the correlation between HOTAIR SNPs and diabetic retinopathy (DR) characteristics. They genotyped four SNPs in 276 DR patients and 452 controls, identifying significant associations between rs12427129 CT and rs1899663 TT variants and increased DR risk. In the proliferative diabetic retinopathy (PDR) subgroup, these SNPs were more prevalent, particularly among females. Additionally, patients with rs1899663 GT+TT had a shorter duration of diabetes. Overall, HOTAIR SNPs rs12427129 and rs1899663 are closely linked to DR presence, particularly in females with PDR (30).
Sargazi et al. investigated the association between four polymorphisms—rs920778 (C/T), rs4759314 (A/G), rs12826786 (C/T), and rs1899663 (G/T)—in the HOTAIR gene and T2DM risk in a southeast Iranian population. They found significant positive associations between the first three polymorphisms and T2DM susceptibility, while rs1899663 showed a negative association, suggesting a protective effect. Additionally, links were noted between rs920778 and HDL-C, and rs4759314 with fasting blood sugar and LDL-C levels. Haplotype analysis revealed that specific haplotypes significantly increased T2DM risk, indicating the potential of HOTAIR polymorphisms as prognostic markers influencing disease susceptibility through various pathways (31).
Our analysis of blood parameters showed a significant association between rs12826786 and BMI, suggesting that this genotype may contribute to increased body weight, although other metabolic parameters, such as HbA1c, showed no significant associations.
5.1. Conclusions
This study underscores the significant role of lncRNA HOTAIR in the pathophysiology of T2DM. The elevated levels of HOTAIR observed in T2DM patients compared to healthy controls highlight its potential as a biomarker for the disease. Furthermore, the protective effect of the rs12826786 C allele against T2DM emphasizes the contribution of genetic factors to diabetes risk. The observed association between the rs12826786 genotype and BMI suggests a potential link to metabolic health, though further research is required to investigate the broader implications of HOTAIR polymorphisms in diverse populations. These findings advocate for more extensive studies to validate HOTAIR as a diagnostic marker and to deepen our understanding of its role in T2DM.
