1. Background
Type 2 diabetes and obesity are related to other metabolic disorders such as insulin resistance, high blood pressure, visceral obesity increase and metabolic syndrome with high danger of cardiovascular disease expansion (1). In this regard, a regular exercise program with proper intensity and time as well as an ideal diet can reduce metabolic disorders related to type 2 diabetes and also reduces the weight and improving insulin sensitivity (2). However, changes in fat and carbohydrate metabolism in skeletal muscles in obese and patients with type 2 diabetes are important. Previous studies have shown that fat oxidation and absorption in type 2 diabetic patients’ skeletal muscles has decreased in post-absorptive state (3) and during β-adrenergic stimulation (3, 4). Schenk et al. (2007) revealed that fat oxidation induced from physical exercise improves fatty acids induced insulin sensitivity disorders (5). Fat and carbohydrates are main sources to use during rest and physical activity which may change their contribution in providing energy considering the time and intensity of that physical activity, previous fitness, ingredients used in the days before activity, muscle glycogen, exercise and environmental conditions (6). Meanwhile, the intensity and duration of exercise is always one of the main factors in fat and carbohydrates oxidation (6, 7). Changes in the substrate take place with increasing exercise intensity. Different intensities of exercise have different effects on the fuel (6, 8). The amount of energy is related to the intensity and duration of activity (9). Generally, the duration and intensity of exercise required to produce a change in fat oxidation are not clear exactly (7). In spite of the fact that the fat utilization pattern among the healthy volunteers during physical activities has been properly investigated (10), little attention has been paid to study the fat utilization in type 2 diabetes during exercise. Kelly et al. (11, 12) demonstrated that obese individuals with type 2 diabetes show an increase in the whole-body fat and carbohydrate utilization as compared to the body fat-matched control individuals with moderate intensity exercise whereas the utilization of the plasma glucose increases and the muscle glycogen oxidation decreases. However, a study on lean individuals with type II diabetes showed an increase in the amount of carbohydrate while the exercise-induced fat oxidation decreased (13).
Moreover, patients with type 2 diabetes may observe a change in fat and carbohydrate oxidation and eventually their energy during physical exercise because of some special metabolic disorders (14). These changes have an effect on energy balance and metabolism of these kinds of patients.
No research has been done so far comparing the effects of moderate and high intensities of acute exercise on substrate oxidation and energy expenditure of male patients with type 2 diabetes. Therefore, the current study aimed to determine whether substrate oxidation and energy expenditure would be influenced by moderate- and high- intensity aerobic exercise in patients with type 2 diabetes.
2. Objectives
This study aimed to determine whether in patients with type 2 diabetes, substrate oxidation and energy expenditure were affected by the type of intensity of acute aerobic exercise they were provided.
3. Materials and Methods
The present study was performed on 9 male subjects with type 2 diabetes and 9 male obese control subjects. All the diabetic individuals followed a normal diet. Except for their diabetes, the considered subjects had no other serious health problems. Moreover, the subjects were withheld from the blood glucose-lowering medication for two days before the conduction of the experiment. Subject characteristics are indicated in Table 1. It should be noted that the related protocol was in compliance with the medical ethical review committee and the subjects gave a written informed consent.
| Physical Properties | Obese Subjects | Subjects With Type 2 Diabetes |
|---|---|---|
| Number | 9 | 9 |
| Age, y | 49.1 ± 1.4 | 52.6 ± 0.36 |
| Height, m | 173.8 ± 5.3 | 171.3 ± 6.7 |
| Weight, kg | 93.7 ± 4.3 | 88.5 ± 4.7 |
| BMI, kg/m2 | 31.3 ± 1.8 | 30.3 ± 2.4 |
| Body fat, % | 31.2 ± 1.3 | 29.4 ± 2.09 |
| VO2 peak, L/min | 2.8 ± 1.68 | 2.4 ± 0.36 |
| VO2 peak, mL/kg/min | 41.3 ± 1.0 | 34.6 ± 3.93 |
a Abbreviation: BMI, body mass index.
3.1. Experimental Design
After determination of body composition and maximal aerobic power on a separate occasion, all subjects participated after fasting for at least 12 hours in a crossover design with participation in three supervised exercise sessions per week, 30 minutes at 60% of whole body peak oxygen uptake VO2 peak (moderate intensity) and 80% of VO2 peak (high intensity) the subjects were exposed to treadmill running test during two sessions with 1 week in between.
3.2. Body Composition
Subjects’ body compositions were measured using the bioelectric impedance method (Olympia 3.3, Jawn, Korean, 2000)
3.3. Maximal Aerobic Capacity
Before the measurements of maximal oxygen uptake (VO2 peak), subjects were informed about the test and instructed to exercise to their maximum limit. Familiarization with the treadmill (h/p/cosmos, Saturn, Germany), the warm up, and the VO2 max ramp procedure have been described in detail. Then VO2 peak was measured by the Bruce modified test (15).
3.4. Determination of Substrate Oxidation and Energy Expenditure
Breath-by-breath measurements were taken throughout the exercise using an automated gas-analysis system (GANSHORN, Germany). The gas analyzers were calibrated with a 4.95% CO2 -95.05% N2 gas mixture (BOC Gases, Surrey, UK), and the volume transducer was calibrated with a 1-liter calibration syringe (GANSHORN, Germany). Heart rate was recorded continuously by telemetry using a heart-rate monitor (Polar Vantage NV, Polar Electro Oy, Kempele, Finland).
Means of VO2 and VCO2 were calculated during each 30-minute protocol. With this method, the expired air was sampled for 1 minute at the 3, 10, 20 and 30 minutes time-points of each session to determine the rate of fat and carbohydrate oxidation across the duration of each constant load test. Then the amount of fat and carbohydrate oxidation was calculated using the following stoichiometric equation (16), and the amount of energy expenditure was calculated during each 30-minute protocol by equation of “Volpe and Bar-Or” (17). Assuming that the urinary nitrogen excretion rate was negligible.
Fat oxidation = 1.67 VO2 - 1.67 VCO2, carbohydrate oxidation = 4.55 VCO2 - 3.21 VO2, energy expenditure = 4.184 VO2. (1.23 RER + 3.815), where VO2 and VCO2 are reported as l minutes-1 and oxidation rate as g minutes-1, where energy expenditure is reported as k.j minutes-1. Energy expenditure was measured in kilo joules, but the data were reported in terms of calories.
3.5. Statistical Analysis
First, the normality of the data and the homoscedasticity were checked. The sphericity assumption was also tested using the Mauchly’s sphericity test. (Fat oxidation: Mauchly’s W = 0.63, P = 0.84 and carbohydrate oxidation: Mauchly’s W = 0.98, P = 0.92 and energy expenditure: Mauchly’s W = 0.89, P = 0.57). The data showed that the normality and sphericity were not violated; thus, parametrical statistical tests could be used. Fat oxidation, carbohydrate oxidation and energy expenditure were analyzed in a 2 (group) x (the crosshairs) 2 (intensity) analysis of variance (ANOVA) with repeated measures on the second factor. Also, independent t-test was used to compare two groups in different intensity and dependent variables. Statistical significance was set at P < 0.05.
4. Results
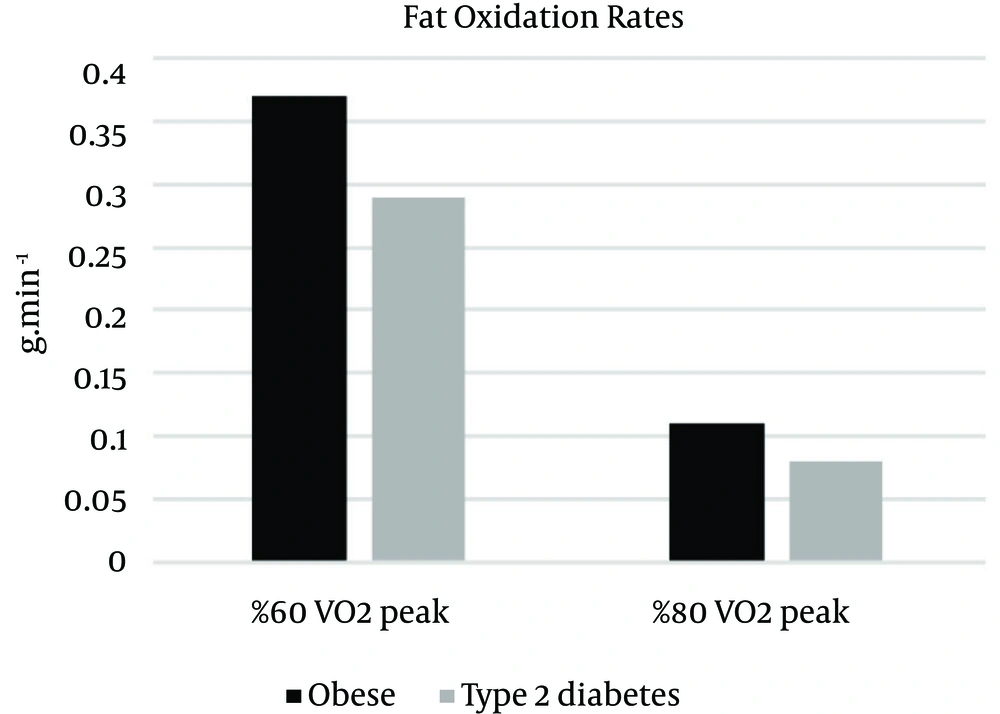
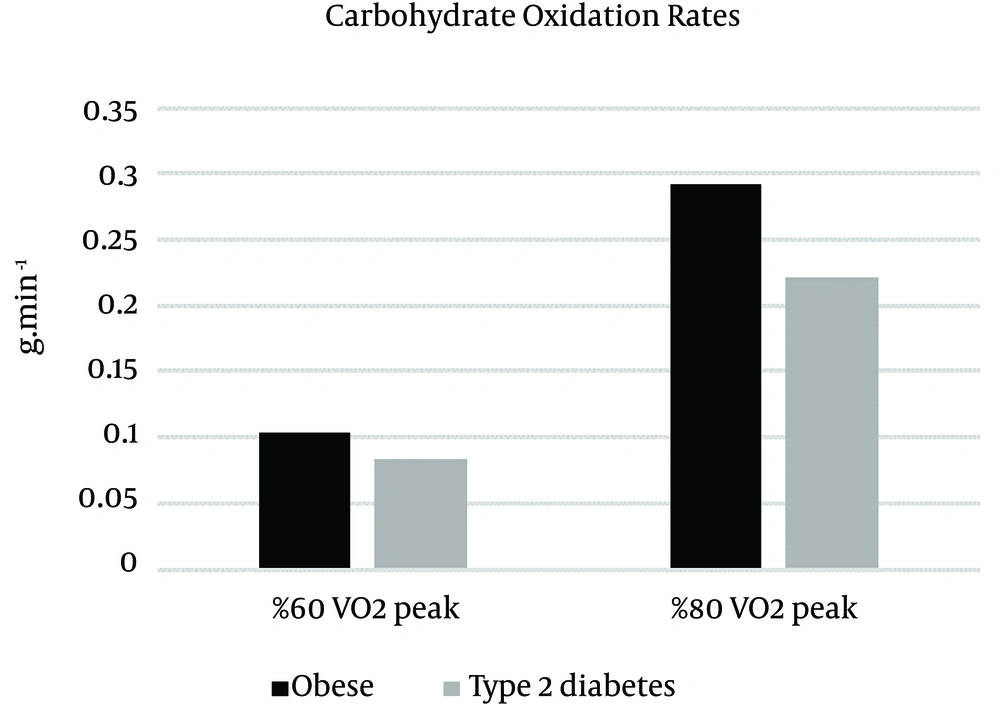
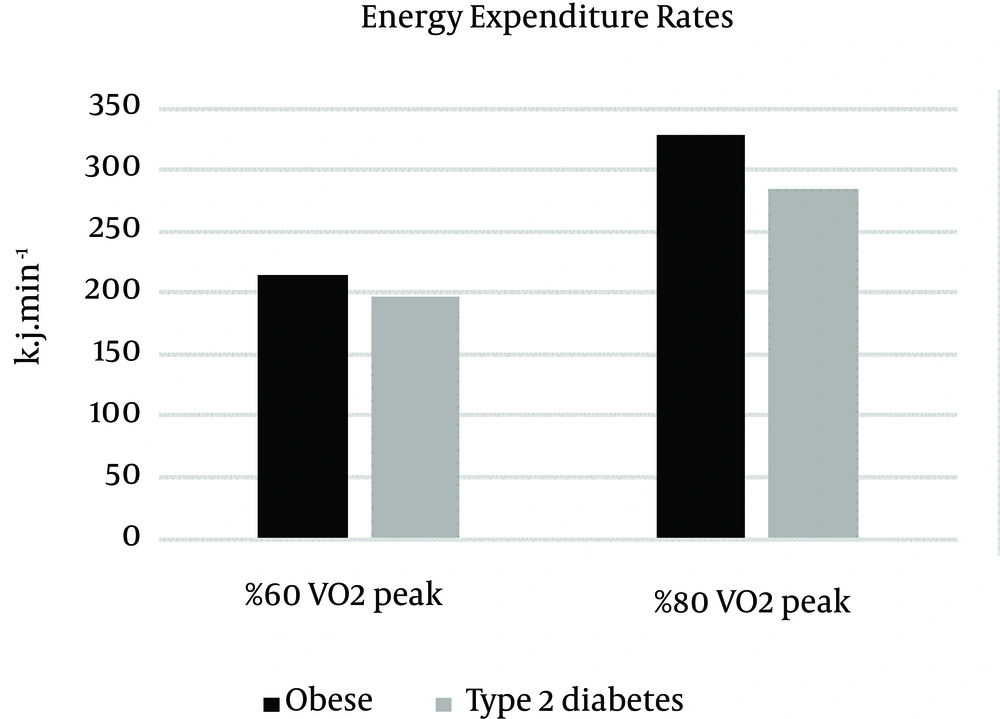
Means (±SD) of fat oxidation, carbohydrate oxidation and energy expenditure measures in different intensity for obese and type 2 diabetic individuals are listed in Table 2.
| Group/ Intensity | Fat Oxidation, g/min | Carbohydrate Oxidation, g/min | Energy Expenditure, kg/min |
|---|---|---|---|
| Obese | |||
| 60% VO2 peak | 0.37 ± 0.06 | 1.04 ± 0.28 | 213.96 ± 22.08 |
| 80% VO2 peak | 0.11 ± 0.02 | 2.93 ± 0.51 | 329.14 ± 50.02 |
| Type 2 diabetes | |||
| 60% VO2 peak | 0.29 ± 0.03 | 0.84 ± 0.28 | 197.34 ± 16.28 |
| 80% VO2 peak | 0.08 ± 0.02 | 2.22 ± 0.56 | 284.99 ± 31.43 |
4.1. Fat Oxidation
Fat oxidation was analyzed using a 2 X 2 (group X intensity) ANOVA with repeated measures on the second factor. This analysis indicated a significant main effect for groups, F (1, 16) = 5.16, p = 0.037, η2 = 0.244. The intensity main effect was also significant, F (16) = 75.60, p = 0.000, η2 = 0.825. Independent t-test was indicated that there was a significant difference between groups in fat oxidation in 60% intensity, t (16) = 3.36, P = 0.004, η2 = 0.41, and the fat oxidation rate was significantly superior in the obese individuals (M = 0.37, SD = 0.06) than the type 2 diabetic individuals (M = 0.29, SD = 0.03), but there was no significant difference between groups in fat oxidation in 80% intensity, t (16) = 0.69, P = 0.495, η2 = 0.03. The interaction of group X intensity was not significant, F (1, 16) = 0.881, P = 0.362, η2 = 0.052 (Figure 1).
4.2. Carbohydrate Oxidation
A two-way repeated-measure of variance on the intensity factor indicated that there were significant differences between groups (F (1, 16) = 7.85, P = 0.013, η2 = 0.329) and intensity (F (1, 16) = 172.21, P = 0.000, η2 = 0.915). The carbohydrate oxidation rate was higher during 80% intensity in obese individuals (M = 2.93, SD = 0.51) compared to individuals with type 2 diabetes (M = 2.22, SD = 0.56) (t (16) = 2.77, P = 0.014, η2 = 0.325), but during 60% intensity was not significant (t (16) = 1.48, P = 0.156, η2 = 0.122). The interaction of group x intensity was not significant F (1, 16) = 4.23, P = 0.056, η2 = 0.209 (Figure 2).
4.3. Energy Expenditure
There was a significant difference between groups (F (16) = 4.84, P = 0.043, η2 = 0.232) and intensity (F (1, 16) = 228.61, P = 0.000, η2 = 0.935) in energy expenditure rate. The energy expenditure rate was higher during 80% intensity in obese individuals (M = 329.14, SD = 50.02) compared to those with type 2 diabetes (M = 284.99, SD = 31.43) (t (16) = 2.24, P = 0.039, η2 = 0.239), but during 60% intensity was not significant (t (16) = 1.81, P = 0.088, η2 = 0.171). The interaction of group × intensity was not significant F (1, 16) = 4.21, P = 0.057, η2 = 0.208 (Figure 3).
5. Discussion
The results of the present study showed that the rate of fat oxidation in moderate intensity (60% vo2peak) compared to high intensity (80% Vo2peak) in type 2 male diabetic patients and the control group have been higher as well as the rate of carbohydrate oxidation of energy expenditure in high intensity compared to moderate intensity in type 2 male diabetic patients and the control group have been higher. Previous studies revealed that the absolute rate of carbohydrate oxidation has a positive correlation with the physical activity, while the fatty acid oxidation in healthy subjects has increased from resting state to almost 60% VO2max then gradually decreased to reach VO2max (18). Absolute and relative contributions of these fuels can be affected by nutrition, muscle glycogen content, exercise intensity, time and status (6).
The use of substrates can be rationalized by their availability. As it has been shown in healthy subjects, the increase of availability of blood sugar causes the increase of carbohydrate oxidation compared to fat oxidation (19) as well as the fat availability causes the increase of fat compared to carbohydrate (19).
Since fat is the main fuel in low and moderate intensities, the high rate of fat oxidation in moderate intensity compared to high intensity in type 2 diabetic patients in the present study can be explained (6, 7, 18, 20, 21); this is the same in carbohydrate oxidation in high intensity of physical activity. Also, because the time of activity was similar in both, the energy expenditure is higher considering the fact that material metabolism is higher in high rates (9, 22).
However, in moderate rate activities, the lipolysis speed triples because of the increase of beta-adrenergic stimulation (epinephrine) and decrease of insulin (23). Also, Re-esterified for example, the Re-Esterified triglycerides decreases (24) and the amount of adipose tissue blood flow increases which eventually causes the increase of the availability of fatty acids in plasma (23). Parallel to this study, Schenk et al. (2007) have shown that the fat oxidation of the physical activity improves the disorders of fatty acid-induced insulin sensitivity (5).
Since the high rate of available systematic fatty acids absorbed by skeletal muscle acts as a key mediator for insulin resistance in obesity and diabetes (25-27). Also, resistance to insulin induced by fatty acids is largely determined by extra fatty acid detachment in muscle cells for intracellular fatty acid metabolites’ saving, oxidation or aggregation (27-29). Resistance to insulin induced of fat increase in diabetic patients can decrease by such a physical activity in which fat oxidation occurs in a high rate (5, 30, 31).
Previous studies have shown that the fat oxidation increase due to physical activity (32) can improve insulin sensitivity (29, 33). Moderate physical activity causes pyruvate dehydrogenase activity’s decrease which increases fat oxidation (34). Recent researches have revealed that low capacity of fat oxidation may be the main reason for increase of insulin resistance (35, 36). Generally, the results of this study showed that moderate physical activity causes an increase in the rate of fat oxidation in patients with type 2 diabetes, which decreases insulin resistance.
The other results of this study showed that the rate of fat and carbohydrate oxidation and energy expenditure in moderate and high intensities in patients with type 2 diabetes is lower than the control group (fat subjects). However, the rate of carbohydrate oxidation and energy expenditure in moderate intensity between the two groups showed no significant difference. The results of this study are partly similar to those of Ghanassia et al. (2006) (37).
Some of the previous studies have not observed any significant difference between diabetic subjects and obese subject in substrate oxidation rate, which differ from the results of this study (38-40). The reason of this difference can be related to the type of exercise protocol and its intensity. It should be mentioned that the previous studies had different subjects in case of age, gender and weight.
Muscle contraction and the production of catecholamines are those mechanisms that cause metabolic adaptation during physical activity (41). These mechanisms cause decrease in insulin secretion and increase in glucagon production via afferent which enhances the available energy substrates by EPG increase and glucose absorption.
Meanwhile lipolysis in adipose tissue of insulin-induced decreases (42, 43). Impaired insulin secretion and glucose specific to type 2 diabetes can affect the use of substrate during physical activity (44).
Considering metabolic disorders in patients with type 2 diabetes (14) and the equality of all the subjects of this study in terms of age, gender and weight, the decrease of the fat and carbohydrate oxidation and energy expenditure in moderate and high intensity in patients with type 2 diabetes compared to the control group can be related to diabetic metabolic disorders (37). Metabolic disorders can reduce substrate consumption in patients with type 2 diabetes compared to healthy subjects. Small sample size was one of the limitations of this study. In the present study it should be noted that due to the considered criteria for inclusion of the tested in this experiment (a given age limit, blood sugar limit, duration of diabetes, lack of cardiovascular diseases, lack of muscular diseases, etc.), it was not possible to select a wide range of samples in terms of the above-mentioned criteria used in the this study. It has been suggested to do the same study with a larger sample sizes.
Generally, with control of type 2 diabetic patients’ blood sugar, some of the neuropathic and micro angiopathic effects may be prevented which causes the reduction of some cardiovascular diseases in such patients. Also, obesity can cause some metabolic disorders such as poor glucose tolerance and cardiovascular disease in patients with type 2 diabetes. Therefore, physical activity with proper intensity and time may be considered as an adjunctive treatment to prevent these effects and disorders.


