1. Background
Cardiovascular diseases in developed countries are the most important factor leading to death. In Iran, nearly 50% of all annual deaths are due to cardiovascular diseases (1). Echocardiography demonstrates that cardiac dimensions, the volumes of the left ventricle, and ejection fraction are strongly associated with the progress of heart disease (2). In the majority of cardiovascular diseases, vascular structure is changed in line with the type of disease. This structural change leads to a functional change. After vascular dysfunction, which appears in the form of stiffness or vasoconstriction, blood flow of some organs involved in the homeostasis of blood pressure such as the kidneys is reduced. Accordingly, in response to the decreased blood flow to the organs, they secrete some their vasoconstriction enzymes (3).
In addition, it has been reported that in some injured vascular areas, the vasoconstriction enzymes are produced. The changed secretion of enzymes involved in blood pressure homeostasis causes hypertension, extra load on the cardiac performance, and finally the cardiac hypertrophy. Cardiac hypertrophy in various cardiovascular diseases is an important issue that can have deleterious effects on the cardiovascular system performance. Nowadays, cardiac rehabilitation as a therapeutic strategy has been added to the different heart health programs (4). Various studies have shown that participation in cardiac rehabilitation programs has beneficial effects for the CAD patients (5). In addition, Cardiac rehabilitation as a secondary prevention practice can reduce mortality of cardiovascular patients (6, 7). Cardiac rehabilitation includes a set of activities that are designed for improving lifestyle, nutritional program, and increased functional capacity of appendicular limbs and cardiovascular system. Cardiac rehabilitation has four steps. The third phase of the cardiac rehabilitation is the supervised exercise training in rehab centers available in hospitals. Usually at this stage, the continuous and interval aerobic training protocols are run using a tool such as stationary bike, treadmill, and hand ergometer (8). Some studies have shown that after cardiac rehabilitation of the left ventricular end-diastolic dimension (LVEDD), left ventricular end-systolic dimension (LVESD) and left ventricular mass (LVM) do not change (4, 9-11). Despite this, studies have shown that after regular participation in cardiac rehabilitation-based exercise trainings, some cardiac dimensions have had a significant reduction (12-14). In all of these studies, an aerobic protocol has been used, while by adding the controlled resistance part, best practice achievements can be obtained in the appendicular muscles and patients’ life quality can improve. On the other hand, by exploring the databases, we found no research that added the controlled resistance part to the routine exercises of rehabilitation. Therefore, according to the recipe of the American College of sports medicine’s (ACSM) and by complying with the safety and also avoiding Valsalva maneuver, we added a resistance part to the routine cardiac rehabilitation protocols in order to determine the effectiveness of these combined protocols as well as to compare the effect of the different rehabilitation protocols on the cardiac dimensions of Post-CABG patients.
2. Methods
2.1. Samples
Among the 35 to 60-year-old male patients undergoing CABG surgery in Imam Khomeini hospital of Ahvaz in the second half of 2015, 40 patients were selected using completely purposeful sampling method. For the unification of groups and homogenization of samples, inclusion criteria were lack of consumption of ACE inhibitor drugs, having nearly identical Peak VO2 and fat percentage, not having kidney disease, systolic blood pressure between 13 to 16 mm of mercury, taking the Losartan (AT1R inhibitor), and having three vessels implanted in the heart. Then, the samples randomly were divided in 4 groups: 1) aerobic continuous training (n = 10); 2) combined aerobic interval + resistance training (n = 10); 3) combined aerobic continuous + resistance training (n = 10); and 4) control group (n = 10).
2.2. How to Conduct Research
First, two-dimensional echocardiography and initial fasting blood samples were taken from all subjects in the different groups. All the blood samples were taken from the elbow vein in the volume of 5 cc. Then, the control group was asked to begin their training program with a two-month gap. The experimental groups (aerobic continuous training and combined groups (aerobic interval + resistance training) and (aerobic continuous+ resistance)) participated in the designed training program for eight weeks, three sessions per week. It is worth mentioning that all subjects in the experimental groups during the first week (3 sessions) were familiar with how to do the exercises, and their ability increased up to an initial extent. Then, based on the designed training protocols, subjects in the different groups participated in 21 remaining training sessions. The duration of each training session was from 40 to 60 minutes. During each training session and the subsequent recovery time, changes in ECG were monitored by single-lead telemetry. In addition to the systolic and diastolic blood pressure before and after every training session, training was measured by a digital blood pressure measuring device (Mamiso Set model S1800). One day after the last training session, which coincided with the start of the training program of control group, echocardiography parameters of all subjects in different groups were measured again and then, the fasting blood was taken from all the samples. This study has been registered in research ethics committee of Ahvaz University of Medical Science: IR. AJUMS.REC.1394.446.
2.3. Training Protocol
In this study, three different protocols were used. The first protocol relevant to the aerobic continuous group was done using a bike and a treadmill with 50% to 85% of THR. In the second protocol relevant to the aerobic interval + resistance training group, the interval part was done with the intensity of 50% to 85% of THR using treadmills, and the resistance part was done using fitness equipment in the form of the Seated Leg Curl, wide grip pull down, seated bench press, and Larry biceps in the duplicated three sets of eight motions with the intensity of 40 to 60% of one repetition maximum (1RM). The third protocol was relevant to the aerobic continuous + resistance training group that its aerobic section was exactly similar to the training protocol of the first group and its resistance section was exactly similar to the protocol of the second group. All protocols of the three groups were conducted as pilot and isocaloric exercise on a six-person sample before running. In addition, these protocols were confirmed by a large number of sports scientists and cardiologists working in cardiac rehabilitation.
2.4. Statistical Methods
To analyze the normality of the data, Kolmogorov - Smirnov test was used, and to check the homogeneity of variances and determine the differences between the various research groups, Levene’s test and analysis of multivariate variance were used, respectively. If there were significant differences between various groups, to find the difference, Bonferroni post hoc test was used. All statistical analyses were done at a significance level of α = 0.05.
3. Results
Baseline characteristics of the study population are listed in Table 1.
| Characteristics | Control Group | AC Group | AC+R Group | AI+R Group | P Value |
|---|---|---|---|---|---|
| Number | 10 | 10 | 10 | 10 | NS |
| Age, y | 48.8 ± 8.03 | 49.1 ± 6.57 | 50.2 ± 7.84 | 52.6 ± 9.4 | NS |
| Height, cm | 170.7 ± 6.94 | 169.6 ± 4.22 | 172.5 ± 3.75 | 171.8 ± 3.8 | NS |
| Weight, Kg | 78.78 ± 6.94 | 81.7 ± 6.1 | 87.06 ± 5.47 | 82.7 ± 5.81 | NS |
| SBP at rest | 141.6 ± 4.29 | 140.4 ± 3.37 | 139.7 ± 2.95 | 142.5 ± 3.5 | NS |
| DBP at rest | 91.6 ± 6 | 90.9 ± 6 | 92.5 ± 4.7 | 94.9 ± 3.9 | NS |
Abbreviations: AC, Aerobic Continuous; AC + R, Aerobic Continuous + Resistance; AI + R, Aerobic Interval + Resistance; DBP, Diastolic Blood Pressure; SBP, Systolic Blood Pressure.
The data from this study show that there was no significant difference in the pre-test values of LVEDD, LVESD, LVPWT, LVM, and EF between the experimental and control groups (Table 2).
| Variables | Groups | Pretest | F | Sig | Post Test | F | Sig |
|---|---|---|---|---|---|---|---|
| LVEDD | Con | 52.1 ± 8.3 | 0.331 | NS | 52.5 ± 6.2 | 0.186 | NS |
| AC | 54.2 ± 6.4 | 51.9 ± 4.4 | |||||
| AI+R | 53.1 ± 5.76 | 51 ± 4.49 | |||||
| AC+R | 54.9 ± 6.31 | 51.4 ± 3.23 | |||||
| LVESD | Con | 34.4 ± 6.18 | 0.278 | NS | 35.1 ± 6.19 | 0.105 | NS |
| AC | 36.6 ± 5.5 | 36.4 ± 5.39 | |||||
| AI+R | 35.8 ± 5.24 | 35.3 ± 5.31 | |||||
| AC+R | 36.1 ± 5.64 | 35.7 ± 5.43 | |||||
| LVPWT D | Con | 10.61 ± 0.35 | 2.374 | NS | 10.78 ± 0.31 | 1.869 | ]NS |
| AC | 11.03 ± 0.43 | 10.47 ± 0.42 | |||||
| AI+R | 10.7 ± 0.38 | 10.53 ± 0.34 | |||||
| AC+R | 10.87 ± 0.34 | 10.7 ± 0.24 | |||||
| LVM | Con | 207.18 ± 58.1 | 0.806 | NS | 213. 3 ± 45.44 | 0.407 | NS |
| AC | 227.3 ± 53.05 | 203.3 ± 39.21 | |||||
| AI+R | 216.37 ± 45.7 | 198.3 ± 35.14 | |||||
| AC+R | 242.2 ± 54.8 | 214. 1 ± 31.77 | |||||
| EF | Con | 43.57 ± 2.12 | 1.561 | NS | 43.64 ± 2.06 | 2.374 | 0.001a |
| AC | 44.44 ± 2.76 | 48.73 ± 2.81 | |||||
| AI+R | 45.7 ± 2.43 | 51.34 ± 3.97 | |||||
| AC+R | 45.67 ± 3.04 | 53.28 ± 2.1 |
Abbreviations: EF, Ejection Fraction; LVEDd, Left Ventricular End Diastolic Dimension; LVESd, left Ventricular End Systolic Dimension; LVM, Left Ventricular Mass; LVPWT, Left Ventricular Posterior Wall Thickness Dimension.
aSignificant difference between pre and posttest values in the groups (P ≤ 0.05).
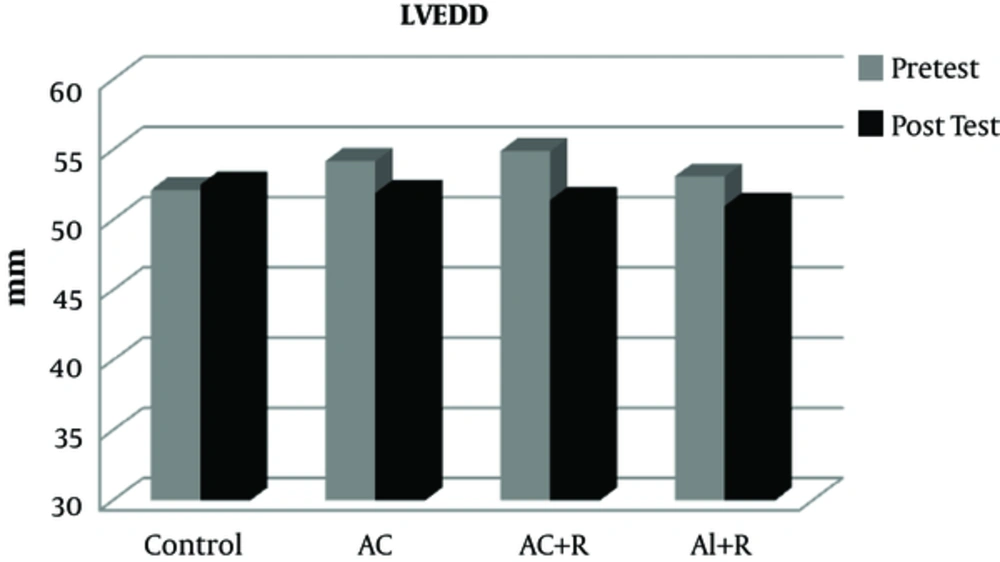
After applying eight weeks of various rehabilitation protocols, there was no significant difference in the variable LVEDD between the experimental and control groups (P = 0.705). However, in the three groups of aerobic continuous, aerobic continuous + resistance, and aerobic interval + resistance, LVEDD decreased in an extent of 4.43, 4.11, and 6.89%, respectively (Figure 1).
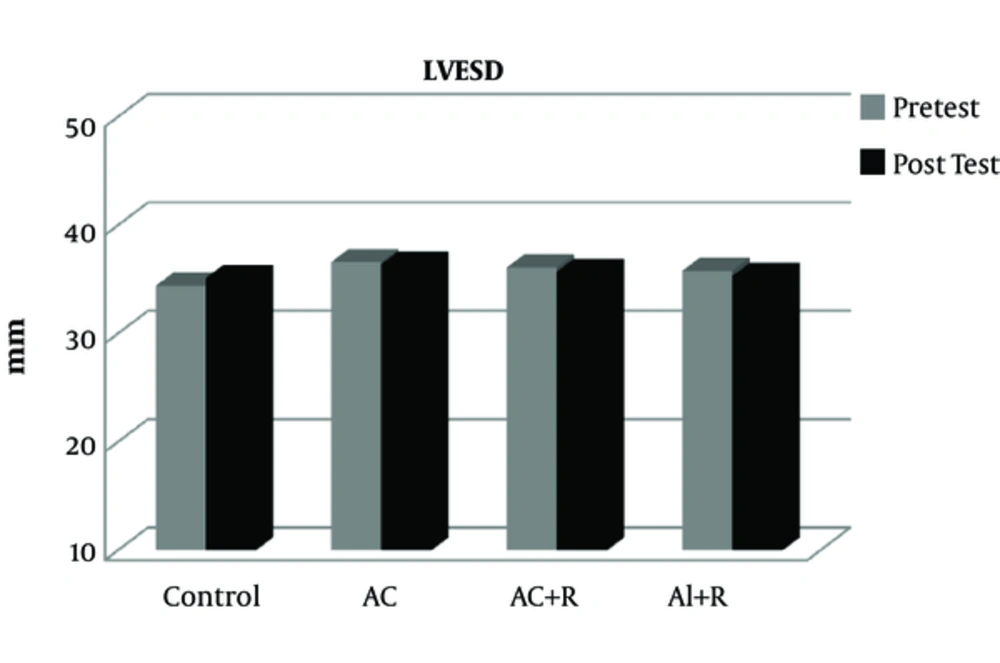
After participating in various rehabilitation programs, no significant difference was seen in LVESD values between the different groups (P = 0. 657). However, the variable LVESD in all the three groups of aerobic continuous, aerobic continuous + resistance, and aerobic interval + resistance have had a partial reduction of 0.5, 1.4, and 1.1%, respectively (Figure 2).
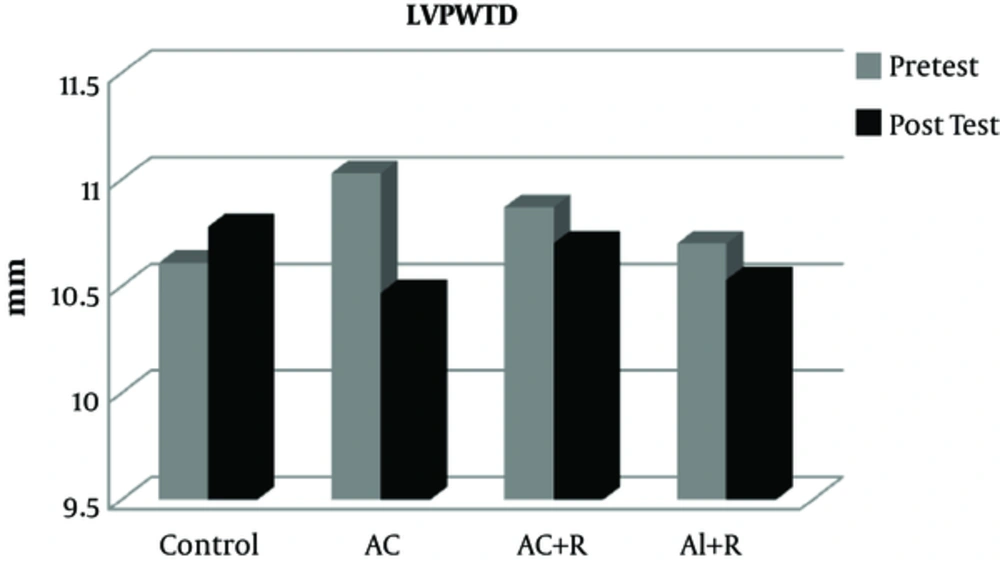
Furthermore, after participating in various rehabilitation programs, no significant difference was observed between the training and control groups in the variable LVPWTD (P = 0.152). However, in the aerobic continuous, aerobic continuous + resistance, and aerobic interval + resistance groups, LVPWTD have had a reduction of 5.3, 1.61, and 1.5%, respectively (Figure 3).
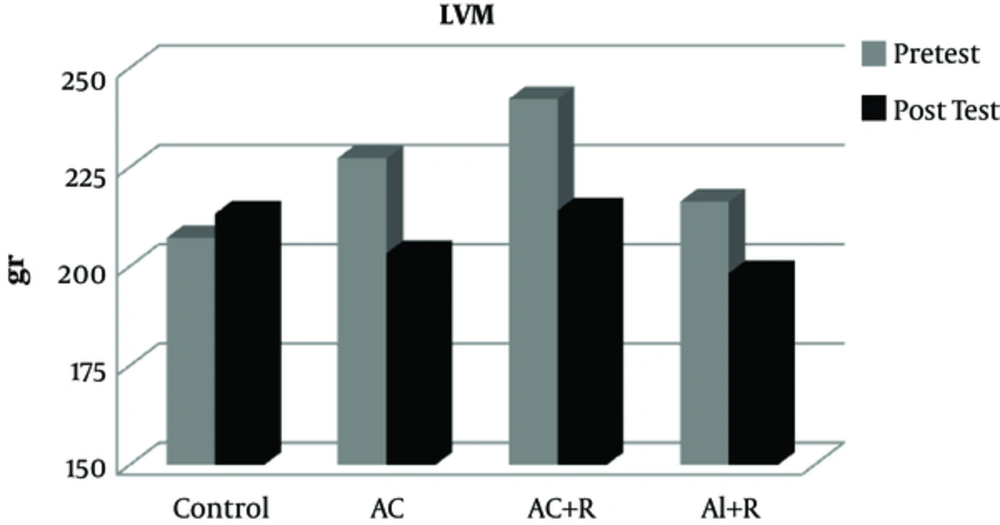
At end of training protocols, left ventricular mass (LVM) also did not show a significant difference in the control group (P = 0.749). However, in the aerobic continuous, aerobic continuous + resistance, and aerobic interval + resistance groups, this variable has had a reduction of 11.82, 9.07, and 13.13%, respectively (Figure 4).
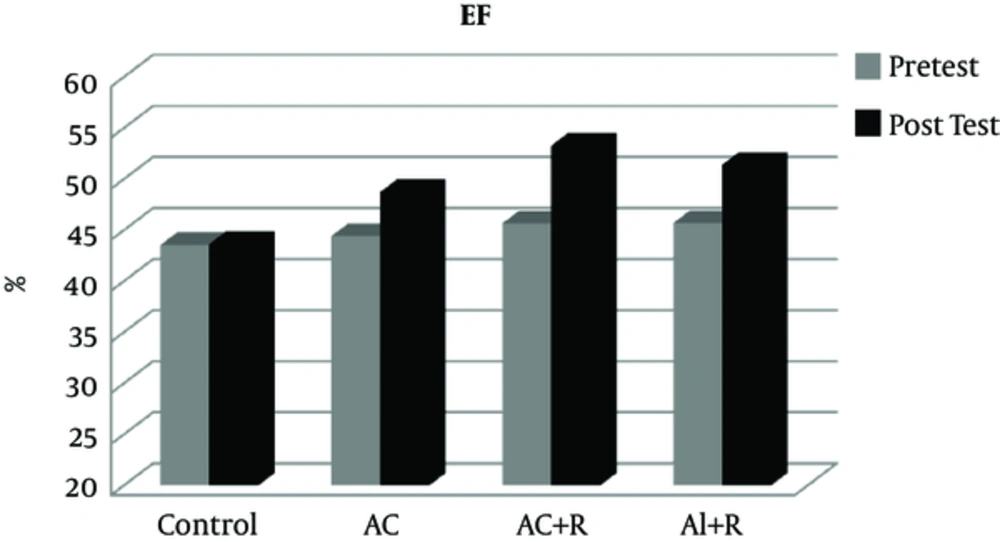
After applying various cardiac rehabilitation protocols, a significant difference was seen between the variable EF (P = 0.001) in the experimental groups compared to the control group. Accordingly, participation in cardiac rehabilitation programs caused significant increases in the values of the EF. Further scrutiny showed that there was a significant difference between the aerobic continuous training group (AC) and aerobic interval + resistance group (AI + R), as well (P = 0. 006). Ejection fraction has had an increase of 9.65, 12.34, and 16.66 in the aerobic continuous, aerobic continuous + resistance, and aerobic interval + resistance groups, respectively. Therefore, compared to other existing rehabilitation protocols in this study, the aerobic interval + resistance protocol caused a further increase in the ejection fraction values (Figure 5).
4. Discussion
Unfortunately, due to the industrial life and low mobility of people, coronary artery disease has had a rapid growth in the past few decades. The formation of atherosclerotic plaques, failure to use a proper diet, and lack of participation in sports activities have led to the increased number of surgeries such as angioplasty and CABG. In addition to severe changes in blood pressure homeostasis system, the CABG has many complications that cause poor performance in the overall ability of the patient’s organs due to the opened chest, manipulated pericardium, and removed vessel from the chest, arms, and legs. Therefore, in order to improve the overall physical functioning and strengthen the cardiovascular system, participation of Post-CABG patients in cardiac rehabilitation-based exercise training is essential. Exercises that are run based on cardiac rehabilitation are mainly in the form of aerobic protocols that are run by hand ergometer, treadmill, and stationary bike. In these protocols, due to the increased return of venous blood, the volume overload (increased preload) can be entered the heart (8). In our study for the first time, resistance section has been added to the Cardiac Rehab protocols. Thus, the effect of the supervised combined training and aerobic training has been compared. The results of the present study show that various rehabilitation exercises did not have significant effects on cardiac dimensions. These results are consistent with the findings of the research by Soleimannejad (11), Basati (9), Kim (15), and Sadeghi (4), but they are inconsistent with the findings of a study by Schmid (14). In our research, the duration of the implementation of the protocols was two months, while in the study of Schmid the duration of the participation in the rehab programs was 9 months. It seems that the duration of the implementation of the exercise in our research was not enough to make the structural changes. Cardiac hypertrophy is usually eccentric, concentric, or a combination of both. In a state of the eccentric hypertrophy, the volume overload on the heart caused by increased venous return and increased preload could lead to an increase in the length of the cardiac myocytes and this stretch causes better interaction between the myosin heads and actin’s active sites. Therefore, the heart beats with a more contractile power. However, the existence of the pericardium prevents too much stretch and elongation of myocardial fibers; in some pathological conditions, cardiac muscle fibers are elongated extremely and as a result, interactions between actin and myosin strongly reduce. Severe eccentric hypertrophy disease, as what occurs in the dilated cardiomyopathy, leads to reduced EF and heart failure (16). Another type of cardiac hypertrophy is concentric hypertrophy. In this hypertrophy, the left ventricular wall and the interventricular septum are thick due to increased afterload or pressure overload. Therefore, the increased load can be because of hypertension, diabetes mellitus aortic valve stenosis, and so on. Therefore, continuously increased load causes the left ventricular hypertrophy. In the passing of time, by the longitudinal and transverse increasing in cardiac myocytes and simultaneously with thickening of the interventricular septum and the left ventricle, the left ventricular cavity decreases and then diastolic and systolic dysfunction occur (17-19). Studies have shown that damaged vascular produces the Ang II and ET-1 (20). Ang II and ET-1 cause hypertrophy in the myocardium and the vascular smooth muscle (21, 22). In some diseases such as hypertension, CAD, aortic valve stenosis and diabetes, cardiac hypertrophy occurs. In these diseases due to the increased Ang II and ET-1, some inflammatory cytokines like TNF-α, IL-1 and cardiac troponin (CT-1), the growth of the cardiac myocytes changes (23). For example, the CT-1 causes the induction of cardiac hypertrophy. This type of hypertrophy is a kind of the cardiac myocytes elongation and it is accompanied by a minimum transverse thickness of the cardiac myofibrils. Moreover, overload exerted on the myocardial cells in some patients with aortic stenosis after myocardial infarction can create a rapid induction of some genes such as c-fos, c-jun, c-myc, and egr-1 by creating tension in the cardiac myocytes (24). The stretch of myocytes causes an upregulation of gene such as atrial natriuretic peptide (ANP), beta-myosin heavy chain, and alpha-actin (25, 26). Moreover, exercise training by a combination of the effects on mechanosensors and intracellular signaling pathways causes induction of the adaptive hypertrophy (27, 28). Most of the effects of exercise are applied on the myocardial structure through the mechanosensors. Mechanosensors in the myocardial cells are activated in three ways.
First, the stress and stretch are received by the integrin existing in the cell surface; then, they are transferred into the membrane eventually leading to the launch of the downstream signaling pathways and biochemical pathways. Integrins can activate focal adhesion kinase (FAK) and facilitate signal transduction in mitogen-activated and stress-activated protein kinase pathways (29).
Second, mechanosensing principle is the activation of nonreceptor tyrosine kinases (such as the Src family) by stretch-induced conformational changes. This is one of the earliest responses to stress activation of cardiac myocytes; downstream tyrosine phosphorylation of cellular signaling proteins occurs within 5 seconds of stretching of cell membrane by hypotonic swelling. Tyrosine kinases induce immediate early genes (e.g., c-fos) independently from the angiotensin receptors and activation of phospholipase C and protein kinase C (30).
Third, a stretch of cardiac myocytes causes the activation of ion channels that induce increased Ca2+ influx, which may in turn activate downstream pathways and serve as an intracellular signal of hypertrophy and gene regulation (31). In addition, stretch of cardiac myocytes increases the concentration of Ang II and ET-1 in the conditioning medium and stimulates protein synthesis and gene expression associated with mitogen-activated protein Kinase activity (32). Contractile activity increases the secretion of growth factors. Chi et al. have shown that electrical stimulation of the cardiac myocytes leads to the secretion of basic fibroblast growth factor (FGF-2). With the secretion of FGF-2, the response of hypertrophy can be induced by increased Phenylalanine uptake, increased protein content, and increased length of the myocardial cells (33). It seems that doing regular exercise training by balancing the amount of enzymes and factors of hypertrophy and anti-hypertrophy and improving homeostasis of these enzymes can favorably reverse the increased longitudinal and cross-section of changes in the cardiac myocytes. However, to achieve these results, further research is needed.
The results on the variable EF showed that different protocols of cardiac rehabilitation cause a significant increase in EF. The results of the research are consistent with the findings of studies conducted by Soleimannejad (11), Ghashghaei (10), Bahremand (34), Sadeghi (4), Basati (9), Schmid (14), and Kim (15). Ejection fraction shows the index of cardiac contractility that is obtained by dividing the stroke volume by the end-diastolic volume (EDV). This index shows how much of blood entering the ventricles is exited from it during a contraction. Ejection fraction is usually expressed in terms of percentage, on average, in the healthy people while the rest time is 60%. The heart, like other skeletal muscles, in line with the workload exerted, reveals neuromuscular adaptations. Therefore, the increased heart contractile strength following a cardiac rehabilitation exercise period in people who their EF has been dropped is not far from what is expected. Many factors affect the EF. Of these, it can be pointed out to the venous return. During exercise training, blood available in the appendicular muscles in the contractile processes is pressed and injected into the blood circulation venous system by the muscle pump caused by the regular cycle contractions. With an increase in the blood returned to the heart, the heart is partly capacitated and the capacity will be along with the elongation of myocytes. According to the law of Frank-Starling, elongation of myocytes due to ventricular filling causes the heart to beat with a stronger contraction to meet the needs of the body. Therefore, the outcome of these adaptations is increased EF in the rest mode. It is also reported that susceptibility of myocardial cells to calcium in inactive people or patients with cardiac functional disorder reduces. This reduction is associated with downregulation of hydroxypyridine and ryanodine receptors as well as myocardial sarco/endoplasmic reticulum Ca2+ ATPase pumps (SERCA) (35). After sporting activities based on Cardiac Rehab, these recipients are upregulated and thus, the susceptibility of the myocardial cells to calcium will increase; so, heart contractility power increases with each hit compared to before rehab program. It seems that the continuation of these trainings through the creation of adaptive exercise-induced hypertrophy increases the ejection fraction. Therefore, the significant difference of interval-resistance trainings with continuous and routine trainings of rehabilitation may be due to the cumulative effect of volume overload (increased preload) and pressure overload (increased afterload).
4.1. Conclusion
Although adding a resistance part to the routine cardiac rehabilitation exercises does not have a significant effect on the cardiac structure of patients with diastolic functional disorder, it can be more effective in the heart performance. Therefore, the researchers suggest that resistance part training to be added to cardiac rehabilitation programs for patients with low levels of injection fraction.

