1. Background
Rural waste has negative impact on animal species and their habitats (1, 2). These wastes cause a huge disturbance in the onshore and aquatic ecosystems of animals (3). The main cause of pollution caused by rural waste for wildlife is lack of waste management system in rural areas (4). The negative effects of waste on wildlife habitats can be reduced with proper management (5). The lack of rural waste management has adverse consequences on wildlife in the areas near the villages (6, 7). Several studies have found that incomplete disposal of wastes in the natural areas affects all animals (2, 6, 7). Some studies also indicated that some of the environmental problems caused by waste on animal habitats are soil pollution, water pollution, disease and death of wildlife (8). Ye and Qin evaluated the status of rural waste management in China. The results showed that wastes have negative impacts on the local environment and decrease the quality of wildlife habitat (9). Apostol and Mihai assessed the challenges of rural waste management in the local environment in Romania. Their study showed dysfunctions of traditional waste management system in rural areas and their implications on animals and birds (10). Taghipour et al. investigated the quantity and quality (composition) of solid waste of rural communities in the northwest of Iran. According to the results of this study, it could be concluded that rural communities have more effect on natural areas (11). Wang et al., by drawing on field data from a survey of 100 villages from five provinces across China, studied solid waste of rural areas. The results showed that 61% of the sampled villages had negatively significant effects on natural areas (12). Anwar et al. evaluated solid waste in rural villages of Egypt. The results showed that increasing volume of waste causes the impacts of wastes on animal species. In this study, suitable waste disposal sites were identified in regions far from the protected area (13). Asgari et al. determined the quality (composition) of solid waste of rural communities in Tehran and Alborz provinces. The results showed that the highest waste generation rate was in spring, and it coincided with the activity of animal species near the villages (14). Przydatek and Gancarczyk assessed solid waste accumulation in rural areas of European Union. The results indicated that there is a fundamental difference between the number of wildlife and the amount of waste generated (15). Kadam and Sarawade studied the role of public participation for waste reduction in order to rural development. The results showed that the high generation of rural solid waste is a serious problem for wildlife. It created a challenge for rural solid waste management. Waste creates huge problems in wildlife habitats, i.e., air pollution, water pollution, and soil pollution (16). Therefore, assessing solid waste for the rural regions is necessary to prevent the above-mentioned impacts on animals and their habitats and reduce environmental losses. Also, access to reliable tools for quantifying and measuring waste is essential. There are also many methods for environmental impacts assessment using decision-making models in order to rank the best or the worst option (17-22). The Technique for Order of Preference by Similarity to Ideal Solution (TOPSIS) method is one of the multi-criteria decision-making (MADM) methods that rank options (23-27). In the TOPSIS method, qualitative criteria can be easily quantified, and decision-making is possible with quantitative and qualitative criteria (28). The output of the technique is quantitative, and in addition to determining the best option, the ranking of the other options is numerically expressed (29). Therefore, the main purpose of the present study was using TOPSIS in combination of fuzzy for assessment of the wild mammals status affected by human wastes in rural areas in the east of Lorestan province.
2. Objectives
The aim of this study was the assessment of the wild mammals status affected by human wastes using fuzzy TOPSIS in villages of the Oshtorankooh protected area of Lorestan province in 2019.
3. Methods
3.1. Case Study
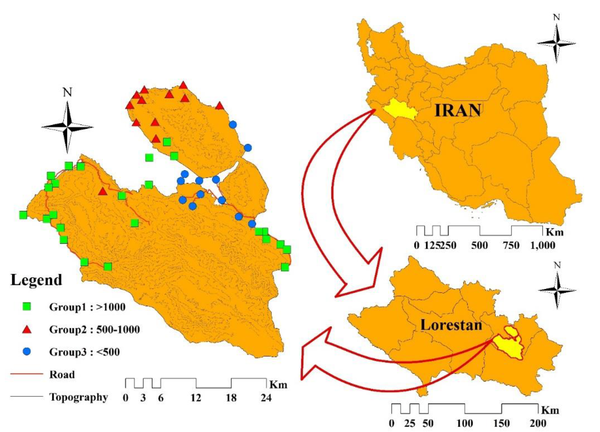
This study was carried out in 42 villages of Oshtorankooh protected area of Lorestan province in 2019. The study area is located in the east of Lorestan province, bordering the area of Azna, Droud, and Aligudarz. The area is located at 33°18′27′′ N latitude and 49°16′54′′ E longitude (Figure 1). It has an area of 106,693.5 ha. This area has an altitude of 1,300 to 4,080 m, an average annual temperature of 4 to 12°C and the average annual precipitation of 500 to 900 mm. Fauna and flora biodiversity of the area is very high, and 600 plant species and 274 animal species have been identified in the area (30). Residential land uses are one of the management problems in the area.
3.2. Method
In this study, the TOPSIS method, in combination with FAHP, was used to evaluate the effects of rural waste on animal species. The dominant mammals were identified by environmental experts and reports of the department of the environment. Important mammals of the area include Vulpes vulpes (S1), Felis silvestris (S2), Ovis orientalis (S3), Capra aegagrus (S4), Hystirix indica (S5), Panthera pardus (S6), Canis lupus (S7), Ursus arctos (S8), and Hyaena hyaena (S9). The target villages were categorized into three groups (group 1 (G1), group 2 (G2), group 3 (G3)) according to population, plan of waste management, easy access and the possibility of monitoring in the research. The research process is as follows:
3.2.1. The Process of Physical Analysis of Solid Waste
In this study, rural wastes were measured by the SOEHNLE scale (model: 6107, precision: 0.1 kg) (11, 13) on 3 days in the middle decade of the second month of each season. Total solid wastes of each village were divided on population, then the solid waste generation rates were obtained. All wastes were mixed to determine the density of the waste. In the step, sampling was performed with 3 repetitions (11). Sampling was completely randomized at 150 kg and the samples were transported in a cylindrical plastic container (volume: 1.2 m3) (15). Finally, waste weight was calculated in a cubic meter. To identify the components of the wastes (degradable material (C1), plastic and rubber (C2), wood and paper (C3), metals (C4), glass (C5), textiles (C6), and others (C7)), each component (1.5 m3 container) was transported into a special plastic container and weighed by the SOEHNLE scale (13). In this operation, the weight of the components was calculated in percentage.
3.2.2. The Process of Impacts Assessment
The TOPSIS method was used to rank and determine the significance of effects to assess the effects of waste on animals. The Technique for Order of Preference by Similarity to Ideal Solution (TOPSIS) is a multi-criteria decision making (MCDM) model, which is according to the mean that the chosen alternative must have the shortest distance from the positive ideal solution and the longest distance from the negative ideal solution (23). The TOPSIS process was carried out as follows (23, 24):
Step 1: In the step, an evaluation matrix is created. The decision matrix contains a set of criteria and alternatives (24). The criteria (wastes) are in columns, and the alternatives (species) are in rows. Every matrix cell evaluates every alternative against every criterion {\displaystyle s_{iw}\,\,(i=1,2,\ldots ,m).}.
Step 2: The normalization of the evaluation matrix is carried out by Equation 1 (25):
Where xij and rij are the initial scores of the evaluation matrix and the normalization of the evaluation matrix, respectively.
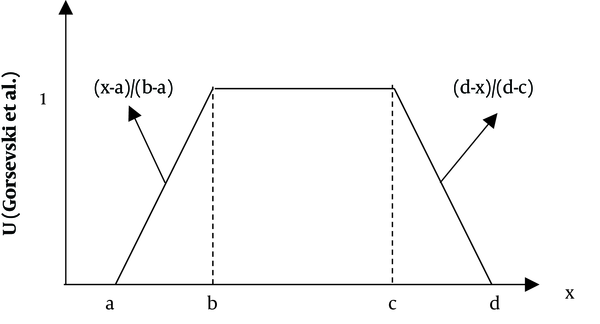
Step 3: The Fuzzy AHP method was used to determine the weight of the criteria (Figure 2). Table 1 presents the Fuzzy assessment scale in Fuzzy AHP.
| Linguistic Terms | Fuzzy Score |
|---|---|
| Absolutely strong | (5/2,3,7/2,4) |
| Very strong | (2.5/2,3,7/2) |
| Fairly strong | (3/2,2,5/2,3) |
| Slightly strong | (1,3/2,2,5/2) |
| Equal | (1,1,1,1) |
| Slightly weak | (2/5,1/2,2/3,1) |
| Fairly weak | (1/3,2/5,1/2,2/3) |
| Very weak | (2/7,1/3,2/5,1/2) |
| Absolutely weak | (1/4,2/7,1/3,2/5) |
Fuzzy Assessment Scale in FAHP (22)
Membership function of the triangular fuzzy number (28)
Step 4: The worst alternative (A-) and the best alternative (A-) were determined by Equations 2
Where J+ and J- are associated with the criteria of positive and negative impacts, respectively.
Step 5: The shortest distance from the best alternative (D+) and the longest distance from the worst alternative (D-) were calculated by Equations 4 (23):
Finally, the similarity(S) to the worst condition was calculated by Equation 6 (23, 25):
According to the similarity, the alternatives were ranked.
4. Results
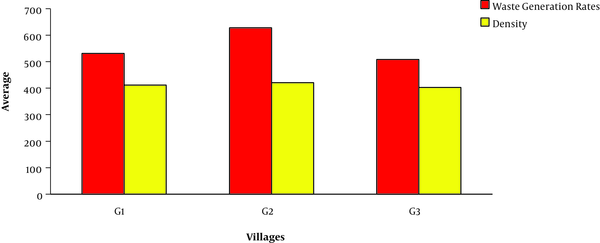
According to the results, the rural waste generation rate was 555 g/day. The highest and lowest amount of waste were 764 g/day and 326 g/day in autumn and spring, respectively (Figure 3). The average solid waste rate in the second group was 628 g/day, which was higher than other villages in different seasons. The average density of these villages was 412 kg/m3. According to the results of this study, the total average of degradable material, plastic and rubber, wood and paper, metals glass, textiles, and other materials were as follows: 57%, 12%, 11.2%, 6.4%, 4.9%, 2.3%, and 5.8 %, respectively (Table 2).
| Area | C1 | C2 | C3 | C4 | C5 | C6 | C7 |
|---|---|---|---|---|---|---|---|
| G1 | 56.2 | 14.3 | 9.3 | 7.2 | 6.2 | 1.4 | 4.1 |
| G2 | 61.3 | 12.1 | 11.6 | 5.8 | 4.2 | 2.5 | 6.8 |
| G3 | 53.7 | 10.4 | 12.9 | 6.4 | 4.5 | 3.2 | 6.5 |
| Total | 57 | 12 | 11.2 | 6.4 | 4.9 | 2.3 | 5.8 |
The Percentage of Solid Waste Components in Three Target Village Groups
To analyze the impacts, the TOPSIS method was used to rank and determine the significance of the effects. Also, in this study, weights of indices were calculated by the Fuzzy AHP method. Table 1 shows the final weights of the indices to rank. The results of weighing show that plastic and rubber were the highest impacts on animals (0.195), and wood and paper were the least impacts on animals (0.5) (Table 3). The first step of TOPSIS was to create an evaluation matrix. The decision matrix was composed of 9 rows (species) and 7 columns (wastes). The options (species) were the rows of this matrix, and the wastes were the columns. After creating the decision matrix and scaling it, the weighted decision matrix was determined. Table 4 presents the weighted normalized decision matrix.
| Criteria | C1 | C2 | C3 | C4 | C5 | C6 | C7 |
|---|---|---|---|---|---|---|---|
| Weight | 0.142 | 0.195 | 0.091 | 0.163 | 0.172 | 0.094 | 0.141 |
Final Weights of the Indices to Rank
| Species | C1 | C2 | C3 | C4 | C5 | C6 | C7 |
|---|---|---|---|---|---|---|---|
| S1 | 0.038 | 0.075 | 0.029 | 0.070 | 0.062 | 0.029 | 0.050 |
| S2 | 0.017 | 0.091 | 0.019 | 0.054 | 0.064 | 0.031 | 0.041 |
| S3 | 0.080 | 0.013 | 0.031 | 0.021 | 0.054 | 0.025 | 0.028 |
| S4 | 0.007 | 0.064 | 0.037 | 0.063 | 0.053 | 0.041 | 0.042 |
| S5 | 0.028 | 0.058 | 0.020 | 0.051 | 0.065 | 0.028 | 0.053 |
| S6 | 0.062 | 0.030 | 0.028 | 0.045 | 0.041 | 0.033 | 0.056 |
| S7 | 0.057 | 0.082 | 0.043 | 0.055 | 0.059 | 0.025 | 0.029 |
| S8 | 0.049 | 0.052 | 0.024 | 0.038 | 0.048 | 0.033 | 0.059 |
| S9 | 0.038 | 0.075 | 0.029 | 0.070 | 0.062 | 0.029 | 0.050 |
The Weighted Decision Matrix
After determining the weighted normalized decision matrix, the worst alternative and the best alternative were calculated. Table 5 shows the worst alternative and the best alternative. Then, the distance from the target alternative and the worst condition were calculated (Table 6). The distances indicate the priority of the dimensions, the proximity to the positive alternative (D+) and avoid the negative alternatives (D-). Finally, according to the importance of wastes, the ranking of animal species was carried out. Table 7 shows the rank of each species. Canis lupus, Vulpes vulpes, and Hyaena hyaena were ranked with the highest scores of 2.260, 1.958, and 1.948, respectively, and the most effects will be on these species.
| Criteria | C1 | C2 | C3 | C4 | C5 | C6 | C7 |
|---|---|---|---|---|---|---|---|
| A+ | 0.080 | 0.091 | 0.043 | 0.070 | 0.065 | 0.041 | 0.059 |
| A- | 0.007 | 0.013 | 0.019 | 0.021 | 0.041 | 0.025 | 0.028 |
Determination of the Worst Alternative (A-) and the Best Alternative (A+)
| Species | D+ | D- |
|---|---|---|
| S1 | 0.049 | 0.091 |
| S2 | 0.072 | 0.089 |
| S3 | 0.099 | 0.075 |
| S4 | 0.080 | 0.0736 |
| S5 | 0.069 | 0.068 |
| S6 | 0.070 | 0.070 |
| S7 | 0.044 | 0.097 |
| S8 | 0.063 | 0.068 |
| S9 | 0.049 | 0.081 |
Determination of the Distance from the Target Alternative and the Worst Condition
| Species | Score | Rank | |
|---|---|---|---|
| S1 | Vulpes vulpes | 1.958 | 2 |
| S2 | Felis silvestris | 1.323 | 4 |
| S3 | Ovis orientalis | 0.836 | 9 |
| S4 | Capra aegagrus | 0.975 | 8 |
| S5 | Hystirix indica | 1.051 | 7 |
| S6 | Panthera pardus | 1.065 | 6 |
| S7 | Canis lupus | 2.260 | 1 |
| S8 | Ursus arctos | 1.158 | 5 |
| S9 | Hyaena hyaena | 1.948 | 3 |
Rank of the Species
5. Discussion
This study was aimed to evaluate the wild mammals status affected by human wastes in villages in the east of Lorestan. In this study, the wastes of 42 villages from the Oshtorankooh protected area of Lorestan province were investigated. The study revealed that wastes were significantly correlated with the rural population (P = 0.01). In addition, the occupation status (P = 0.02), economic status (P = 0.07), number of children (P = 0.04), and living status (P = 0.02) were also significantly correlated with the waste generation rate in the present study. This finding is similar to the finding of previous studies conducted in China (9), Romania (10), the northwest of Iran (11), Egypt (13) and the European Union (15), indicating that the above-mentioned indexes were likely to be significantly associated with the waste generation rate of villages.
The present study revealed that plastic and rubber (C2) were identified as the most negative effects of waste on animals (W = 0.195), and that wood and paper (C3) were also were detected as the least negative effects of waste on animals (W = 0.091). Previous studies support these findings as they document that plastic and rubber have the worst effect on the environment (14), and wood and paper make the least changes in animal habitats (12). Another study found that the presence of plastic and paper in the animal habitat was correlated with chemical pollutants such as organic pollutants and heavy metals in animal habitats resources (16). A study in Iran showed that animal species have eaten plastics that are stuck in the throat of the animal or cause infection, disease, and death (11).
To the best of our knowledge, there was no research assessing the status of animal species, especially based on human wastes, but the results of some studies (11-15) showed that rural wastes had negative effects on animal and their habitats. For explaining this part, it could be inferred that the assessment of the wild mammals status affected by human wastes is an introduction to reduce the negative effects of waste on the animal in the future; According to this perspective, the results of this study are comparable with the results of studies in the field of waste impact assessment on the environment. The results obtained regarding this hypothesis showed that species with the highest geographical distribution in the region are most affected by human wastes. The compassion of the species in terms of all the waste components showed that the mean scores were higher in the more species distribution than in other species. Therefore, the effects of human wastes on higher dispersed species were found to be more intense.
5.1. Conclusion
According to the finding, the rural waste generation rate was high in studied villages. Plastic and rubber have the worst negative effects on animal and their habitats. The animal species with the highest geographical distribution in the region were the most affected by human wastes. Preventive strategies are needed to reduce the wastes effects on animal and their habitats. The finding of this study can provide the data required for the effectiveness of regional plans to prevent and control the negative effects of human wastes in studied villages, especially in the protected area.
Additionally, conservation strategies are needed to change the unsuitable habitats, minimize the increasing effects of human waste, and reduce the ecological impacts imposed on the animal population. Further studies are recommended to evaluate the negative consequences of human waste on animal species and reduction of the human waste generation rate. There was not enough information about other species and assessing the chemical characteristics of wastes in this study, so further studies are recommended for other aspects in the region.


