


1. Background
Microbial food safety is an increasing public health concern worldwide. The primary cause of foodborne diseases is the presence of highly potent pathogens, such as Escherichia coli, in the poultry (1). Concerning its pathogenicity, E. coli is classified into six groups, including enteroinvasive E. coli (EIEC), enterotoxigenic E. coli (ETEC), verotoxin-producing/Shiga toxin-producing E. coli (VTEC/STEC, including its well-known subgroup, enterohemorrhagic E. coli), enteropathogenic E. coli (EPEC), enteroaggregative E. coli (EAEC), and diffusely adherent E. coli (DAEC) (2). Of all these groups, the O157:H7 serotype of EHEC strain is of zoonotic importance (3, 4).
Poultry is the natural reservoir of E. coli O157:H7 serotype, causing hemolytic uremic syndrome and hemorrhagic colitis in humans (5). In the United States, 265,000 diseases due to STEC are recorded annually, 36% of which are caused by the O157:H7 strain (6). Moreover, various poultry diseases are attributed to this strain, including avian colibacillosis, yolk sac infection, and meningitis, leading to heavy economic losses (7). Seasonal fluctuations also have tremendous effects on microbial intensification, and rainy seasons are the most alarming period (8).
Another serious problem regarding the treatment of E. coli O157:H7 is its multiple drug resistance (MDR) due to the irrational use of antibiotics. In veterinary medicine, antibiotics are not only used for treatment and prophylaxis purposes but also as growth promoters (9). Based on the mentioned findings, isolation and determination of the antibiotic resistance of E. coli and its Shiga toxin strain (O157:H7) play an important role in the control of their dissemination.
2. Objectives
3. Methods
3.1. Sample Collection
From 2015 to 2016, a total of 204 feed samples were randomly collected. Seventeen poultry farms were selected randomly in Karachi Province for microbiological evaluation of feed samples. All samples were transferred in sterile labeled bags to the Department of Microbiology, University of Karachi, Pakistan.
3.2. Characterization of Isolates
3.2.1. Conventional Culture Method
Each feed sample was mixed with a nutrient broth at a ratio of 1:9 and incubated overnight. Then, 0.1 mL of this dilution was streaked onto the nutrient agar (Oxoid, UK) and kept in an incubator at 37°C for 24 hours (10).
3.3. Determination of Bacterial Load with Seasonal Variations
The total viable count (TVC) of E. coli was determined from 10-1 to 10-8. From each dilution, 1 mL of aliquot was inoculated onto eosin methylene blue agar (Oxoid, UK) and MacConkey agar (Oxoid, UK) plates, using the spread plate method and incubated for 24 hours (11). The TVC was recorded seasonally (September-November, December-February, March-May, and June-August).
3.4. Isolation and Identification of E. coli by the International Organization for Standardization (ISO) Method
The conventional culture method was carried out based on the recommended ISO 16654 method (12) with slight modifications for E. coli serotype identification. This method consists of the following steps.
3.4.1. Pre-Enrichment Stage
Each feed sample (25 g) was placed in 225 mL of modified Tryptone Soya Broth (Oxoid, UK) plus 20 mg/L of Novobiocin (Sigma) and incubated at 41°C for 24 hours.
3.4.2. Concentration Stage
In this stage, 1 mL of each pre-enriched broth was placed in 20 μL of immunomagnetic beads (Thermo Fisher Scientific, USA), coated with antibodies to E. coli O157:H7, and incubated for 24 hours.
3.4.3. Isolation Stage
In this stage, 50 μL of the prepared suspension was streaked on Cefixime Tellurite Sorbitol MacConkey (CT-SMAC) agar (Oxoid, UK) and incubated for 22 hours at 37°C. Clear and colorless colonies, characteristic of E. coli O157:H7, were observed. For further verification, the colonies were streaked again on eosin methylene blue agar (Oxoid, UK) and incubated for the next 24 hours; typical colonies confirmed the presence of E. coli O157:H7.
3.4.4. Confirmatory Stage
Biochemical and molecular characterizations were used for further identification.
3.5. Biochemical Characterization
Biochemical tests, including citrate utilization test, Voges-Proskauer test, indole formation, motility test, carbohydrate fermentation test, hydrogen sulfide production, catalase, oxidase, and urease tests, and methyl red tests, were performed on all E. coli-positive samples for identification (13).
3.6. Molecular Study of Samples
3.6.1. DNA Mining
A method described in the literature (14) with minor changes was used for DNA extraction of all culturally positive E. coli samples. Initially, the bacterial culture (1 mL) was centrifuged at a speed of 13,000 g for 15 minutes, and the supernatant was removed. Then, 80 µL of proteinase K buffer plus enzyme (Thermo Fisher Scientific, USA), 40 µL of sodium dodecyl sulfate (SDS; Thermo Fisher Scientific, USA), and 240 µL of saline water were added and vortexed for two minutes. Next, the mixture was incubated in a water bath for five hours at 55°C. After resting the mixture for 15 minutes, 240 µL of 6 M sodium chloride (NaCl) was added, and incubation was performed at room temperature. Afterward, the mixture was vortexed for two minutes and centrifuged for five minutes at 3000 g. The supernatant was moved to a second tube and centrifuged for 15 minutes at 13,000 g (in duplicate). After adding 460 µL of isopropanol (Longhong Chemical Co., China) to the mixture, centrifugation was carried out for five minutes, and the supernatant was discarded. In the next step, cold ethanol 70% (1000 µL) was added, and after centrifugation for five minutes, the supernatant was discarded. After the tubes were air-dried for two hours, Tris-EDTA (TE) buffer (25 µL) was added, and the extracted DNA was stored at -80°C.
3.6.2. Polymerase Chain Reaction (PCR) Amplification
Universal primers with a target size of 1500 bp were used for confirmation of E. coli at the genus level (15). E. coli O157:H7 (target size, 450 bp) was verified by species-specific PCR assay.
3.6.3. Thermal Cycler Conditions for E. coli O157:H7 Strain
The thermocycling conditions were as follows: initial denaturation for two minutes at 94°C, denaturation for 30 seconds at 94°C, annealing for 30 seconds at 72°C, extension for 30 seconds at 72°C, and a final extension at 72°C for ten minutes. The dideoxy method was used for the sequencing of amplified products, and the NCBI BLAST tool was used for confirmation. The sequences and product sizes are presented in Table 1.
| Primer sequences | Product size (bp) | Target genes | References | |
|---|---|---|---|---|
| Universal primers | AGAGTTTGATCCTGGCTCAG TACGGTTACCTTGTTACGACTT | 1500 | 16S rRNA | Marchesi et al. (1998), (15) |
| E. coli O157:H7 | AAG CGA CTG AGG TCA CT ACG CTG CTC ACT AGA TGT | 450 | eaeAO157:H7 | Louie et al. (1994) |
The List of Primers
3.7. Antimicrobial Susceptibility Testing
The disc diffusion test (DDT) was performed as described by the Clinical and Laboratory Standards Institute (CLSI) (16). The minimum inhibitory concentration (MIC) was also measured according to the CLSI guidelines (17) to evaluate the antimicrobial sensitivity of moxifloxacin, ciprofloxacin, gentamicin, enrofloxacin, chloramphenicol, kanamycin, streptomycin, trimethoprim, tetracycline, oxytetracycline, neomycin, penicillin, ampicillin, and amoxicillin by using a commercially prepared disk (Oxoid, UK) against E. coli O157:H7 strain.
3.8. Statistical Analysis
A one-way ANOVA test was performed in SPSS version 22.0 to determine the relationship between bacterial load and seasonal variations.
4. Results
4.1. Bacterial load with Seasonal Variations
Positive samples of E. coli (n=38) were evaluated by TVC in relation to seasonal variations, using one-way ANOVA, as shown in Table 2 and Table 3. As the P value was less than 0.05 (P = 0.00) and the F value was above one (F = 15.56), the effects of seasonal variations on the bacterial load were significant.
| Seasons | TVC (Log10 CFU/g) | 95% Confidence interval | ||||
|---|---|---|---|---|---|---|
| Positive samples | Minimum | Maximum | Mean ± SE | Lower bound | Upper bound | |
| December to February | 8 | 1 | 3.4 | 2.06 ± 0.29 | 1.357 | 2.767 |
| March to May | 5 | 1.21 | 5.1 | 3.07 ± 0.70 | 1.118 | 5.037 |
| June to August | 12 | 1.98 | 7.9 | 6.44 ± 0.45 | 5.453 | 7.442 |
| September to November | 13 | 1.77 | 6.8 | 4.96 ± 0.47 | 3.932 | 6.000 |
| Total | 38 | 1 | 7.9 | 4.57 ± 0.36 | 3.843 | 5.305 |
The total Viable Count (TVC) of E. coli in Relation to Seasons
| Df | Mean square | F | P | |
|---|---|---|---|---|
| Between groups | 3 | 35.269 | 15.566 | 0.000 |
| Within groups | 34 | 2.266 | ||
| Total | 37 |
ANOVA Results for TVC of E. coli (log10 CFU/g) in Different Seasons
4.2. Isolation of E. coli 0157:H7 Strain by ISO 16654 Method
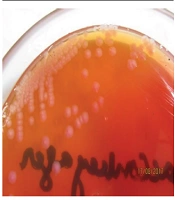
For isolation of the pathogenic strain (E. coli O157:H7), the method recommended by ISO was used for all E. coli-positive culture samples (Figure 1 and Figure 2). Due to colonial variations, some strains of E. coli O157 also fermented sorbitol and did not produce colorless colonies; this was also true for the biochemical properties of this strain. Consequently, a low percentage of profile was produced that may be linked to the genetic evolution and the variety of virulence factors. Therefore, all positive and negative samples for E. coli O157:H7 were subjected to biochemical characterization and further validated by universal and species-specific PCR to differentiate the pathogenic strains of E. coli from non-pathogenic ones.

Colorless colonies on CT-SMAC
")
Small flat colonies with a metallic green sheen on eosin methylene blue agar (EMB)
4.3. Molecular Characterization
All positive culture samples of E. coli (n = 38) were also positive for the reported universal primers, as shown in Figure 3. However, species-specific primers only confirmed eight positive samples for E. coli O157:H7, as shown in Figure 4.
. L: DNA ladder; NC: negative control; and PC: positive control (positive samples from 1 to 5).")
Amplified products of E. coli with universal primers (1500 bp). L: DNA ladder; NC: negative control; and PC: positive control (positive samples from 1 to 5).
. M: DNA marker (positive samples from well 2 to well 5). PC is the positive control, and NC is the negative control.")
E. coli 0157:H7 amplified with the reported primer (450 bp). M: DNA marker (positive samples from well 2 to well 5). PC is the positive control, and NC is the negative control.
4.4. Antimicrobial Susceptibility Test
The effectiveness of antibiotics against positive samples of E. coli O157:H7 was estimated by antimicrobial susceptibility tests.
4.4.1. DDT
By using DDT, the antibiogram profile of E. coli O157:H7 was calculated (Table 4). The resistance of E. coli O157:H7 to antibiotics was as follows: 100% to enrofloxacin, chloramphenicol, trimethoprim, ampicillin, amoxicillin, and penicillin G; 87.5% to tetracycline and oxytetracycline; 50% to streptomycin; 25% to ciprofloxacin; 12.5% to moxifloxacin; and 0% to gentamicin, neomycin, and kanamycin, respectively.
| Antimicrobials | Sensitive, n (%) | Intermediate, n (%) | Resistant, n (%) |
|---|---|---|---|
| Gentamicin (Cn = 30 µg) | 8 (100) | - | - |
| Neomycin (N = 10 µg) | 8 (100) | - | - |
| Kanamycin (K = 30 µg) | 8 (100) | - | - |
| Moxifloxacin (Mxf = 5 µg) | 6 (75) | 1 (12.5) | 1 (12.5) |
| Ciprofloxacin (Cip = 30 µg) | 4 (50) | 1 (12.5) | 2 (25) |
| Streptomycin (S = 10 µg) | 2 (25) | - | 4 (50) |
| Tetracycline (Te = 30 µg) | 1 (12.5) | - | 7 (87.5) |
| Oxytetracycline (Ot = 30 µg) | 1 (12.5) | - | 7 (87.5) |
| Enrofloxacin (Enr = 5 µg) | 0 | - | 8 (100) |
| Chloramphenicol (C = 30 µg) | 0 | - | 8 (100) |
| Trimethoprim (W = 1.25 µg) | 0 | - | 8 (100) |
| Ampicillin (Amp = 10 µg) | 0 | - | 8 (100) |
| Amoxicillin (Aml = 10 µg) | 0 | - | 8 (100) |
| Penicillin G (P10 = 10 µg) | 0 | - | 8 (100) |
Disc Diffusion Test (DDT) for E. coli O157:H7
4.4.2. MIC Measurements
The effective minimum concentration of antibiotics against isolates was determined by measuring the MIC (Table 5). The significant difference (P < 0.003) between antimicrobial agents indicated the high efficacy of aminoglycosides (gentamicin, kanamycin, neomycin, and streptomycin) with the lowest MICs against E. coli O157:H7. On the other hand, fluoroquinolones (ciprofloxacin and moxifloxacin), oxytetracycline, and tetracycline showed low efficacies with high MICs. Also, trimethoprim, enrofloxacin, chloramphenicol, penicillin, ampicillin, and amoxicillin were completely ineffective; therefore, their MICs were not evaluated.
| Antimicrobials | Mean ± SEM | F | P Value |
|---|---|---|---|
| Gentamicin | 0.16 ± 0.04 | ||
| Kanamycin | 0.29 ± 0.11 | ||
| Neomycin | 0.25 ± 0.12 | 5.35 | 0.003 |
| Moxifloxacin | 2.33 ± 0.88 | ||
| Ciprofloxacin | 3.33 ± 0.66 | ||
| Streptomycin | 5.33 ± 1.33 | ||
| Oxytetracycline | 9.33 ± 3.52 | ||
| Tetracycline | 6.67 ± 1.33 |
The Minimum Inhibitory Concentration (MIC) of Antimicrobials Against E. coli O157:H7
5. Discussion
5.1. High Incidence of E. coli O157:H7 in the Animal Feed
This study was conducted to evaluate E. coli as a major foodborne pathogen, using the conventional culture method and PCR assay. The results of universal PCR revealed that 18.6% (38/204) of samples were positive for E. coli, 21% (8/38) of which were confirmed for E. coli O157:H7 through species-specific PCR. This rate is higher than that reported in Argentina, where 5% of chicken product samples were positive for Shiga-toxigenic E. coli O157:H7 (18). On the other hand, 4% of meat samples in the UK showed the presence of E. coli O157:H7 (19). Overall, the high incidence of foodborne pathogens (E. coli O157:H7) in Pakistan, as compared to other countries, is alarming.
5.2. Effects of Seasonal Fluctuations on Bacterial Load
The effects of climatic fluctuations on the propagation of bacterial contamination are important. In the present study, the highest concentration of E. coli (7.9 × 10⁸) was recorded in summer, while the lowest concentration (1 × 10⁸) was reported in winter. This finding is consistent with a previous study (20), which demonstrated the effects of seasonal variations on microbial growth during feed storage and transportation.
5.3. MDR of E. coli O157:H7
Antimicrobials are used routinely to maintain the health of humans and animals. However, the irrational use of antimicrobials may lead to changes in the intestinal microflora and pathogenic bacteria by creating new resistant microbes that cause public health risks (21, 22). The highest resistance of E. coli O157:H7 (100%) to amoxicillin, ampicillin, penicillin, chloramphenicol, trimethoprim, and enrofloxacin has been recorded in recent research. In this regard, Kyabaggu et al. (23) reported the remarkable resistance of E. coli O157:H7 to penicillin derivatives and chloramphenicol; susceptibility was only found for aminoglycosides (neomycin, gentamicin, and kanamycin). Also, Altaee et al. (24) and Ari et al. (25) reported similar findings. Overall, microbial analysis of poultry feed is incomplete without appropriate treatment and control measures. Also, the MDR of these microbes has posed treatment challenges.
5.4. Conclusion
The dominance of foodborne pathogens in the poultry feed represents a constant health risk to poultry and humans. Therefore, feed safety and sustained inspection of antimicrobial resistance of pathogens should be major concerns in developing countries, such as Pakistan, to promote poultry farming and human health.
