


1. Background
Noise is defined as an unwanted and annoying sound (1). Noise is a frequent occupational danger in an extensive range of industries such as iron and steel, smelting, wood, textile, aerospace, and chemical (2, 3). Exposure to noise is not a new phenomenon but has been raised as one of the most important industrial problems in the last century because of the accelerating speed of industrialization and the development of various professions and heavy machinery (4). According to the National Institute for Occupational Safety and Health (NIOSH), 14% of the workers occupied in the United States and 30% of the workers employed in Europe are exposed to noises higher than permitted limits (5). Based on statistics from the Center for Environmental and Occupational Health of the Iranian Health Ministry, more than two million workers are exposed to noises above permitted limits (6). The standard limit of exposure to noise has been determined 85 decibels (dB) (7). Exposure to noise higher than the recommended threshold can result in unwanted complications and effects, including temporary and permanent hearing loss. Moreover, it can cause unfavorable physiological and psychological effects, reduce efficiency and productivity, and also increase the risk of workplace accidents (8-10).
Various solutions, such as noise control either at the source, at the path, or at the receiving point, have been recommended for decreasing noise exposure. In some cases, just one controlling method is enough to reduce the intensity of noise exposure, but in most cases, a combination of several methods is required (11). The Noise Control Priority Index (NCPI) can help prioritize noise control solutions in various industries. The NCPI is used for the prioritization of different units in terms of their importance for noise control. However, there are different solutions for controlling noises, and it is necessary to select the most appropriate one in each industrial unit. This index was introduced by Dehghan et al. (12) for the petrochemical industry in 2013. The NCPI value determines the priority of noise control solutions based on the number of the people exposed to desired ranges of sound pressure level (SPL) in each zone, the duration of exposure, the total number of people in all units and the total exposure time. Golmohammadi et al. (13) also applied NCPI to prioritize noise control solutions in a tire manufacturing company.
The oil industry is one of the industries with the highest rate of noise pollution and exposure higher than permissible levels. The results of the studies conducted by Moradirad et al. (14), Ferguson et al. (15), and Ali (16) showed that the operational personnel employed in this industry are exposed to noise levels higher than 85 dB. Therefore, noise control is essential to prevent its adverse consequences for oil industry employees (14-16). The operational units of the oil industry are often large and have various noise sources. Steam leakage, fans, compressors, furnaces, and flares are the most important sources of noise in these industries (17). Therefore, it is essential to identify and prioritize noise control solutions in the units in which noise pollution is particularly an important problem. In fact, it is essential to identify priorities and decide on allocating available resources because it is not reasonable to perform all control solutions (18). Therefore, because of the existence of a variety of operational units with different noise sources and also inadequate financial resources, the identification and prioritization of operational units for the implementation of noise control solutions can improve the decision-making process in implementing an appropriate noise control strategy. In this regard, the NCPI index can be applied as a scientific tool to identify and prioritize the units requiring the implementation of sound control measures.
2. Objectives
The present study was conducted to prioritize different units of an oil refinery in terms of their importance for implementing noise control measures using the NCPI index.
3. Methods
This cross-sectional study was performed in the oil storage reservoirs and transport units of an oil refinery in 2019. This unit is responsible for receiving the crude oil, send it to distillation units, and also provide feed for ancillary units. The reservoir unit includes the methyl tertiary-butyl ether (MTBE) transportation unit, new transportation area (NTA), Kerosene transportation area (KTA), 1-2-3 crude oil pumping stations, a control center, and gas supply, dirt oil, and spherical reservoirs. Basic information such as the location of noise sources, the information of operating conditions, and the number of people in each unit were collected by interviews with the supervisors and senior personnel of each unit. To determine the noise pollution value in different units, the SPL value was measured using the CEL490 device calibrated with the CEL-110/1 calibrator based on the ISO 9612 standard. In the next stage, NCPI was calculated for each unit, and the units were prioritized based on the calculated scores.
3.1. Determining SPLs Based on the ISO 9612 Standard
At first, the units were divided into squares with the dimensions of 5 × 5 m, and their centers were determined as the measurement points. The dominant climatic condition included a clear and sunny sky with an average temperature of 36°C, a relative humidity of 54 percent, and a gentle wind speed during measurements. Also, the distance of the device's microphone from the ground level was nearly 1.55 meters. Finally, SPLs were measured at least three times in the center of each square. The minimum measurement time to record SPL in each workstation was nearly 15 seconds, and the average of the measured values was considered as the SPL of each station (11). After that, the noise map was drawn for the units by determining the danger (SPL above 85 dB), warning (SPL between 65 and 84 dB), and safe (SPL below 65 dB) zones.
3.2. Calculating NCPI
The value of NCPI was calculated for each unit using Equation 1. This index was computed based on the number of the people exposed to desired ranges of SPL in each zone, exposure duration, the total number of people in all units, and total exposure time (12).
Where “Wi” is the weighting factor related to SPL; “Pi” is the number of the people exposed to desired ranges of SPL in each zone; “ti” represents each individual’s exposure time (hours), and “PT” is each individual’s total exposure time (hours).
4. Results
Overall, 10 units were evaluated based on the ISO 9612 standard. Table 1 reports the results of noise emission measurement in the assessed operational units. The highest value was related to the NTA unit (98 dB), and the lowest value was observed in the spherical reservoir unit (84 dB).
| Units | Sound Pressure Level, dB | Mean ± SD | |
|---|---|---|---|
| Min | Max | ||
| MTBE | 64 | 85 | 81 ± 9.63 |
| Spherical reservoirs | 64 | 84 | 77.77 ± 7.15 |
| Dirt oil | 76 | 92 | 82.21 ± 5.45 |
| Gas supply | 65 | 87 | 78.82 ± 7.35 |
| NTA | 75 | 98 | 89.32 ± 9.12 |
| Control Center | 64 | 92 | 88.3 ± 1.88 |
| crude oil pumping stations 1 | 70 | 90 | 86.6 ± 7.25 |
| crude oil pumping stations 2 | 68 | 93 | 78 ± 6.62 |
| crude oil pumping stations 3 | 72 | 92 | 77 ± 6.65 |
| KTA | 64 | 88 | 80.79 ± 4.25 |
The Results of Noise Emission Measurement in the Operational Units of an Oil Refinery
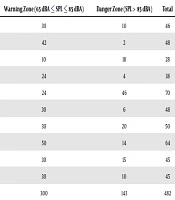
The results revealed that 8.09% of the stations assessed were in the safe zone, 62.24% in the warning zone, and 29.66% in the danger zone. Table 2 represents the distribution of stations in different units in the safe, warning, and danger zones.
| Units | Safe Zone (SPL < 65 dBA) | Warning Zone (65 dBA ≤ SPL ≤ 85 dBA) | Danger Zone (SPL > 85 dBA) | Total |
|---|---|---|---|---|
| MTBE transportation unit | 6 | 30 | 10 | 46 |
| Spherical reservoirs | 8 | 42 | 2 | 48 |
| Dirt oil | 0 | 10 | 18 | 28 |
| Gas supply | 10 | 24 | 4 | 38 |
| New transportation area (NTA) | 0 | 24 | 46 | 70 |
| Control Center | 12 | 30 | 6 | 48 |
| Crude oil pumping stations 1 | 0 | 30 | 20 | 50 |
| Crude oil pumping stations 2 | 0 | 50 | 14 | 64 |
| Crude oil pumping stations 3 | 0 | 30 | 15 | 45 |
| Kerosene transportation area (KTA) | 5 | 30 | 10 | 45 |
| Total | 39 | 300 | 143 | 482 |
Results of SPL Measurement in the Operational Units of Reservoirs and Transportation of Petroleum Products in Terms of the Type of the Station
The results of Table 2 showed that 143 stations had SPLs higher than 85 dB; 300 stations had SPLs between 65 and 85 dB, and 39 stations had SPLs less than 65 dB. The NTA unit delivered the highest SPL, and the spherical tank unit showed the lowest SPL. Then the NCPI index was calculated for all units. Table 3 describes the values of the NCPI index in various units.
| Units | Exposure Time, h | Number of Workers | Weighting Factor, Mean | NCPI | |||
|---|---|---|---|---|---|---|---|
| Min | Max | ||||||
| New transportation area | 6 | 12 | 0.18 | 5 | 832 | 664 | 1.25 |
| Kerosene transportation area | 7 | 12 | 0.32 | 2.31 | 712 | 664 | 1.07 |
| Crude oil pumping stations 1 | 7 | 8 | 0.54 | 2.31 | 684 | 664 | 1.03 |
| Crude oil pumping stations 2 | 5 | 8 | 0.54 | 3 | 673 | 664 | 1.01 |
| Crude oil pumping stations 3 | 5 | 8 | 0.83 | 3 | 654 | 664 | 0.98 |
| Control center | 6 | 10 | 3.2 | 1.7 | 623 | 664 | 0.93 |
| Dirt oil | 6 | 10 | 0.83 | 3 | 611 | 664 | 0.92 |
| Gas supply | 8 | 8 | 0.32 | 2.31 | 601 | 664 | 0.90 |
| MTBE transportation unit | 6 | 12 | 0.32 | 3 | 590 | 664 | 0.88 |
| Spherical reservoirs | 6 | 10 | 0.32 | 1.7 | 560 | 664 | 0.84 |
The Values of the NCPI Index in Various Units Evaluated
The results revealed that the NTA unit had the highest noise pollution with a NCPI value of 1.25, so it was the first priority unit for implementing noise control measures. Also, the KTA unit and Crude oil pumping station 1 were in the second and third ranks, respectively. The spherical reservoir unit was recognized as the last priority.
5. Discussion
In this study on noise control prioritization in an oil refinery, workers’ exposure to noise in different units of reservoirs and the petroleum products transportation unit were determined using the NCPI index. The number of employees, the duration of exposure in each unit, and employees’ working places were determined by interviews with the supervisors and senior personnel of each unit. Then the NCPI index was computed by the values measured for the sound emission rate. The results showed that the highest sound emission was related to the NTA unit (98 dB), and the lowest sound emission was observed in the spherical reservoir unit (84 dB). The difference between the minimum and maximum SPLs was estimated to be 34 dB, and the average SPL was equal to 89 dB.
The results of a study by Mousavi et al. (11) showed that the NTA unit had the highest amount of noise pollution (92 dB) among the units in an oil refinery, which is in agreement with the results of the present study. Here, the numerical values of the NCPI index were calculated in the range of 0.84 to 1.25, and the NTA unit with a score of 1.25 had the first priority for noise control among the units. Main noise sources in this unit included centrifugal pumps and pumping stations. Steam leakage and defective metal covers in pumps and their rhythmic vibration were the main causes of sound emission in these units. Moradirad et al. also concluded that the main noise generator sources in the distillation unit of an oil refinery consisted of steam leakage, pumps, and the vibration caused by devices (14). Huang et al. also showed that the employees of an oil refinery were exposed to noises higher than 85 dB (i.e., the permissible level), and the main sound generators in the operational units of the oil refinery were flares and compressors. (19). These results are in agreement with the findings of the current study.
Dehghan et al. (12) used the NCPI index to prioritize noise control measures in a petrochemical complex and showed that the compression unit with a score of 0.32 had the first priority of noise control. Additionally, the results of Golmohammadi et al. (13) revealed that the curing unit with a score of 1.369 was the first priority for noise control among 11 units. In fact, NCPI defines a pattern for ranking and prioritizing noise control measures by combining useful criteria for determining the contribution of different units in noise pollution (16). As it is not possible to implement all noise control solutions to reduce noise exposure in operational units because of financial limitations, multi-criteria decision-making methods can be used to select the most suitable solutions based on available resources. Using multi-criteria decision-making methods, such as fuzzy hierarchical analysis, Vikor, and TOPSIS, it is possible to prioritize noise control methods as a complement for the NCPI method (18). Mousavi et al. determined the weights of effective criteria for selecting the most suitable noise control solution in the distillation unit of an oil refinery using the FAHP hierarchical analysis method. Moreover, they concluded based on the TOPSIS method that the construction of an enclosed chamber was the most suitable noise control solution (17). Additionally, Ishaqi et al. prioritized noise control criteria and solutions in a glass manufacturing company using the AHP hierarchical analysis method and proposed that the use of a complete partition between two main parts was the most suitable noise control solution with a final weight of 0.113 (20). The present study was conducted only in one part of an oil refinery while there are various operating units in oil refineries, such as distillation and water and steam units. Therefore, it is recommended to conduct further studies in other operating units and employ the NCPI index to prioritize noise control measures in various industries. Subsequently, the most appropriate solutions can be selected using multi-criteria decision-making methods such as ANP and FAHP.
5.1. Conclusions
In general, the results of this study revealed that the average sound emission was higher than the permissible limit of 85 dB in the reservoirs and the petroleum products transportation unit of the studied oil refinery. Based on the NCPI method, the NTA unit was the first priority to reduce the rate of noise exposure. The results of this study can be applied as a guidance to identify and prioritize noise control strategies by occupational health experts and supervisors in oil refineries.
