

1. Background
Developing industrial complexes is one of the most important parts of economic development strategies in the world (1). Since the 1990s, various industrial complexes have been developed in the Khorramabad area. The industrial parks are a source of pressure on the environment on different scales (2-5). Industrial complexes cause serious problems for the environment, including different kinds of environmental pollution (such as air pollution, water pollution, and soil contamination) (6-9). Environmental impact assessment (EIA) can play an effective role in identifying the effects of industrial development on the environment (10). EIA is defined as a decision-making tool to predict the effects of the environment through a systematic and comprehensive process (11). The purpose of EIA is to improve the project decision-making process, planning, design, and implementation of the project (12). This topic has been considered in different countries. Some countries, such as Canada (13, 14), India (15, 16), Denmark (17, 18), and China (19), try to evaluate environmental impacts through different models. In Iran, 55 large-scale projects, such as industrial parks, must be evaluated before the implementation and in the stage of feasibility studies (20).
In recent years, different methods have been used for the EIA of industrial parks. The most widely used methods developed in the review studies were checklist (21), Leopold matrix (22, 23), Iran matrix (24), rapid impact assessment matrix (RIAM) (25-27), fuzzy logic (28-30), multiple criteria decision making (MCDM) (31, 32), life cycle assessment (LCA) (33), etc. The above methods are inadequate in quickly changing and extremely uncertain conditions, where professional judgments on the environmental effects of industrial areas have a highly complex and imprecise nature. To address these problems in a comprehensive and effective framework, we proposed a fuzzy expert system based on a fuzzy inference system (FIS), which uses a RIAM method to score and standardize criteria in order to evaluate the environmental impacts. The purpose of FIS frameworks is to design an input space by applying fuzzy logic (34). FISs have been used in various fields, including urban planning (34), industrial areas (35, 36), and natural management (37, 38). The RIAM method is a new tool for the execution of EIA (25). The literature review showed that the RIAM method was used in different assessment studies.
Li et al. (39) applied an improved RIAM method to a strategic environmental assessment in China. The results showed that RIAM is a potential resource for overcoming such difficulties. Their analysis of RIAM applications suggested that it could evaluate strategic alternatives because of its applicability in interdisciplinary settings, transparency, and short implementation timeframe. Srivastava and Rawal (40) used the RIAM technique to evaluate environmental impacts in Prayagraj, India. Their results showed that RIAM was beneficial for a detailed study of large projects but less feasible for quick assessments of smaller projects. Cheng (41) designed an evaluation model based on the RIAM model to improve the deviation of the traditional grey comprehensive correlation analysis method and data envelopment analysis method in Sanmenxia, Henan Province, China. The experimental results showed that the design model could effectively reduce the deviation of traditional method analysis, and it was more in line with the actual situation of the Sanmenxia environment. Kumar and Deswal (42) studied the role of RIAM to find out the concerned areas to consider all the different components affecting the environment. The results indicated that RIAM was a proven method to investigate and evaluate the physical, ecological, economic, and social-cultural impacts due to the developmental projects. In Iran, Ghobadi et al. (43) used RIAM for the EIA of petrochemical industries as a decision support system in planning a process and developing the petrochemical industry. Padash (44) assessed the environmental impacts of Masjed Soleyman’s desalination and operating unit project in the south of Iran using RIAM. Shayesteh et al. (26) assessed the environmental impacts of industrial waste by the RIAM method in the Brujen industrial park. A review of the literature shows that a comprehensive study has not been performed using a combination of these methods to compare the impact assessment of industrial parks. The current research applied a fuzzy expert system to predict the environmental impacts of industrial parks in Khorramabad.
2. Objectives
The purpose of this study was to evaluate the environmental impact of Khorramabad industrial parks using hybrid modeling.
3. Methods
The study area is the industrial parks of Khorramabad. Three industrial parks of Khorramabad were chosen to evaluate, including industrial park 1, industrial park 2, and industrial park 3. The elevation of the study area is 1147.8 over the ocean level. Normal yearly precipitation is 511.06 (45). The average daily minimum temperature is -5.5°C in the winter, and the daily maximum temperature is 33°C in the summer (Table 1). Khorramabad has a temperate and semi-humid Mediterranean climate with heavy precipitation. The region is located in a valley and encompassed by mountains. The 2 primary mountains around the zone are Sefidkooh and Makhmalkouh. In a study, a fuzzy hybrid model was applied to evaluate the environmental impacts of Khorramabad industrial parks. Figure 1 presents the process of the used method. In the proposed model, FIS was designed based on the Mamdani method and RIAM model. Designed FIS relies on 2 components: (i) a knowledge base and (ii) an inference engine (34). A knowledge base is an organized table of RIAM about EIA. An inference engine interprets and evaluates the industrial parks in the knowledge base to prepare an answer. Typical tasks for FIS involve a fuzzy input set, knowledge base, inference, and fuzzy output set (35). Input scores for FIS were acquired from the literature review, expert judgments, and engineering opinions.

The structure of the proposed model for fuzzy rapid impact assessment matrix
| Month | Temperature | Rainfall | Sunshine Days | Snowfall Days | Wind | |||
|---|---|---|---|---|---|---|---|---|
| Maximum | Minimum | Average | Speed | Direct | ||||
| January | 11.7 | 0.5 | 6.09 | 127.03 | 174.6 | 16 | 15 | 230 |
| February | 12.0 | 1.0 | 6.50 | 115.21 | 172.7 | 13 | 13 | 240 |
| March | 13.5 | 1.3 | 7.42 | 89.31 | 217.5 | 11 | 14 | 280 |
| April | 23.1 | 7.3 | 15.21 | 103.71 | 222.7 | 0 | 21 | 130 |
| May | 23.6 | 10.7 | 17.16 | 151.74 | 194.0 | 0 | 25 | 270 |
| June | 33.8 | 15.3 | 24.57 | 12.11 | 318.6 | 0 | 20 | 270 |
| July | 41.1 | 20.6 | 30.87 | 0 | 368.0 | 0 | 13 | 230 |
| August | 41.7 | 20.8 | 31.28 | 0 | 334.7 | 0 | 12 | 220 |
| September | 38.2 | 17.6 | 27.91 | 1.9 | 330.3 | 0 | 15 | 270 |
| October | 30.7 | 13.6 | 22.15 | 9.04 | 243.6 | 0 | 12 | 270 |
| November | 19.2 | 8.4 | 13.83 | 139.11 | 170.5 | 0 | 11 | 250 |
| December | 14.1 | 3.1 | 8.59 | 150.8 | 143.1 | 5 | 13 | 300 |
| Annual | 25.2 | 10.0 | 17.63 | 899.96 | 2890.3 | 26 | 25 | 300 |
The Climate Information of the Study Area
All variables of EIA were categorized into 4 groups: economical-operational (EO), physical-chemical (PC), sociological-cultural (SC), and biological-ecological (BE) groups. Table 2 presents environmental variables.
| Components | Criteria | Symbol |
|---|---|---|
| Physical/chemical | Air quality | PC1 |
| Noise for humans | PC2 | |
| Noise for animal species | PC3 | |
| Quantity of surface water | PC4 | |
| Quantity of groundwater | PC5 | |
| Watershed and its physical properties | PC6 | |
| Erosion | PC7 | |
| Soil contamination and its permeability | PC8 | |
| Microclimate | PC9 | |
| Morphology | PC10 | |
| Hydrology and drainage patterns | PC11 | |
| Biological/ecological | Land and water ecosystems | BE1 |
| Species habitats | BE2 | |
| Biodiversity | BE3 | |
| Ecological/biological processes | BE4 | |
| Biosensitive areas | BE5 | |
| Economical/operational | Land use | EO1 |
| Economic conditions | EO2 | |
| Transport | EO3 | |
| Employment | EO4 | |
| Land use patterns | EO5 | |
| Regional development plans | EO6 | |
| Financial income and expenses | EO7 | |
| Tourism plans | EO8 | |
| Future uses | EO9 | |
| Social/cultural | Demographic structure and population growth | SC1 |
| Quality of health and education services | SC2 | |
| Human settlements | SC3 | |
| Landscape | SC4 | |
| Special places such as historical, religious, etc | SC5 | |
| Quality of life | SC6 | |
| Demographic displacement and migration | SC7 | |
| Local participation | SC8 |
The Assessment Criteria of Disposal Scenarios
Criteria were scored based on 2 groups: groups A and B. Table 3 presents the assessment criteria of the proposed model. The scores of groups were calculated as follows (46):
| Category | Indices | Fuzzy Score | Definition |
|---|---|---|---|
| (A) | A1 | (3,4,5) | Significance to the international scale (A15) |
| (2,3,4) | Significance to the national scale (A14) | ||
| (1,2,3) | Significance to the regional scale (A13) | ||
| (0,1,2) | Significance only to the local scale (A12) | ||
| (0,0,0) | No significance (A11) | ||
| A2 | (2,3,4) | Major positive advantage (A23) | |
| (1,2,3) | Important improvement in the existing state (A22) | ||
| (0,1,2) | Improvement in the existing state (A21) | ||
| (0,0,0) | No alter (A20) | ||
| (0,1,2) | Negative alter in the existing state (A24) | ||
| (1,2,3) | Important negative disadvantage (A25) | ||
| (2,3,4) | Major disadvantage (A26) | ||
| (B) | B1; persistence | (0,1,2) | No alter (B11) |
| (1,2,3) | Provisional (B12) | ||
| (2,3,4) | Resistant (B13) | ||
| B2; resilience | (0,1,2) | No alter (B21) | |
| (1,2,3) | Alterable (B22) | ||
| (2,3,4) | Inalterable (B23) | ||
| B3; cumulative | (0,1,2) | No alter (B31) | |
| (1,2,3) | Non-cumulative (B32 | ||
| (2,3,4) | Cumulative (B33) |
The Scores of Fuzzy Rapid Impact Assessment Matrix Algorithm
Environmental score (ES) is the evaluation score of the RIAM model. For fuzzification of all variables, triangular membership functions were used for inputs. Table 4 indicates fuzzy environmental scores to range bands.
| Description | Fuzzy Environmental Scores | Range Bands |
|---|---|---|
| Major positive impact | (0,0,108) | +E |
| Significant positive impact | (0,0,71) | +D |
| Moderately positive impact | (0,0,35) | +C |
| Positive impact | (0,0,18) | +B |
| Slightly positive impact | (0,0,9) | +A |
| No change in the status quo | (0,0,0) | N |
| Slightly negative impact | (-9,0,0) | -A |
| Negative impact | (-18,0,0) | -B |
| Moderately negative impact | (-35,0,0) | -C |
| Significant negative impact | (-71,0,0) | -D |
| Major negative impact | (-108,0,0) | -E |
Fuzzy Environmental Scores to Range Bands
In this study, to design a fuzzy expert system, the fuzzy theory was used to determine the input and output. In the study, a triangular fuzzy number (TFN) was applied due to its computational straightforwardness and capability to improve display and data handling in a fuzzy algorithm. A TFN on R is shown as (s, t, and u), and its function is displayed as follows (37):
When there are 2 TFNs, = (a1, a2, a3) and = (b1, b2, b3), their functional rules can be as follows (35-37):
Figure 2 presents 2 TFNs, A and B, to display the actions of fuzzy scores. The fuzzy score of A can be shown as (1, 2, 3), and the fuzzy score of B can be displayed as (2, 3, 4). The addition of 2 TFNs, A

Triangular fuzzy numbers
4. Results
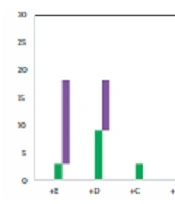
After determining and classifying the types of impacts, EIA was performed for 3 industrial parks of Khorramabad. The results of the evaluation based on the types of environmental impacts classified in the form of defuzzy results are shown in Table 5. The values of the outputs obtained in FIS are fuzzy sets. To simplify the analysis, fuzzy numbers were converted to ordinary numbers. In other words, at this stage, the value of the outputs is non-fuzzy. About 24% of the negative effects of activities of industrial park 1 were in the -E range (Figure 3). Very negative effects of industrial park 1 were related to the effects of PC components (12%) and BE components (9%). About 15% of the very positive effects of this park were related to EC components (15%) and SC components (3%). In industrial park 2 (Figure 4), the most negative effects were observed in the –D and –C ranges, and only about 9% of the negative effects of this park had very negative effects on BE components. Most of the EO effects of the parks belonged to the effects of industrial park 1 (18%). In industrial park 3 (Figure 5), the most negative effects were observed in the –C (27%) and –A ranges (15%). The very negative effects were related to the effects of SC components (3%). Very positive effects of this park were in the +C range and related to EO components (12%).

Fuzzy inference system outputs of industrial park 1

Fuzzy inference system outputs of industrial park 2

Fuzzy inference system outputs of industrial park 3
| Variables | Industrial Parks | ||
|---|---|---|---|
| No. 1 | No. 2 | No. 3 | |
| Physical/chemical | |||
| PC1 | -0.892 | -0.302 | -0.155 |
| PC2 | -0.076 | -0.082 | -0.611 |
| PC3 | -0.265 | -0.291 | -0.233 |
| PC4 | -0.784 | -0.321 | -0.121 |
| PC5 | -0.211 | -0.621 | -0.055 |
| PC6 | -0.689 | -0.253 | -0.277 |
| PC7 | -0.564 | -0.187 | -0.081 |
| PC8 | -0.591 | -0.642 | -0.032 |
| PC9 | -0.602 | -0.132 | -0.214 |
| PC10 | -0.061 | -0.052 | -0.295 |
| PC11 | -0.721 | -0.578 | -0.478 |
| Biological/ecological | |||
| BE1 | -0.681 | -0.521 | -0.294 |
| BE2 | -0.432 | -0.694 | -0.188 |
| BE3 | -0.714 | -0.721 | -0.241 |
| BE4 | -0.821 | -0.777 | -0.429 |
| BE5 | -0.489 | -0.612 | -0.586 |
| Social/cultural | |||
| SC1 | +0.561 | +0.619 | +0.132 |
| SC2 | +0.412 | +0.487 | +0.251 |
| SC3 | -0.144 | -0.263 | -0.692 |
| SC4 | -0.321 | -0.151 | -0.061 |
| SC5 | -0.267 | -0.125 | -0.078 |
| SC6 | +0.771 | +0.692 | +0.881 |
| SC7 | +0.611 | +0.356 | +0.341 |
| SC8 | +0.245 | +0.192 | +0.156 |
| Economical/operational | |||
| EO1 | +0.344 | +0.669 | +0.723 |
| EO2 | +0.712 | +0.754 | +0.311 |
| EO3 | +0.642 | -0.423 | -0.309 |
| EO4 | +0.661 | +0.793 | +0.391 |
| EO5 | +0.782 | +0.815 | +0.203 |
| EO6 | +0.721 | +0.664 | +0.311 |
| EO7 | +0.367 | +0.366 | +0.189 |
| EO8 | +0.701 | +0.568 | +0.555 |
| EO9 | -0.642 | -0.569 | -0.284 |
Fuzzy Inference System Outputs of Khorramabad Industrial Parks
5. Discussion
The EIA process of industrial parks requires expert modeling, flexibility, and suitable variables for the prediction of environmental impacts. To design an appropriate expert system, one of the decision support tools is FIS. Used together, FIS and RIAM could increase the accuracy and flexibility of effects in decision-making. Also, the uncertainty and complexity of environmental impacts prepare more flexibility for the application of EIA based on fuzzy logic. The research proposed a fuzzy expert system based on RIAM to calculate the fuzzy environmental scores of each variable and obtain the effects of industrial parks by FIS. According to this study, the FIS technique is introduced as an effective assessment tool for the actual assessment of industrial parks and the assessment of complex assessment systems. Using the FIS method in combination with classical methods of impact assessment showed that many effects could be identified by considering uncertainty. Other studies have reported that EIA in combination with fuzzy theory is an effective tool for EIA according to different criteria. Ahmadipari and Hoveidi presented that using fuzzy theory in EIA reduced uncertainty (27). Ghobadi et al. showed that fuzzy RIAM was a flexible tool as a decision support system for the development of industrial areas (29). According to the RIAM process and its properties, one of the most important problems in implementing the RIAM guideline is the determination of environmental scores in weighting the factors and checklist; it is in line with other studies such as Padash (44). According to industrial park conditions, it is necessary to consider a literature review in EIA and expert opinions. It is in line with other studies such as Hoveidi et al. (25), Ijäs et al. (47), and Arani (23). Tashayo et al. (34) highlighted the strangeness of the FIS technique in designing the expert systems and the assessment of different criteria. The basis of the FIS technique is characterized by the uncertainty of the environment and the fuzziness of information (36). Sarmah et al. highlighted that fuzzy logic was extensively used to better analyze and design systems for assessment processes (30). It is rooted in its properties and concept in the field of uncertainty. It is necessary to highlight that the current research is the first systematic study conducted in the field of EIA of Khorramabad industrial parks implementing the FIS guideline. Our study has many differences from the other studies: (1) We determined 4 groups of criteria databases for industrial parks; (2) after assessing the impacts of industrial parks, we identified that some of them were not suitable for operation in the region; (3) it was indicated that the tool had a quick calculation process to achieve an impact that makes it an appropriate tool for the actual assessment of industrial parks; and (4) it was observed that FIS could generate all needed fuzzy inputs that are already utilized by RIAM. The sustainability of the Khorramabad environment needs a balance between the natural environment and industrial development. The EIA of Khorramabad industrial parks is also combined with other assessing forms such as the physical assessment, economic assessment, and development assessment. During the preparation of the proposed model for the EIA, it was observed that most of the negative effects on nature were appraised high and long-term with significant impacts. The negative environmental impacts (which will result from the activities of the industrial parks, including increased pressure on ecosystems, air pollution, water pollution, and waste) can be mitigated.
