


1. Background
The increased community awareness of water consumption for the production of consumer goods can lead to more informed product selection and accurate consumption of products and goods, as well as water consumption reduction, thereby reducing the strain on Iran's limited water resources (and the worldwide resources in a broader view). It will also help reduce adverse environmental impacts (1, 2).
Water footprints are among the comprehensive and innovative indicators presented by Bulsink to determine the actual human contribution to the consumption and pollution of worldwide water resources. This indicator has spatiotemporal dimensions and can comprehensively consider production and consumption chains in various human processes and evaluate the sustainability of water resources from various perspectives, such as environmental, economic, and social justice, as well as the efficiency of water supply and consumption systems (2, 3).
A water footprint is a freshwater consumption standard that takes into account not only direct water consumption by a consumer or producer but also indirect water consumption. In addition to the conventional and restricted concept of water withdrawal, a water footprint can be viewed as a comprehensive indicator of how freshwater resources are allocated. The amount of freshwater consumed to produce a unit of a product is called its water footprint. In other words, a water footprint is a multidimensional indicator that shows the volume of water consumed from fresh (blue water) and contaminated sources (gray water) based on the type of pollution. Time and location are employed to identify all aspects of the total water footprint. This study concentrated on the measurement of blue water consumption in product manufacturing and the total amount of gray water added to the amount of water consumed (2, 4).
Possessing over 1,200 trillion cubic feet (33 trillion m3) of natural gas reserves, equivalent to 17% of the global gas reserves, Iran is ranked second by access to natural gas fields. With an area of 9,700 km2, South Pars Gas-Condensate Field is the world's largest natural gas field, out of which 3,700 km2 is located in Iranian territorial waters and 6,000 km2 in Qatari territorial waters. Eighty-five percent of this oval-shaped natural gas field belongs to Qatar and 15% to Iran. It is worth mentioning that the 8.19% gradient towards Qatar has complicated the collection of gas condensate for Iran. Therefore, the highest yield relates to natural gas extraction. The South Pars Gas-Condensate Field per se covers 50% of Iran's natural gas reserves and 8% of the world's. The dry gas collected from the Iranian section equals 8.1 trillion cubic meters, with a recovery factor of 61% (5).
Such a God-given wealth in the southern zone of Iranian waters has laid the foundations for building an extensive natural gas processing plant called South Pars, with an area of more than 30,000 hectares, located on the shoreline of the Persian Gulf, having 14 plants used to purify and produce natural gases collected from this field (6).
The proximity of this large processing plant to Iran's largest marine park (Nayband Gulf) located in the Persian Gulf, which is unique in the world in terms of plant and animal genetic resources and unique aquatic organisms(given the fact that the first level of a food chain starts with aquatic creatures, sequentially ending to humans), has added to the importance of assessing and quantifying environmental impacts of this industry by determining environmental impact assessment using LCA software (7, 8).
1.1. Natural Gas and Processing
Natural gas is unquestionably a significant source of energy in the 21st century, marketed to both domestic and global markets after extraction and refining. The Fifth Refinery of South Pars, Asaluyeh, Iran, produces six byproducts of natural gas: Methane, ethane, propane, butane, gas condensate, and sulfur, and distributes them in domestic and international markets (9).
Raw natural gas, extracted from underground gas fields, is entirely different from the natural gas consumed at residential and commercial premises. Unprocessed natural gas is primarily composed of light and heavy hydrocarbons (
In addition to purifying it and extracting sulfur, natural gas processing entails a series of complex operations that produce byproducts such as ethane, a petrochemical feedstock, and gaseous liquids such as Liquefied Petroleum Gas (LPG) and condensate, which are exported, as well as methane, which is consumed as natural gas (Figure 1) (5, 9, 10).

Schematic view of the refinery product process route
Natural gas processing, to produce high-quality byproducts for transmission and consumption, is divided into four stages in the majority of natural gas processing facilities:
(1) Condensate removal
(2) Gas sweetening- H2S and CO2 removal
(3) Gas dehydration
(4) NGL extraction and fraction
Aside from the four stages mentioned, wellhead equipment such as segregators for separating water from gas, filters for removing sand and other large impurities, chemical injection equipment for injecting corrosion inhibitors, and injecting gaseous hydrates inhibitors are also used (gas hydrates are crystalline solid formed of water molecules and gas molecules trapped inside it. The formation of this crystalline solid has the potential to obstruct the transmission pipeline) (5, 11).
Assessing and quantifying environmental impact is one of the applications of the Life Cycle Assessment (LCA) method. Since the governing approach of an LCA is a cradle-to-grave approach, all different stages of implementing a process or producing a product, from raw material extraction to end of life, are studied (Powell, 2000). In some cases, however, this assessment takes place as cradle-to-gate as the initial part of the cycle or as gate-to-gate as the middle part of the life cycle assessment, which refers to the boundary of the system selected for the assessment of processes or products (12, 13).
According to the standard of the International Organization for Standardization (ISO), an LCA consists of four stages in general:
(1) Goal and scope definition
(2) Inventory analysis
(3) Life cycle impact assessment
(4) Interpretation of results (7, 8, 14).
The water footprint for gas refinery products was estimated using the steam indicator for each processing unit and measuring the amount of makeup water and freshwater consumption in critical stages of processing each product.
2. Objectives
Bluewater is necessary for gas refineries, particularly in Asaluyeh, due to industrial desalination plants, many refinery phases (14 in total), and the growing activity of other water industries, such as petrochemicals and drilling rigs in the Persian Gulf. The importance of this area is well understood because of the proximity of this industrial area to the Nayband Protected Area, which is a valuable area with a diverse range of animals and plants. As a result, researchers in water resources management and sustainable ecosystem development are responsible for analyzing the environmental impact on the production status of gas refinery products, which will be explored further in future studies.
3. Methods
3.1. Study Area
The fifth gas refinery, or phases 9 and 10 of a large refinery complex with 24 phases and 14 refineries operating in Asaluyeh Port, was selected as the study area. The gas refinery comprises product preparation processing units, non-processing units (support), and joint units for electricity and steam generation.
Methane, ethane, propane, butane, gas condensate, and sulfur are products of every gas refinery, as depicted in Figure 2, which summarizes the production process (9, 15).

Simplified diagram of refinery units
The refinery's input feed, which travels through two 32-inch pipelines, first arrives at Unit 100, also known as the facilities unit, where the three-phase inflow fluid (gas, liquid, and solid) is separated. Also known as the gas sweetening unit, Unit 101 is for separating H2S and CO2. In fact, sour gas is known as such because it contains the toxic gas H2S. A chemical known as methyl diethanolamine (MDEA) is used in this unit for gas sweetening. This chemical can react with and absorb H2S and CO2. Unit 101 of the gas train unit receives its feed from Unit 100, after which water and mercury are separated from sweet gas in Unit 104 (Unit 101) (11, 15).
Unit 105 separates ethane for use as feed in petrochemical units. This unit also produces methane gas, which is known as sale gas, in addition to ethane. This gas is sent to Unit 106 and then to the national gas line, where it will be used as natural gas in domestic pipelines. Natural gas liquid (NGL) refers to heavy gas phases or NGL cuts. Unit 107 (NGL fractionation) receives these products and separates propane from butane. Ethane is routed to Ethan Treatment and Dring Unit 116 for sweetening and devolatilization. Under surface-controlled flow, hydrocarbon liquids are mixed at the bottom of the de-ethanizer tower in Unit 107 and transferred to the de-propanizer tower 101-C-107. Propane and butane are derived from Units 115 and 116. The heavier cuts of fluid containing C+5 hydrocarbons are then sent to Unit 103, also known as the gas condensate stabilization unit, for separation.
After condensate is produced in the Facilities Unit (Unit 100), inflowing gases from offshore lines must be treated in three phases. The regenerator tower in the sweetening unit (Unit 101) produces acid gas. It is impossible to burn these gases due to environmental regulations and standards. Thus, removing H2S from these gases is critical, which is accomplished in the Sulfur Recovery Unit (SRU). During the production process in Unit 108 of the gas refinery, sulfur is first produced in a molten state and then as granules. Unit 102 is a glycol regenerator unit that has a critical role in maintaining a fuzzy fluid balance and preventing crystalline hydrates of gas fluid from forming inside pipelines. Thus, water consumption in this unit is essential to the production process (5, 9, 11).
This study analyzed the environmental impact of the selected refinery from resource extraction to final product by considering the software performance unit for producing one ton of product. The production rates of refinery products and the annual consumption of electricity and natural gas as the primary feed were collected from the refinery website. Moreover, the necessary calculations were performed to prepare data for entry into the software (Table 1). SimaPro 9.2, which includes Ecoinvent 3 database, was also employed to collect data on the life cycle of electricity generation and other inputs. Including eight environmental impacts such as acidification, eutrophication, global warming, photochemical oxidation, abiotic-element resource depletion, fossil fuel resources depletion, water scarcity, and ozone layer depletion, EPD 2018 was also used in the impact assessment phase (5, 8, 11).
| Input | Byproduct | Unit | Amount |
|---|---|---|---|
| Methane | Tonne/year | 94.13673332 | |
| Ethane | Tonne/year | 14.405324 | |
| Propane | Tonne/year | 37.480636 | |
| Butane | Tonne/year | 5.351591 | |
| Condensate | Tonne/year | 16.2870180 | |
| Granule | Tonne/year | 19.49023 | |
| Natural gas | Tonne/year | 39.18279271 | |
| Electricity | Megawatt-hour/year | 1241470 | |
| Water | Cubic meter/year | 2576077004 | |
| Methanol | Kilogram/year | 35.420013 | |
| Phosphate | Kilogram/year | 1280 | |
| Sodium hypochlorite | Kilogram/year | 2519 |
Inventory Data Entered Into the Software (10)
4. Results
The method of calculating water footprints of refinery products:
(1) Collecting the monthly data of processing units based on the data obtained from refinery archives
(2) Calculating the steam consumption indicator for each unit using the following equation:
(3) Calculating the amount of makeup water in Unit 121, the refinery's total steam supply unit, based on the equation below:
The amount of makeup water is 2183 m3.
(4) Calculating the amount of water consumed in each unit by multiplying 2,183 by the amount of makeup water used daily in the unit's steam indicator
(5) Calculating water footprint of the production process of each product (the sum of the water consumption of the respective units according to the diagram) (5, 10, 11, 16, 17).
Common units were considered for all products to simplify the water repetition rate and consumption uniformity.
(6) Determining the product deduction of each product through the following formula:
The total weight of each processed product divided by the daily production total (natural gas in 2020)
(7) Determining the value deduction of each product through the following formula:
(8) Inquiring about product prices in 2020
(9) Measuring water footprint of each product through the equation below (Table 2) (2, 18-23):
| Food/Products | Annual Production | WF Process | Price[p] | Fv[p]Value Fraction | FP[p,i]Production Fraction | WFprod[p]Blue - Water Footprint |
|---|---|---|---|---|---|---|
| Natural gas | 18,279,271.39 | 7860086698 | - | - | - | - |
| Methane | 13,673,332.94 | 1169548 | 259 | 0.6545319 | 0.748023958 | 6878456288 |
| Ethane | 405,324.14 | 1077632 | 240 | 0.017979201 | 0.022173977 | 6373169244 |
| Propane | 480,636.37 | 1225228 | 400 | 0.035533115 | 0.026294066 | 10621959696 |
| Bhutan | 351,591.05 | 1019743 | 400 | 0.025992884 | 0.019234413 | 106219426409 |
| Gas condensate | 2,870,180.16 | 11002600 | 500 | 0.26523805 | 0.157018302 | 13280313631 |
| Sulfur | 49,023.19 | 1360479 | 80 | 0.00072485 | 0.002681901 | 2124383595 |
All Results Came from Conclusions
5. Discussion
5.1. Environmental Impact Assessment of Methane Production
To produce one ton of methane, approximately 2.6 kg of SO2 was emitted, responsible for the acidification of the environment. Eutrophication impact in the production of this product was 0.47 kg, which was equal to
| Environmental Impact | Total Value | Unit |
|---|---|---|
| Acidification | 2.635052288 | kg SO2 eq |
| Eutrophication | 0.47609477 | kg |
| Global warming | 590.603564 | kg CO2 eq |
| Photochemical oxidation | 2.234148326 | kg NMVOC |
| Abiotic depletion, elements | 0 | kg Sb eq |
| Abiotic depletion, fossil fuels | 44101.00029 | MJ |
| Water scarcity | 8239.589961 | m3 eq |
| Ozone layer depletion (ODP) | 0 | kg |
Environmental Impact Assessment of One Ton of Methane
5.2. Environmental Impact Assessment of Ethane Production
To produce one ton of methane, approximately 2.4 kg of SO2 was emitted, responsible for the acidification of the environment. Eutrophication impact in the production of this product was 0.44 kg, which was equal to
| Environmental Impact | Total Value | Unit |
|---|---|---|
| Acidification | 2.441747357 | kg SO2 eq |
| Eutrophication | 0.44116891 | kg |
| Global warming | 547.2774481 | kg CO2 eq |
| Photochemical oxidation | 2.070253329 | kg NMVOC |
| Abiotic depletion, elements | 0 | kg Sb eq |
| Abiotic depletion, fossil fuels | 40865.79284 | MJ |
| Water scarcity | 7635.141475 | m3 eq |
| Ozone layer depletion (ODP) | 0 | kg |
Environmental Impact Assessment of One Ton of Ethane
5.3. Environmental Impact Assessment of Propane and Butane Production
To produce one ton of methane, approximately 4.1 kg of SO2 was emitted, responsible for the acidification of the environment. Eutrophication impact in the production of this product was 0.73 kg, which was equal to
| Environmental Impact | Total Value | Unit |
|---|---|---|
| Acidification | 4.06957877 | kg SO2 eq |
| Eutrophication | 0.735281489 | kg |
| Global warming | 912.1290446 | kg CO2 eq |
| Photochemical oxidation | 3.450422081 | kg NMVOC |
| Abiotic depletion, elements | 0 | kg Sb eq |
| Abiotic depletion, fossil fuels | 68109.65208 | MJ |
| Water scarcity | 12725.2353 | m3 eq |
| Ozone layer depletion (ODP) | 0 | kg |
Environmental Impact Assessment of One Ton of Propane
| Environmental Impact | Total Value | Unit |
|---|---|---|
| Acidification | 4.069578835 | kg SO2 eq |
| Eutrophication | 0.7352815 | kg |
| Global warming | 912.1290591 | kg CO2 eq |
| Photochemical oxidation | 3.450422136 | kg NMVOC |
| Abiotic depletion, elements | 0 | kg Sb eq |
| Abiotic depletion, fossil fuels | 68109.65316 | MJ |
| Water scarcity | 12725.2355 | m3 eq |
| Ozone layer depletion (ODP) | 0 | kg |
Environmental Impact Assessment of One Ton of Bhutan
5.4. Environmental Impact Assessment of Butane Production
All environmental parameters were identical to those used in the production of one ton of propane; therefore, the amounts were not repeated.
5.5. Environmental Impact Assessment of Gas Condensate Production
To produce one ton of methane, approximately 5.1 kg of SO2 was emitted, responsible for the acidification of the environment. Eutrophication impact in the production of this product was 0.92 kg, which was equal to
| Environmental Impact | Total Value | Unit |
|---|---|---|
| Acidification | 5.086973519 | kg SO2 eq |
| Eutrophication | 0.919101871 | kg |
| Global warming | 1140.161318 | kg CO2 eq |
| Photochemical oxidation | 4.313027649 | kg NMVOC |
| Abiotic depletion, elements | 0 | kg Sb eq |
| Abiotic depletion, fossil fuels | 85137.06605 | MJ |
| Water scarcity | 15906.5443 | m3 eq |
| Ozone layer depletion (ODP) | 0 | kg |
Environmental Impact Assessment of One Ton of Gas Condensate
5.6. Environmental Impact Assessment of Sulfur Production
To produce one ton of sulfur, approximately 0.8 kg of SO2 was emitted, responsible for the acidification of the environment. Eutrophication impact in the production of this product was 0.147 kg, which was equal to
| Environmental Impact | Total Value | Unit |
|---|---|---|
| Acidification | 0.813915621 | kg SO2 eq |
| Eutrophication | 0.147056274 | kg |
| Global warming | 182.4257792 | kg CO2 eq |
| Photochemical oxidation | 0.690084304 | kg NMVOC |
| Abiotic depletion, elements | 0 | kg Sb eq |
| Abiotic depletion, fossil fuels | 13621.9282 | MJ |
| Water scarcity | 2545.046644 | m3 eq |
| Ozone layer depletion (ODP) | 8.1205105 | kg |
Environmental Impact Assessment of One Ton of Sulfur
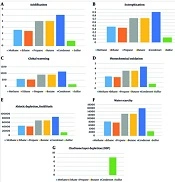
The results of each product's evaluation are presented separately in Figure 3. Figures 4 and 5 show a general comparison of each environmental parameter with all of the produced products.
 Environmental impact assessment of producing one ton of methane; (B) Environmental impact assessment of producing one ton of ethane; (C) Environmental impact assessment of producing one ton of propane; (D) Environmental impact assessment of producing one ton of butane; (E) Environmental impact assessment of producing one ton of gas condensate; (F) Environmental impact assessment of producing one ton of sulfur (<a href=\"#A127834REF13\">13</a>, <a href=\"#A127834REF25\">25</a>, <a href=\"#A127834REF26\">26</a>).")
(A) Environmental impact assessment of producing one ton of methane; (B) Environmental impact assessment of producing one ton of ethane; (C) Environmental impact assessment of producing one ton of propane; (D) Environmental impact assessment of producing one ton of butane; (E) Environmental impact assessment of producing one ton of gas condensate; (F) Environmental impact assessment of producing one ton of sulfur (13, 25, 26).

Contribution of production of each gas refinery product to acidification, eutrophication, global warming, photochemical oxidation, abiotic-element resource depletion, fossil fuel resources depletion, and water scarcity
 Impact of producing gas refinery products on acidification; (B) Impact of producing gas refinery products on eutrophication; (C) Impact of producing gas refinery products on global warming; (D) Impact of producing gas refinery products on photochemical oxidation; (E) Impact of producing gas refinery products on the depletion of abiotic elements; (F) Impact of producing gas refinery products on water scarcity; (G) Impact of producing gas refinery products on ozone layer depletion (<a href=\"#A127834REF22\">22</a>, <a href=\"#A127834REF27\">27</a>, <a href=\"#A127834REF28\">28</a>).")
(A) Impact of producing gas refinery products on acidification; (B) Impact of producing gas refinery products on eutrophication; (C) Impact of producing gas refinery products on global warming; (D) Impact of producing gas refinery products on photochemical oxidation; (E) Impact of producing gas refinery products on the depletion of abiotic elements; (F) Impact of producing gas refinery products on water scarcity; (G) Impact of producing gas refinery products on ozone layer depletion (22, 27, 28).
