1. Background
Vitamin D is crucial for maintaining women’s health. The adverse consequences of vitamin D deficiency can extend beyond a woman’s health to that of their offspring leading to preterm birth, impaired fetal skeleton formation, and childhood rickets (1). Empirical studies have uncovered many determinants of vitamin D deficiency; however, few have explored its relationship with socioeconomic status (2).
Sun exposure is a major source of vitamin D, followed by nutritional sources like oily fish and mushrooms (3). Sun avoiding behavior, such as wearing sunscreen for cosmetic reasons or otherwise, and sociocultural practices confining women within the household can diminish vitamin D levels. Furthermore, poverty and gender gaps in food security hinder women from accessing nutritional sources (4). These socioeconomic constraints shape our way of life and the daily health-related choices we make. These choices, in the long run, can have significant health implications.
2. Objectives
From this perspective, we conducted our study to analyze the socioeconomic aspects of women’s lives in eastern Nepal and its association with health outcomes such as vitamin D deficiency.
3. Methods
The data for this study has been obtained from a previous community-based study estimating vitamin D deficiency. The ethical approval for this study was received from the Institutional Review Committee of B.P Koirala Institute of Health Sciences.
3.1. Socioeconomic Status
The socioeconomic status was determined using the following indicators: Educational status, stipulating the highest degree achieved (primary school, middle school, high school or above), educational status of the head of the household (primary school, middle school, high school, and greater than high school), occupation of the woman and the head of the household (professional worker, semi-professional worker, clerical/shop owner/farmer, skilled or semi-skilled worker, unskilled worker, and unemployed) (5), total household income per month in Nepalese rupees (< 11,000, 12,000 - 24,000, 25,000 - 39,999, and ≥ 40,000), and income to poverty ratio. The ratio of a family’s income to their threshold income determined the income to poverty ratio. The official monetary threshold income based on the Central Bureau of Statistics in Nepal in local prices is NRs 19, 261 per person per year (6). The income to poverty ratio was then classified as poverty and near poverty: 0 - 1.9 ratio; middle income: 2 - 3.9 ratio; and high income: ≥ 4 ratio. Socioeconomic status (SES) was defined using the collective score of educational status and occupation of the head of the household and the total monthly family income (5).
3.2. Covariates
Several potential confounding variables were assessed, which included age group (below 45 years and 45 years or above), caste/ethnic groups (Khas Aryan, Adibasi Janajati, and Other: Madhesi, Newars, Marwadi), (7) marital status (married and other: Unmarried, divorced, widowed), and premenopausal and post-menopausal group. Physical activity (active: Exercises more than half an hour per day for at least five days per week, moderate: Exercises with a duration less than for active, and sedentary: Irregular exercise or no physical activity). Self-reported ailments included fatigue, aches and pains, gastritis, miscellaneous (tingling, numbness, gynecological complaints, hypertension, and allergies), and none.
3.3. Vitamin D Status
We obtained venous blood samples sterilely, centrifuged them, and separated the sera. Chemiluminescence Immunoassay (Maglumi 1000 analyzer SNIBE Co., Ltd., China) was used to measure serum 25(OH)D. Proper test performance was ensured by adherence to the operating instructions of Maglumi. Serum 25(OH)D was categorized as vitamin D deficient (< 20 ng/mL), insufficient (20 - 29 ng/mL), and sufficient (30 - 100 ng/mL) (8).
3.4. Statistical Analysis
Data were analyzed using IBM SPSS version 11 (SPSS Inc., Chicago, USA). Normality of data distribution was assessed with the Kolmogorov-Smirnov. The indicators of socioeconomic status and covariates were examined against different categories of vitamin D status by cross-tabulation. The chi-square test or Fischer’s exact test was employed to test the associations. P value < 0.05 was considered significant.
4. Results
4.1. Demographics
Out of 182 women, 103 (56.5%) had vitamin D deficiency, 61 (33.5%) had insufficiency, and 18 (9.9%) had sufficient vitamin D. 96 (52.7%) were aged 18 - 44, and 86 (47.3%) were above 45 years old. Caste/group distributions were as follows: Khas Aryan 75 (41.2%), Adibasi Janajati 72 (39.6), and others 35 (19.2%). Besides, 77 (42.3%) women were in the menopause stage, and 146 (80.2%) were married. Moreover, 87 (47.8%) did not report any ailments, while 34 (18.7%) complained of aches and pains, and 20 (10.9%) complained of fatigue.
4.2. Socioeconomic Status
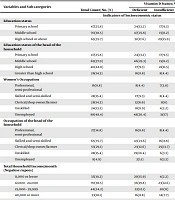
Overall, 8 (4.4%) participants were living below the poverty line, 30 (16.5%) near the poverty line, and 144 (79.1%) above the poverty line. Most women, 70 (38.5%), and the heads of the household, 69 (37.9%), were educated till middle school. Also, 88 (48.4%) women were unemployed, 28 (15.4%) had skilled or semi-skilled work, 26 (14.3%) were clerical/shop owners/farmers, and 24 (13.2%) had unskilled jobs. The majority of the heads of the household had skilled or semi-skilled work, 65 (35.7%). The majority, 70 (38.5%), had a monthly income between 12,000 - 24,000 rupees. Also, 44 (24.2%) had a monthly income above 25,000 but below 40,000 rupees, and 33 (18.1%) had a monthly income above 40,000 rupees. Out of the total 48.4% belonged to lower-class families and 20.9% had income near or below the poverty line (Table 1).
| Variables and Sub-categories | Total Count; No. (%) | Vitamin D Status; No. (%) | P-Value a | ||
|---|---|---|---|---|---|
| Deficient | Insufficient | Sufficient | |||
| Indicators of Socioeconomic Status | |||||
| Education status | 0.05 | ||||
| Primary school | 47 (25.8) | 24 (13.2) | 17 (9.3) | 6 (3.3) | |
| Middle school | 70 (38.5) | 47 (25.8) | 15 (8.2) | 8 (4.4) | |
| High school or above | 65 (35.7) | 32 (17.6) | 29 (15.9) | 4 (2.2) | |
| Education status of the head of the household | 0.06 | ||||
| Primary school | 47 (25.8) | 24 (13.2) | 17 (9.3) | 6 (3.3) | |
| Middle school | 69 (37.9) | 46 (25.3) | 15 (8.2) | 8 (4.4) | |
| High school | 40 (22.0) | 17 (9.3) | 21 (11.5) | 2 (1.1) | |
| Greater than high school | 26 (14.3) | 16 (8.8) | 8 (4.4) | 2 (1.1) | |
| Women’s occupation | 0.6 | ||||
| Professional, semi-professional | 16 (8.8) | 8 (4.4) | 7 (3.8) | 1 (0.5) | |
| Skilled and semi-skilled | 28 (15.4) | 17 (9.3) | 8 (4.4) | 3 (1.6) | |
| Clerical/shop owner/farmer | 26 (14.3) | 12 (6.6) | 11 (6) | 3 (1.6) | |
| Unskilled | 24 (13.2) | 18 (9.9) | 4 (2.2) | 2 (1.1) | |
| Unemployed | 88 (48.4) | 48 (26.4) | 31 (17) | 9 (4.9) | |
| Occupation of the head of the household | 0.06 | ||||
| Professional, semi-professional | 27 (14.8) | 16 (8.8) | 8 (4.4) | 3 (1.6) | |
| Skilled and semi-skilled | 65 (35.7) | 43 (23.6) | 16 (8.8) | 6 (3.3) | |
| Clerical/shop owner/farmer | 53 (29.1) | 23 (12.6) | 25 (13.7) | 5 (2.7) | |
| Unskilled | 28 (15.4) | 19 (10.4) | 6 (3.3) | 3 (1.6) | |
| Unemployed | 9 (4.9) | 2 (1.1) | 6 (3.3) | 1 (0.5) | |
| Total household income/month (Nepalese rupees) | 0.006 b | ||||
| 11,000 or lesser | 35 (19.2) | 29 (15.9) | 4 (2.2) | 2 (1.1) | |
| 12,000 - 24,000 | 70 (38.5) | 36 (19.8) | 23 (12.6) | 11 (6) | |
| 25,000 - 39,999 | 44 (24.2) | 22 (12.1) | 20 (11) | 2 (1.1) | |
| 40,000 or more | 33 (18.1) | 16 (8.8) | 14 (7.7) | 3 (1.6) | |
| Income to poverty ratio | 0.005 c | ||||
| Poverty and near poverty | 38 (20.9) | 31 (17) | 6 (3.3) | 1 (0.5) | |
| Middle income | 63 (34.6) | 34 (18.7) | 20 (11) | 9 (4.9) | |
| High income | 81 (44.5) | 38 (20.9) | 35 (19.2) | 8 (4.4) | |
| Socioeconomic status | 0.7 | ||||
| Upper middle or above | 41 (22.5) | 24 (13.2) | 14 (7.7) | 3 (1.6) | |
| Lower middle | 53 (29.1) | 27 (14.8) | 21 (11.5) | 5 (2.7) | |
| Lower class | 88 (48.4) | 52 (28.6) | 26 (14.3) | 10 (5.5) | |
| Covariates | |||||
| Age groups | 0.5 | ||||
| Below 45 years | 96 (52.7) | 51 (28) | 36 (19.8) | 9 (4.9) | |
| 45 years or above | 86 (47.3) | 52 (28.6) | 25 (13.7) | 9 (4.9) | |
| Caste/ethnic groups | 0.6 | ||||
| Khas Aryan | 75 (41.2) | 46 (22.5) | 26 (14.3) | 8 (4.4) | |
| Adibasi Janajati | 72 (39.6) | 45 (24.7) | 22 (12.1) | 5 (2.7) | |
| Others | 35 (19.2) | 17 (9.3) | 13 (7.1) | 5 (2.7) | |
| Menstrual status | 0.6 | ||||
| Menopause | 77 (42.3) | 46 (25.3) | 23 (12.6) | 8 (4.4) | |
| Not menopause | 105 (57.7) | 57 (31.3) | 38 (20.9) | 10 (5.5) | |
| Marital status | 0.1 | ||||
| Married | 146 (80.2) | 87 (47.8) | 44 (24.2) | 15 (8.2) | |
| Other | 36 (19.8) | 16 (8.8) | 17 (9.3) | 3 (1.6) | |
| Physical activities | 0.9 | ||||
| Moderate | 41 (22.5) | 22 (12.1) | 15 (8.2) | 4 (2.2) | |
| Active | 43 (23.6) | 27 (14.8) | 12 (6.6) | 4 (2.2) | |
| Sedentary | 98 (53.8) | 54 (29.7) | 34 (18.7) | 10 (5.5) | |
| Self-reported ailments | 0.9 | ||||
| Fatigue | 20 (10.9) | 13 (7.1) | 6 (3.3) | 1 (0.5) | |
| Aches and pains | 34 (18.7) | 18 (9.9) | 12 (6.6) | 4 (2.2) | |
| Gastritis | 11 (6) | 7 (3.8) | 3 (1.6) | 1 (0.5) | |
| Miscellaneous | 30 (16.5) | 15 (8.2) | 11 (6) | 4 (2.2) | |
| None | 87 (47.8) | 50 (27.5) | 29 (15.9) | 8 (4.4) | |
Serum 25(OH)D Status Amongst Baseline Variables a
4.3. Vitamin D (Serum 25(OH)D)
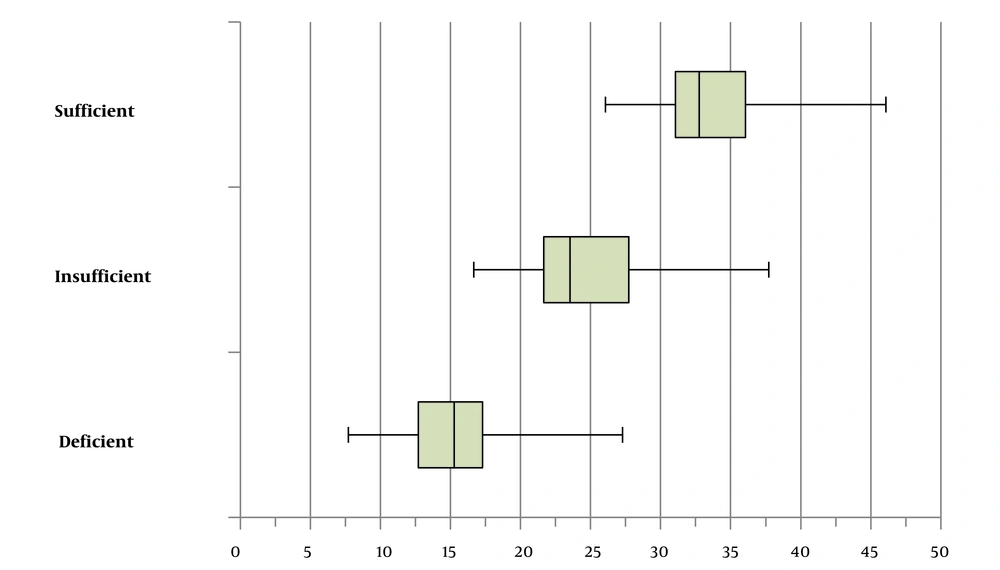
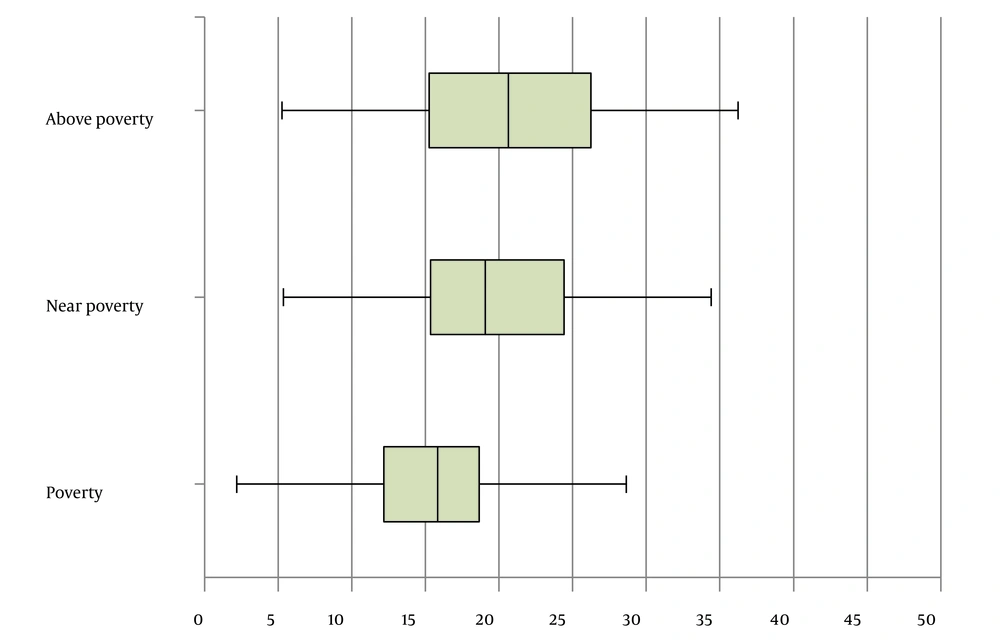
The median (25th - 75th) serum 25(OH)D was 18.6 (14.3 - 23.9). The median serum 25(OH)D was 15.3 ng/mL (12.7 - 17.3), 23.5 ng/mL (21.7 - 27.7), and 32.8 ng/mL (31 - 36.1) for vitamin D deficient, insufficient, and sufficient groups, respectively. (Figure 1) Similarly, among categories of the income to poverty ratio, the median serum 25(OH)D was 15.8 (12.1 - 18.6) ng/mL, 19 (15.3 - 24.4) ng/mL, and 20.6 ng/mL (15.2 - 26.2) for living in poverty, near poverty, and above poverty, respectively (P = 0.008 from Kruskal-Wallis test). (Figure 2) There was a significant association between vitamin D status and total household income per month (P = 0.006; Fischer’s exact test) and the income to poverty ratio (P = 0.005; Chi-square test) (Table 1).
Box-and-Whisker plot showing median vitamin D among vitamin D status groups (deficient, insufficient, and sufficient). The median (25th-75th) serum 25(OH)D was 15.3 (12.7 - 17.3) in vitamin D deficient, 23.5 (21.7 - 27.7) in vitamin D insufficient, and 32.8 (31 - 36.1) in vitamin D sufficient categories.
Box-and-Whisker plot showing median vitamin D in groups with different living standards (above poverty, near poverty, and poverty).; The median (25th - 75th) serum 25(OH)D was 15.8 (12.1 - 18.6), 19(15.3 - 24.4), and 20.6 (15.2 - 26.2) for living in poverty, near poverty, and above poverty groups, respectively (P = 0.008, from Kruskal-Wallis test).
5. Discussion
Vitamin D deficiency affects one billion people worldwide, with a higher prevalence in women (9). In our study, more than half the study population had vitamin D deficiency (serum 25(OH)D level < 20 ng/mL), while one-fourth had vitamin D insufficiency (serum 25(OH)D level 20 - 29 ng/mL). We explored if such a high prevalence was attributed to socioeconomic factors.
We investigated many socioeconomic indicators of women in eastern Nepal. Overall, 38 (20.9%) lived below or near the poverty line. This was comparable to the national data, where 25.2% of the population fell under the poverty line using the national poverty threshold (10). The income to poverty ratio considers the number of mouths to be fed in proportion to the family’s income and thus reflects if the family can purchase adequate amounts for each member. In our study, this was well reflected, as vitamin D deficiency was more prevalent in impoverished families.
There was a significant association between vitamin D deficiency and lower income. Our finding was in agreement with many empirical studies conducted earlier displaying a significant correlation between household income and vitamin D status (2, 11). Lower income restrains the purchasing power directing money to fulfill daily necessities such as food, clothing, and shelter rather than buying vitamin D supplements or fortified food. The quality of food purchased itself may be substandard and unable to fulfill the daily needs of vitamin D.
We also found that 48.4% of our participants were unemployed, thus not contributing to the total household income. This highlights the need for the economic empowerment of women. As total household income is the gross income generated by all family members, having an unemployed member can significantly bring it down.
Other individual indicators of SES as education and occupation did not show significant association with vitamin D status. Besides the individual indicators of SES, we also generated an aggregate using Kuppuswamy’s Socioeconomic Status tool. Categorizing into such socioeconomic class considers not only monetary terms but also education and occupation. Many studies have demonstrated a significant association between vitamin D deficiency and lower socioeconomic status (12, 13). However, we did not find any significant association between socioeconomic status and vitamin D.
5.1. Conclusions
Our findings show that women living in low-income houses and poverty have a higher prevalence of vitamin D deficiency. This study highlights the need for economic empowerment of women and establishing food fortification and nutrient supplementation programs.


