


1. Background
Social determinants of health are described as "conditions in the places where people live, learn, work, and play, that impact many health risks and outcomes" (1). The causal priority is ascribed to the environmental factors of childhood in considering the social gradient in mental health, a concept known as the "indirect selection of health services" hypothesis (2, 3).
An important point is that the interpretation of the SDoH, social risk factors, and health-related social needs is critical to creating equitable health and care for all communities. One of the crucial factors for this is the socioeconomic status of the population in society (4).
Social mobility refers to the study of change and denotes the movement of social status relative to the social position of parents within a given society (5). On the other hand, the role of social mobility as a social determinant of health has been demonstrated in various studies. According to Health selection theory, mental disorders either restrict upward mobility or cause it to decline, thereby influencing an individual's SES (6, 7).
The socioeconomic status of an individual is influenced by the combination of socioeconomic, cultural, and political contexts, while subjective social status quantifies their perception of their social standing relative to others and is empirically and theoretically positively related to health and well-being (8, 9). Socioeconomic status can play a dual role in epidemiological studies: It can serve as a predictor of health outcomes and act as a confounding factor that needs to be considered for control to understand the relationship between health outcomes and other significant factors (10).
Regarding SES, it includes both objective and subjective components. The objective component comprises markers of parental education, occupation, or income, while the subjective component involves adults' perception of their family's SES (3). Regardless of the social ladder someone occupies, they are more likely to be healthy and happy than those below them in the hierarchy and worse off in health and happiness than those above. Iranian society, like all societies exposed to economic, social, cultural, and political changes, has seen shifts in its foundations of past life (11, 12).
Iranian society, like all societies that have been exposed to economic, social, cultural, and political changes, the foundations of its past life have been changed. Several studies have shown that Iranian society has become more open in recent decades due to increasing opportunities for upward social mobility (13, 14). Numerous studies indicate that subjective social status is linked to human health measures, with the assumption being that upward mobility has positive psychological effects (6). Life satisfaction, as the primary component of subjective well-being, is often used as the sole measure of subjective well-being in many studies (15). A study found significant associations between subjective SES, well-being, and social mobility (16). Shaked et al. reported changes in the impact of subjective social status on health by gender and ethnicity (17). In a study by Kim et al., groups experiencing both subjective downward and upward mobility reported more depressive symptoms than those remaining in middle or upper social status (6). However, there are gaps in the current state of knowledge on this topic. Rasht is a metropolis city with large disparities in the level of development across its regions. Historical evidence indicates that both women and men have been active in all aspects of public and social life, as well as in various occupations, in this region (18). Despite this progress, subjective mobility in Rasht has not been studied, prompting this paper to fill this research gap.
2. Objectives
As middle-aged women transition into the stage between adulthood and old age, it is important to prioritize their life satisfaction, especially considering that this period now constitutes almost half of their lifespan. This is particularly crucial given the increasing life expectancy worldwide. Our study has three main objectives: To examine how subjective socioeconomic status impacts the life satisfaction of middle-aged women, to investigate the link between subjective social mobility and life satisfaction in women, and to compare the subjective social mobility and life satisfaction of participants from different socioeconomic statuses in various residential areas of Rasht city.
3. Methods
3.1. Study Design, Setting, and Sample
This was a cross-sectional study conducted from January 2020 to June 2021, investigating the relationship between SES, subjective social mobility, and life satisfaction among married women in Rasht (aged 30 to 65).
Guilan province is situated between 36°34 0 and 38°27 0 north and 48°53 0 to 50°34 0 south. The metropolis of Rasht, the capital of Gilan Province, is located in the central plain of the province and is one of the northern cities of Iran. Based on research using a taxonomy model, five regions in this city were ranked according to their development level. The findings indicated that regions one and two of Rasht, in terms of development, were in a more favorable situation and were divided into developed zones; zones 3 and 4 were in a developing area, and zone five was the least developed area (18). Cluster random sampling was utilized due to the population distribution, with samples chosen from each area based on population size. The sample size was estimated using the Krejcie and Morgan table, indicating a sample of 384 for a population exceeding 100 000. The optimal size of each cluster and the design effects were calculated based on a design efficiency of 2. This indicates that cluster sampling requires double the initial sample size. Therefore, 768 individuals were needed for the study. In the end, 800 respondents were included in self-reported surveys.
Exclusion criteria were as follows: (1) Age < 30 and > 65 years; (2) missed responses for >10% of the total items; and (3) participants who reported missing a family member during the past few months. Based on these criteria, 16 surveys were excluded from the analyses, leaving 784 (98%) valid samples.
3.2. Measures
The data collection tool consisted of characteristics. Subjective “scale” measures of socioeconomic status (SES) are easy-to-administer instruments that ask respondents to rate their own SES, allowing them to assess their material resources (10). The MacArthur Scale was used to measure the SES of candidates during childhood (8). "Ladders" visual aids were used to measure the family's socio-economic status and the individual's societal position from 1 to 10 (ladder). The lowest level is denoted by the first number (19), while the highest number is represented by the 10th number. Scholars have revealed that a rating scale is more effective in showing the relationship between individual mental health and SES than traditional objective indicators (10, 20).
Our main dependent variable measures whether respondents think their current life status is superior or inferior to that of their parents when they were youths. This was evaluated by asking respondents to compare their current situation with that of their parents in various categories. What social class do you think your family was in when you were 14 years old: (1) (Lower class of society), (2) (Lower middle class), (3) (Middle class), (4) (Upper middle class), (5), (The upper class in society)”. “If you compare your current situation with parents, in which category do you think you are? (1) (Lower class of society), (2) (Lower middle class), (3) (Middle class), (4) (Upper middle class), (5) (Upper class of society)”. "If you compare your present situation to that of your parents, in which category do you think you are? (1) (Much better), (2) (Better), (3) (Nearly the same), (4) (Worse), (5) (Much worse)” (21).
The instrument used to measure life satisfaction was the Quality-of-Life Index (QLI) scale, arranged by Ferrans (22). The present general version of this tool includes 33 elements for each of the two satisfaction and importance sections. The satisfaction data section was used for this survey. In an investigation carried out by Rafiei et al. , the reliability of the questionnaire was estimated using internal coherence. Cronbach's alpha ranged between 0.74 and 0.90 (23).
3.3. Statistical Analysis
Preliminary data analyses were carried out with SPSS 22.0. Firstly, we report Rashtian women’s average life satisfaction and standard deviation. Furthermore, the status of subjective SES among participants and their parents will explain. The relationship between mean life satisfaction and socio-economic status will be described in the one-way ANOVA test. Secondly, the existence of a statistically significant difference in women's subjective social status with respect to their parents will be tested. A two-sided P-value < 0.05 was reported to be statistically significant.
3.4. Ethical Considerations
Participants gave active consent and were informed that data would be anonymized. Ethical approval was gained from the Ethics Assessment Committee of the Tehran University of Social Welfare and Rehabilitation Sciences (IR.USWR.REC.1398.200).
4. Results
Out of the 800 participants involved in this investigation, a total of 16 questionnaires were deemed ineligible for the final analysis due to incomplete information. The average age of women, with a standard deviation of 9.27, was recorded as 42.01 years. In terms of educational attainment, the majority of these women (60.3%) possessed a bachelor's degree or higher. The mean age at the time of marriage was calculated to be 24.30 years, with a standard deviation of 5.40. A significant proportion of the women (73.5%) were born in urban areas. Many women were employed, while 32.7% were housewives. A majority of the husbands had a bachelor's degree (55.7%). A significant portion of participants reported an average monthly income (34.4%).
The mean (SD) of the women’s life satisfaction score was 37.24 ± 23.65. The range of obtained scores varied from -45 to 80.
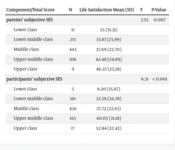
28.6% of women (n = 224) reported they had been raised in a low or very low-SES family. Also, most of the participants' parents (n = 443 or 56.5%) were of the middle class. But the participants' current socio-economic status was reported as follows: 21.1% of them (n = 166) were in the low or very low social group. The majority of them were in the middle group of society (55.6%), and the rest of the women (23.2%) were in the two high or very high groups in terms of socio-economic (Table 1).
| Component/Total Score | N | Life Satisfaction Mean (SD) | F | P-Value |
|---|---|---|---|---|
| parents’ subjective SES | 3.55 | 0.007 | ||
| Lower class | 11 | 25 (31.31) | ||
| Lower middle class | 213 | 33.87 (23.99) | ||
| Middle class | 443 | 37.69 (22.70) | ||
| Upper middle class | 108 | 42.48 (24.89) | ||
| Upper class | 9 | 46.22 (23.28) | ||
| participants’ subjective SES | 6.31 | < 0.001 | ||
| Lower class | 5 | 8.20 (35.87) | ||
| Lower middle class | 161 | 32.29 (26.78) | ||
| Middle class | 436 | 37.72 (22.63) | ||
| Upper middle class | 165 | 40.05 (21.18) | ||
| Upper class | 17 | 52.94 (22.42) |
One way ANOVA Analysis of the Associations Between Life Satisfaction and Subjective Socio-economic Status
The participant's responses to the visual diagram depicting the socio-economic ladder for themselves and their parents are detailed in Table 2. The majority of women in the study placed themselves and their parents on the 5th or 6th rung of the ladder (67.7% versus 69.9%). Comparing the responses, it is evident that Rasht women perceive their current socio-economic status more positively than that of their parents. When asked to evaluate their living situation, in comparison with their parents, 44.7% indicated it was better or much better. 20.5% said it was the same, and 34.8% stated it was worse or more inferior.
| Rungs of Visual Ladder | Parents' Subjective SES on Social Ladder | Participants' Subjective SES on Social Ladder |
|---|---|---|
| 1 | 0 (0) | 0 (0) |
| 2 | 11 (1.4) | 16 (2.0) |
| 3 | 208 (26.5) | 138 (17.6) |
| 4 | 8 (1.0) | 23 (2.9) |
| 5 | 440 (56.1) | 352 (44.9) |
| 6 | 108 (13.8) | 179 (22.8) |
| 7 | 0 (0) | 51 (6.5) |
| 8 | 9 (1.1) | 24 (3.1) |
| 9 | 0 (0) | 1 (0.1) |
| 10 | 0 (0) | 0 (0) |
Frequency of Women Response to Parents’ Socioeconomic Placement in Society and Its Comparison with Personal Socioeconomic Placement on Visual Ladder a
According to Table 3, the matrix shows how participants view their social mobility compared to their parents. The numbers on the diagonal indicate immobility in women, while numbers above the diagonal show upward mobility. Results reveal 114 participants (14.54%) experienced downward mobility, 228 women (29%) moved up, and 442 (56.37%) stayed the same as their parents' socio-economic status. Those without intergenerational social mobility had the highest life satisfaction average (38.73), while those who experienced downward mobility had the lowest score (33.38). A partial correlation test with control of residence area found no significant relationship between social mobility and life satisfaction (r = 0.015, P = 0.68). Table 1 categorizes life satisfaction based on parents' socio-economic status. A one-way analysis of variance showed a significant difference in life satisfaction among groups (F = 3.55, P = 0.007).
| Participants’ Subjective SES | Parents’ Subjective SES | Sum | ||||
|---|---|---|---|---|---|---|
| Upper Class | Upper Middle Class | Middle Class | Lower Middle Class | Lower Class | ||
| Upper class | 6 (35.3) | 6 (35.3) | 4 (23.5) | 1 (5.9) | 0 (0) | 17 |
| Upper middle class | 3 (1.8) | 54 (32.7) | 84 (50.9) | 24 (14.5) | 0 (0) | 165 |
| middle class | 0 (0) | 41 (9.4) | 293 (67.2) | 99 (22.7) | 3 (0.7) | 436 |
| Lower middle class | 0 (0) | 7 (4.3) | 59 (36.6) | 88 (54.7) | 7 (4.3) | 161 |
| Lower class | 0 (0) | 0 (0) | 0 (0) | 4 (80) | 1 (20) | 5 |
Matrix of Intergenerational Subjective Social Mobility of Women in Comparison with the Status of Parents
As shown, there was a significantly different life satisfaction score and subjective SES status among the participants (F = 6.31, P < 0.001). The lowest average life satisfaction score was in the low socioeconomic status group, and the highest score was associated with the high society group. Other results of the ANOVA test showed that there was no significant association between women's life satisfaction in different zones of the city of Rasht (F = 1.59, P = 0.17). In the last step, the influence of subjective social mobility on the participants' life satisfaction was determined using linear regression analysis. The result showed that there was no significant difference in the satisfaction of different social mobility groups of women (P = 0.60).
5. Discussion
The participants in the study were mostly from middle SES backgrounds, and most reported they were better off than their parents. Previous studies have suggested that subjective social class has a stronger link to mental well-being than objective social class (24).
The first objective of our study was to examine the correlation between subjective socioeconomic status and the life satisfaction of women. Consistent with earlier research (15, 24-26), the findings of our study illustrate the association between subjective socioeconomic status and life satisfaction among females. Women with higher SES backgrounds tended to report higher levels of satisfaction. This adds to the evidence that people who perceive themselves as having a higher subjective SES are generally happier (25). When individuals self-report being part of a lower social class, they are actually stating that they have fewer resources and are subordinate to others (24). Importantly, previous studies have demonstrated that perceptions with lower subjective social status evoke a range of negative emotions (27).
The second goal of the study was to investigate the relationship between subjective social mobility and life satisfaction. Scholars have studied relations between either upward or downward mobility and psychological experiences, and have shown that downward mobility is detrimental to subjective well-being and mental health (6). On the other hand, some studies found no relation between upward social mobility and mental health (28).
The findings of our study confirm the relationship between downward mobility in people and lower life satisfaction in them. However, there was no seen correlation between upward subjective social mobility or no mobility and life satisfaction.
According to our results, the life satisfaction of study participants was at a moderate level. This conclusion is supported by previous literature (29). It is well-established that life satisfaction is crucial for overall well-being and can predict mental health issues in adults (30).
5.1. Strengths
In our study, participants who experienced downward mobility reported the lowest satisfaction scores. There was no statistically significant relationship between subjective social mobility and the state of satisfaction with life. However, Huang et al. confirmed in their study the indirect path from mental mobility to mental well-being (31). But Tang's findings suggest that upward social mobility advancement yields reduced benefits in life satisfaction when individuals are unable to successfully integrate their experiences into what their objective social class should be (32).
5.2. Limitations
Like each study, ours has shortcomings. Firstly, the cross-sectional design of our study means that we cannot infer causality from our results. To address this, future research should use longitudinal data to investigate these trends over time. Secondly, our study was observational, and all participants volunteered to complete the questionnaire. Furthermore, our study only focused on married women, and we recommend that future studies also consider the experiences of single women. Despite these limitations, our study is the first to explore the relationship between subjective social mobility and life satisfaction in Iran. We hope that our findings will inspire further research in this area.
5.3. Conclusions
It seems that people are likely to feel pessimism and hopelessness when they compare their social and economic status to others and are put in a lower situation, are likely to experience pessimism and hopelessness. If the living conditions are evaluated negatively, this can influence and change many behaviors and attitudes toward the individual and social circumstances. Given the findings, we call for more scientific attention to the subjective aspects of social mobility in health research. Further research can highlight the mechanisms that link social mobility to inequalities in adult well-being to identify intervention goals and policies.
