1. Background
In 1969, water pollution was defined as the increase in any material, including chemical, physical, or biological type that changes its quality and plays a crucial role in its particular application (1). Lead is a toxic metal that has a poor electrical conductivity (2). This metal can be dangerous and poisonous even in low concentrations (3). Disorders of learning and behavior in children, damage to organs, liver, kidney, and heart are the consequences of lead contamination (4). Nowadays, many companies are producing chemical materials for removing heavy metals from sewage systems. Furthermore, some of these products have been used in order to remove heavy metals from water resources (5). Lead metal ion is found mainly in industrial wastewaters (6). Wastewaters of various industries such as plating metals, phosphate fertilizers, mining, colors, stabilizers, and alloy industries are considered among the main sources for the production of lead in environment. Currently, there are many methods for reduction of the pollution from water and soil, including filtration, coagulation, oxidation, and ion exchange (7), but most of these methods are time-consuming, costly, and inefficient. Today, the trend is to find simple and economical methods, which have the same efficiency for sewage treatment, particularly in the developing countries that are unable to use expensive methods. Recently, the technology of adsorbents based on the process of ion exchange, physical, and chemical adsorption has an improving application. Sawdust is a low-cost by-product (produced widely in the woodcutting industries), which has adsorption and ion exchange characteristics. Studies show its feasible application for adsorption of various metal ions. Hashemi Sharaf Abad conducted a research on removal of metals (lead, chromium, and cobalt) from the aqueous solution by a mixture of sawdust adsorbents and the stalk of Persian turpentine tree. According to the result, the highest rate of metals removal for lead, chromium and cobalt were 67.43%, 46.57 %, and 17.70%, respectively in the concentration of 10 ppm, and obviously the rate of lead removal was higher than other metals (8). In a research entitled “the adsorption of cobalt from aqueous solution by active coal produced from the wood of fig tree” conducted by Miritarhan, the results showed that this adsorbent has a high capacity for removing cobalt from the polluted aqueous solutions (9). Also, in a research entitled “the analysis of the efficiency of wood ash in removing cadmium from the sewage of color-producing industries” (Binalood, Kerman, Iran), which was conducted by Malakootian, the results showed that wood ash has high efficiency of 97% to 98% in removing cadmium along with the increase in the quantity of adsorbent to 100 g/L (10).
2. Objectives
This research aims to achieve an efficient and profitable method for removing lead from synthetic wastewater. For the same reason, it is intended to measure the removal capability and analyze the sawdust of Prosopis mimosaceae which is a native species in Khuzestan province.
3. Materials and Methods
3.1. Preparation of the Adsorbent
After collection of sawdust adsorbent of Prosopis Mimosaceae, the particles were first homogenized (by mesh No. 35) and then washed with distilled water to remove dust and other pollution. Next, they were dried in an oven at 30°C.
3.2. The Preparation of Synthetic Solutions
Lead nitrate was used to make synthetic solution. For this purpose, a preliminary main lead solution with the concentration of 25 mg/L was prepared. Then, the other concentrations were prepared by diluting the main solution. All the applied chemicals were purchased from Merck Company. The experimental stages were conducted at 20°C and the remained concentration of the metal was determined by atomic adsorption spectrophotometer (11). Moreover, all experiments were replicated three times and the mean of the results were accounted.
3.3. The Effect of pH on the Efficiency of Lead Removal
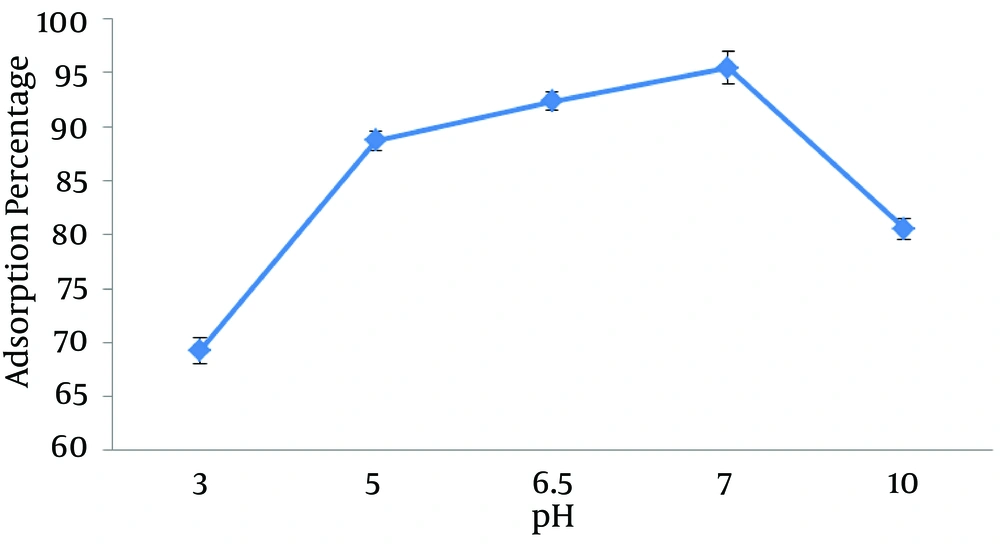
For determination of optimum pH, it was set in the range of 3 to 10. After adjustment of pH using hydrochloric acid and sodium hydroxide solution (0.1 N), given the other parameters fixed, 0.5 g of sawdust was added to 50 mL of the lead sample with concentration of 10 mg/L. After 30 minutes, the concentration of remained lead was determined.
3.4. The Effect of Adsorbent Quantity on the Efficiency of Lead Removal
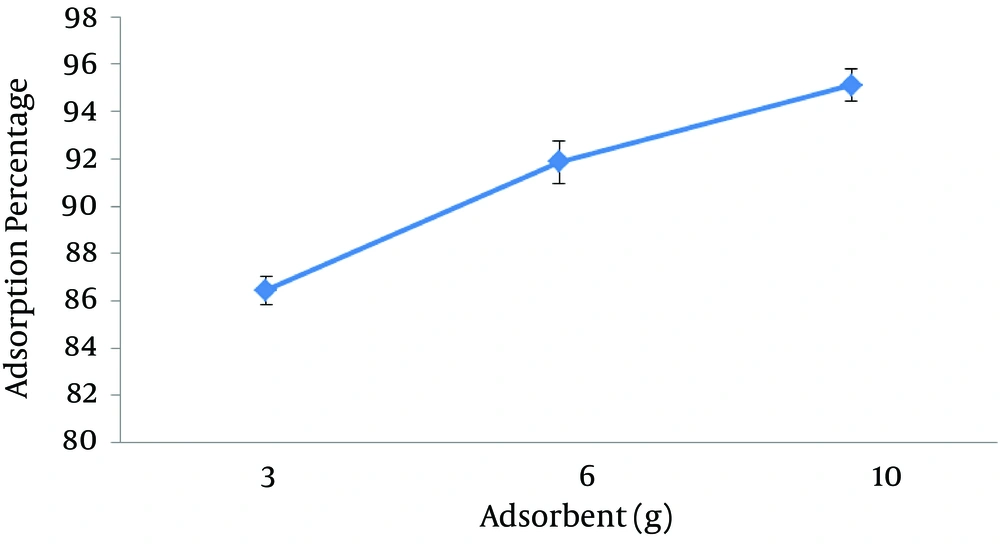
In this step, in order to determine the optimum quantity of adsorbent, given all other parameters fixed, 0.15, 0.3, and 0.5 g of sawdust were added to 50 mL solution with the initial lead concentration of 10 mg/L with the optimum gained pH from the previous stage. After 30 minutes of contact time, the concentration of the remained lead in the solution was determined.
3.5. The Effect of Contact Time on the Quantity of Lead Adsorption
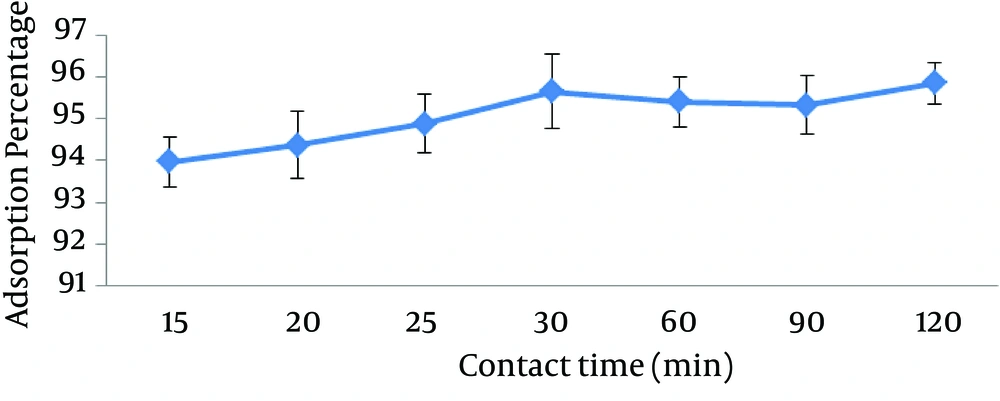
Regarding the study of time effect, (given other parameters fixed) 50-mL solutions with the initial lead concentration of 10 mg/L were prepared, and then the optimum quantities of sawdust and pH were added and adjusted to the solutions and the samples were brought out from the mixer at intervals between 15 to 120 minutes and analyzed.
3.6. The Effect of Initial Concentration of Lead on Efficiency of Lead Removal
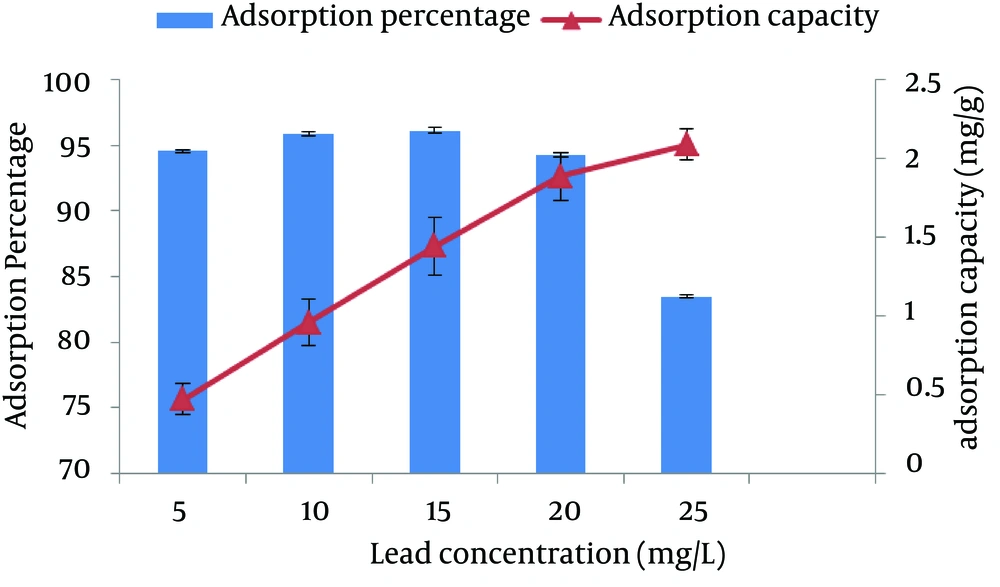
In order to test the effect of initial concentration of lead on the adsorption quantity, considering initial concentration as variable and the other parameters fixed, 50-mL solutions were prepared with the initial concentrations of 5, 10, 15, 20, 25 mg/L and analyzed after adjustment and adding the optimum quantity of pH and sawdust at the optimum contact time obtained in the previous stage.
3.7. The Morphological Study of Sawdust
The scanning electron microscope (SEM) photomicrograph of adsorbent using particle size analyzer revealed a considerable variation in particle size. In this stage, SEM was used in order to identify the morphology, which showed how lead is absorbed by Prosopis Mimosaceae sawdust.
4. Results
4.1. The Examination of pH Effect on lead Removal
Figure 1 shows the effect of various pH on the adsorption percentage. Based on the obtained results, with the increase in pH (up to 7), the removal efficiency increased and then decreased. According to the conducted studies, in acidic pH, the concentration of hydrogen ion in the solution is high and competes with the lead for sitting on the adsorption places so lead adsorption would be decreased, however, at higher pH, the concentration of hydroxyl ion will be high and lead deposits are being observed and adsorption rate would be decreased.
4.2. Effect of Adsorbent Quantity on the Adsorption Rate of Lead
The results of the effect of adsorbent quantity on the adsorption of lead are presented in Figure 2. The results showed that the removal percentage of lead by sawdust of Prosopis Mimosaceae increases as the adsorbent quantity increases, which results from higher contact surface of adsorbent with lead, in other words, increase in efficiency of adsorption.
4.3. The Effect of Contact Time on the Adsorption Rate of Lead
The results of different contact time on the adsorption rate of lead are shown in Figure 3. According to the results, the removal efficiency increases with the increase in contact time up to 30 minutes, but as the time passes 60 minutes, adsorption rate decreases and with more passing time, adsorption rate increases again. This is due to the reversibility of adsorption process. At first, adsorption reaction starts and with more passing time, the reverse reaction develops. Finally, after passing a certain time, this cycle increases and the decrease of concentration would be fixed, that this behavior does not signify the cease of forward and backward reactions. However, these reactions are still current and with equal velocities, thereby maintaining the concentration, that in this case, the reaction has reached dynamic equilibrium (not static). As stated in the results, the highest rate of adsorption was seen at the contact time of 120 minutes, but the adsorption quantity at 120 minutes was not different considerably with the adsorption quantity at 30 minutes. Considering the time importance at adsorption process, the optimum contact time of lead was determined at 30 minutes.
4.4. The Effect of Initial Concentration of Lead on the Removal Percentage and Adsorption Capacity of Lead
The quantity of adsorbed substance (adsorption capacity) is defined as follows:
qe = (Co - Ce) × V/W
Where Co is the initial concentration of adsorbed substance (mg/L), Ce is the concentration of the adsorbed substance after adsorption (mg/L), V is the volume of the solution (L), and W is the weight of adsorbent substance (g). Figure 4 shows the results of the initial concentration effect of lead on adsorption. The results showed that with the increase in the initial concentration of lead, the quantity of adsorbed substance (adsorption capacity) increases and adsorption percentage first increased and then decreased. This issue can be concluded from having more free bands of adsorbent and bands of ion exchange in high concentrations of lead. Furthermore, in batch adsorption systems, the input concentration of lead in the solution plays a crucial role as the motivational force for overcoming the resistance from the mass transfer between liquid and solid phases. Therefore, with the increase in lead concentration in the solution, the adsorption capacity of lead increases. It is noteworthy that with increase in concentration from 15 to 25 mg/L, the absorbed substance (qe) increases slightly and adsorption percentage decreases, which shows the saturation of sawdust.
4.5. Isotherms Studies of Lead Adsorption by Prosopis Mimosaceae Sawdust
Analytical information was obtained from isotherms in order to improve the equation, which is necessary for designing. Furthermore, adsorption isotherm can be used to describe the reaction of adsorbing substance with adsorbent as well as optimizing the quantity of adsorbent application (12).
4.5.1. Langmuir Isotherm
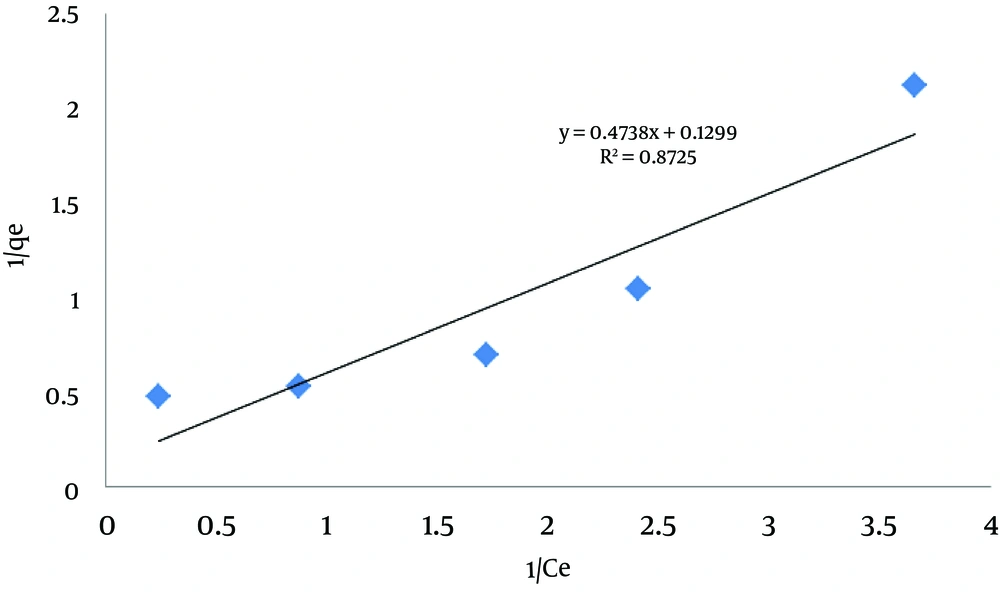
The linear form of Langmuir equation is as follows (13-15)
1/qe = (1/qm) + (1/qm × k1 ×Ce)
Where qe is the amount of adsorbed substance (mg/g), qm and k1 are Langmuir parameters that are related to the maximum adsorption capacity and the correlation energy of adsorption, respectively. The quantities of qm and k1 can be determined by drawing the changes of 1/qe based on 1/Ce. The main characteristic of Langmuir equation is a dimensionless constant, called equilibrium parameter that is defined as follows:
RL = 1/(1+K1 × C0)
Where, RL stands for the type of isotherm, 0 < RL < 1 for optimum adsorption, RL > 1 for non-optimum adsorption, RL = 1 for linear adsorption, and RL = 0 for irreversible adsorption (16). The results of Langmuir isotherm analysis are shown in Figure 5Table 1. According to the results of RL = 0.127 and correlation coefficient of R2 = 0.8725, the obtained data are conformed to Langmuir isotherm.
| RL | K1 | qm |
|---|---|---|
| 0.127 | 0.272 | 7.751 |
Results of Langmuir Isotherm Calculations
4.5.2. Freundlich Isotherm
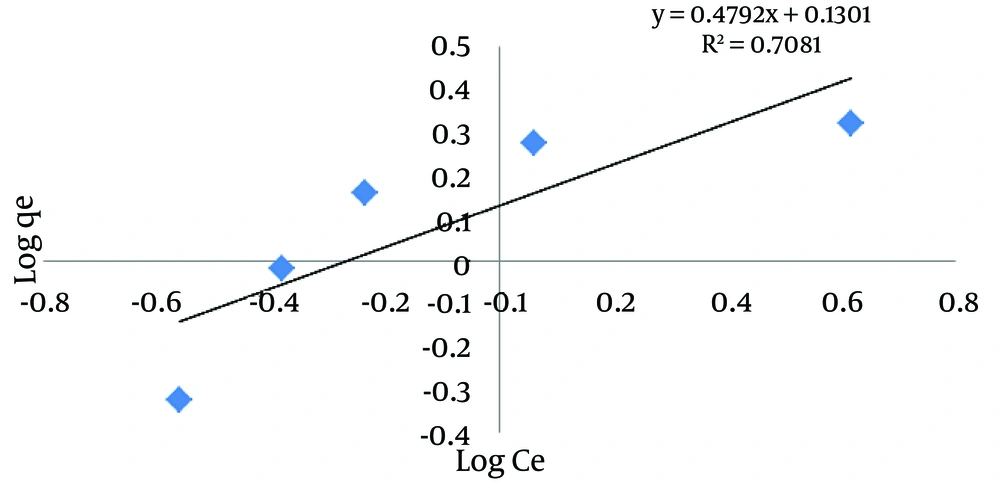
The linear form of Freundlich equation is as follows (17-19)
Log qe + Log KF + 1/n Log Ce
Where KF is the adsorption capacity (mg/g), 1/n is the intensity of adsorption, Ce is the equilibrium concentration (mg/L) and qe is the adsorbed substance (mg/g). From the linear diagram log (qe) against log (Ce), KF and 1/n are determined, in which 1/n would indicate type of adsorption process. If 1/n = 0, the process is irreversible; if 0 < 1/n < 1, the optimum adsorption state exists; and if 1/n > 1, it indicates non-optimum adsorption (20). The results of Freundlich isotherm analysis are shown in Figure 6 and Table 2. According to the obtained results of 1/n = 0.479 and correlation coefficient of R2 = 0.7081, the obtained data are conformed to Freundlich isotherm.
| 1/n | KF |
|---|---|
| 0.479 | 1.348 |
Results of Freundlich Isotherm Calculations
4.6. Kinetic Studies of Lead Adsorption by Prosopis Mimosaceae Sawdust
One of the most important factors for adsorption process is prediction of the adsorption rate. The adsorption kinetics depends on the physical and chemical properties of adsorbent that affect adsorption mechanism.
4.6.1. The Kinetic Model of the First-Degree Adsorption
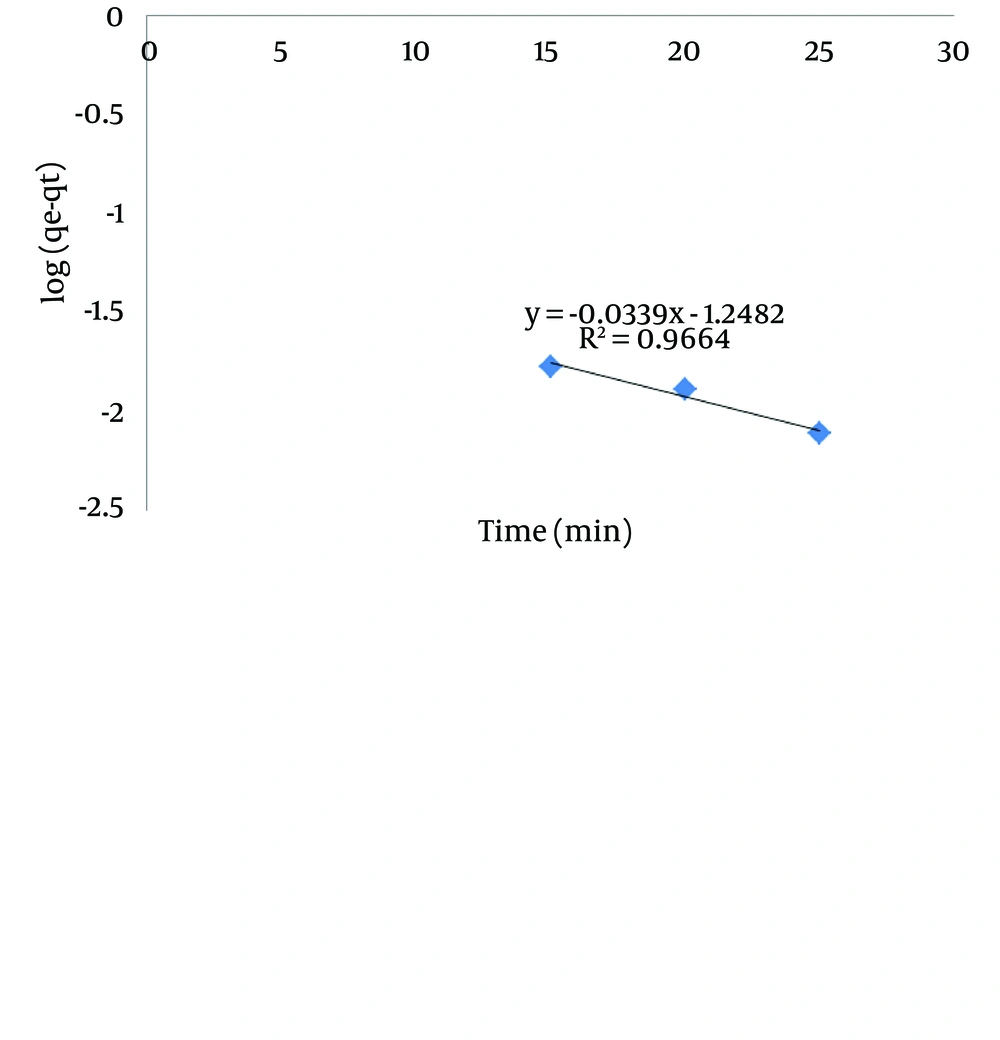
The first-degree adsorption kinetic can be described as follows (21, 22):
Log (qe - qt) = Log qe – [(K1× t)/2.0303]
In this equation, qe is the adsorption capacity of sawdust in equilibrium condition (mg/g), qt is the quantity of adsorbed lead in time (mg/g) and k1 is a constant of first-degree equilibrium velocity (1/min). The first-degree kinetic model is obtained by linear drawing of log (qe-qt) on the basis of t, that k1 and qe are drawn from slope and intercept and correlation coefficient R2 can also be obtained from the diagram. The results of the first-degree adsorption kinetic are shown in Table 3 and Figure 7. According to the parameters and diagram, it can be concluded that the data do not follow the first-degree adsorption kinetic model, because in spite of optimum R2, quantities of qe from the experiment are not equal with calculated qe from the diagram.
4.6.2. The Kinetic Model of the Second-Degree Adsorption
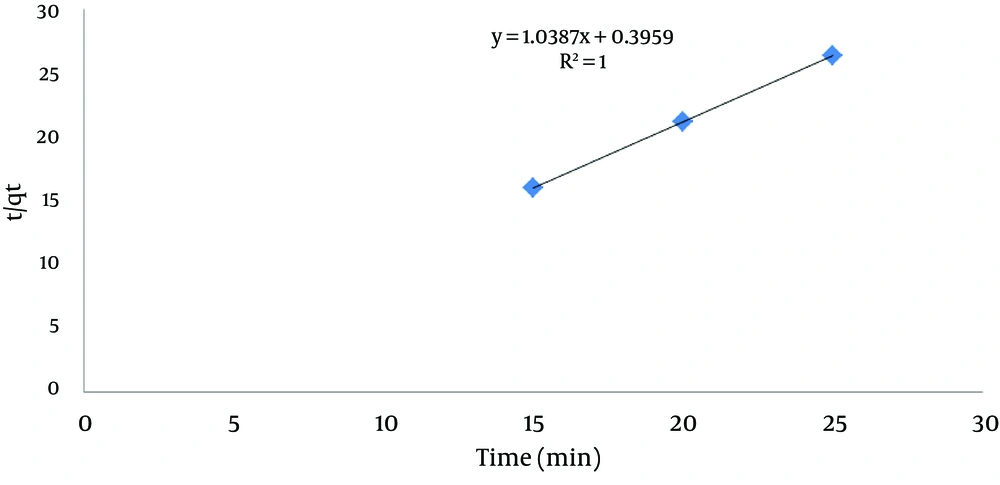
The second-degree adsorption kinetic model is also one of the most common models for analyzing the kinetic of adsorption reactions, which are as follows (23):
t/qt = (1/qe)t + [1/(k2 × qe2)]
Where, qe is the adsorption capacity of sawdust in equilibrium condition (mg/g), qt is the adsorbed lead quantity in time (mg/g) and k2 is a constant of second-degree equilibrium velocity (g/mg/min). The second-degree kinetic model is obtained by linear drawing of t/qt on the basis of t where qe and k2 are drawn from slope and intercept, and correlation coefficient R2 can also be obtained from the diagram. The results of the second-degree adsorption kinetic are shown in Table 4 and Figure 8. According to the parameters and diagram, it can be concluded that the data follow the second-degree adsorption kinetic model because the quantity of R2 is optimum and obtained qe quantities from the experiment are equal to the calculated qe from the diagram.
| R2 | qe, Experiment | qe, Calculated | K1 |
|---|---|---|---|
| 0.9664 | 0.9565 | 0.056 | 0.067 |
Kinetic Results of the First-Degree Adsorption
| R2 | qe, Experiment) | qe, Calculated | K2 |
|---|---|---|---|
| 1 | 0.9565 | 0.9633 | 2.727 |
Kinetic Results of the Second-Degree Adsorption
4.7. Morphological Study of Prosopis Mimosaceae Sawdust
Figures 9 and 10 show images from the surface of sawdust taken by scanning electron microscope (SEM). Figure 9 shows the images before the adsorption of sawdust in different magnifications, which shows its porous structure. Figure 10 shows the images after the adsorption of sawdust in different magnifications, in which the metals have filled pores and the adsorption process has been conducted.
5. Discussion
The results of this study indicated that the highest adsorption efficiency was 96.12% conducted in optimum conditions of pH = 7, adsorbent quantity of 10 g/L, 30 minutes of contact time and the initial lead concentration of 15 mg/L. Because of the high removal capacity of by Prosopis Mimosaceae sawdust, this method can be considered as an effective method in heavy metals removing.
