1. Background
Light is one of the most important factors for observation. This factor, more than any other physical variable affects workers. Both cognitive and psychological properties of lighting in the workplace can affect human performance (1-6).
Adequate lighting has preventive measures of incidents that happen due to fatigue. Research has shown an association between work production and sufficient brightness, which leads to the higher quality of products. Well-designed lighting decreases the number of occupational accidents (7). Researchers have suggested a number of work design strategies in order to enhance the quality of work (8). However, little attention has been paid the actual process of work design (9).
Improper design of lighting systems leads to insufficient accuracy at work with faulty outcomes as fatigue, headache, visual impairment, which causes accidents or some light glare and eye injury (3, 4).
Improving the lighting at work place has several positive effects on the performance of the works; lighting influences productivity factors such as output, errors, and accidents (10). Many field studies in industrial environments have shown large increases in productivity when the lighting level has been enhanced (11). For good lighting practice, in addition to the required illuminance, qualitative and quantitative aspects are satisfied as well (2, 12-15).
2. Objectives
Considering the importance of the relationship between production and lighting and the required lighting according to type of workplace, we assessed and evaluated the average illumination in 3 work shifts of CO2 Gas unit of Khuzestan Zam Zam Company and then these values were compared to the national standard values.
3. Materials and Methods
This study is a descriptive-analytical one. Measurement scale used in this study (distance - the ratio), and comparison of the measured data with 1-way analysis of variance (ANOVA) were performed between March and June 2006. Descriptive statistics was used for examining the average and standard deviation of measured amounts of illuminance in the 3 shifts. In order to assess the illuminance of CO2 Gas unit of Khuzestan Zam Zam Company, we examined the light utility unit aspect of lighting design position, type of lights, sort of lamps and position of them, and the number of doors and windows (Natural and Artificial lighting).
The next step involves preparation of a workshop map, by dividing the workplace and measuring stations; the illuminance level in the center of each station and the average illuminance per shift was calculated and compared with the standard values (16-20). Recommended lighting levels for different parts of the soft drink industry were 200 - 300 lx. Measuring total lighting intensity unit of CO2 was carried out by measuring the illumination levels (in Lux) of each shift using a calibrated Lux meter TES-1334 model (TES Electrical Electronic Corp, Taiwan) in a horizontal plane at a height of 75 cm from the floor. For comparing the amount of measured lighting intensity (natural and artificial lighting) to the standard levels, the standards of technical committee of occupational health, Iran management office of work and environment health announced 2002, 2nd edition, were used, which were according to the Standards of Lighting Engineering Association of North America (21). All data were analyzed by using SPSS software (Chicago, IL, USA, version 20.0, SPSS Inc.).
One of the methods of measurement and evaluation of artificial lighting system is measuring general lighting on a grid that is used in the enclosed places and buildings. According to Illuminating Engineering Society (IES) method, in order to determine the average amount of lighting intensity in a horizontal plane, workplace is divided to squares by the length of 1 meter and in this way, 122 points were determined as the station in the map.
In order to calculate the average illuminance in 3 shifts of morning (day light), evening, and night (artificial light) , the illuminance at the center of each station and the average illuminance were calculated through dividing the total illuminance in each shift by the number of the desired stations (22-24). Golden Software Surfer, version 9.0 was used to draw graphs of measured illuminance results. To calculate the number of lamps in lumen illumination method, we need the room index (Kr); coefficients of reflection (Coefficient of Reflectance Floor [ρfc], Coefficient of Reflectance Ceiling [ρcc], Coefficient of Reflectance Walls [ρw]); the maximum allowable distance between the lamps (MH), depending on installation height from floor lamps or ceiling to floor height and Distribution curve of the lamp and sort reflector; coefficient of utilization, maintenance factor; and unit area and luminous flux of each lamp (IES tables). Then the number of lamps can be calculated by Equation 1:

Where N is the number of lamp, Qt is total luminous flux, and QL is luminous flux of lamp.
In order to determination the total luminous flux and the Average Illumination, Equation 2 is used:

Where Qt is luminous flux of lamps (lumen), MF is Maintenance Factor, CU is Coefficient of Utilization where, A is Unit Area (m2), EAv is the average illumination, and LUX (lumen/m2).
Also, the distance between the lamps (X) with length (L) and width (W) and the number of lamps (N) were calculated and determined (3, 16-19).
4. Results
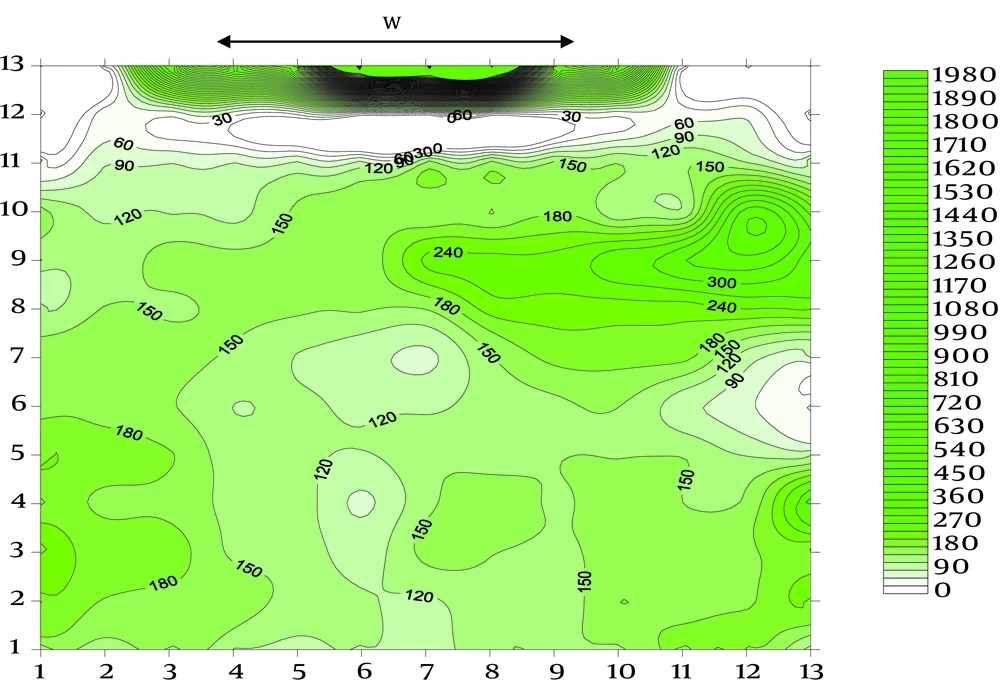
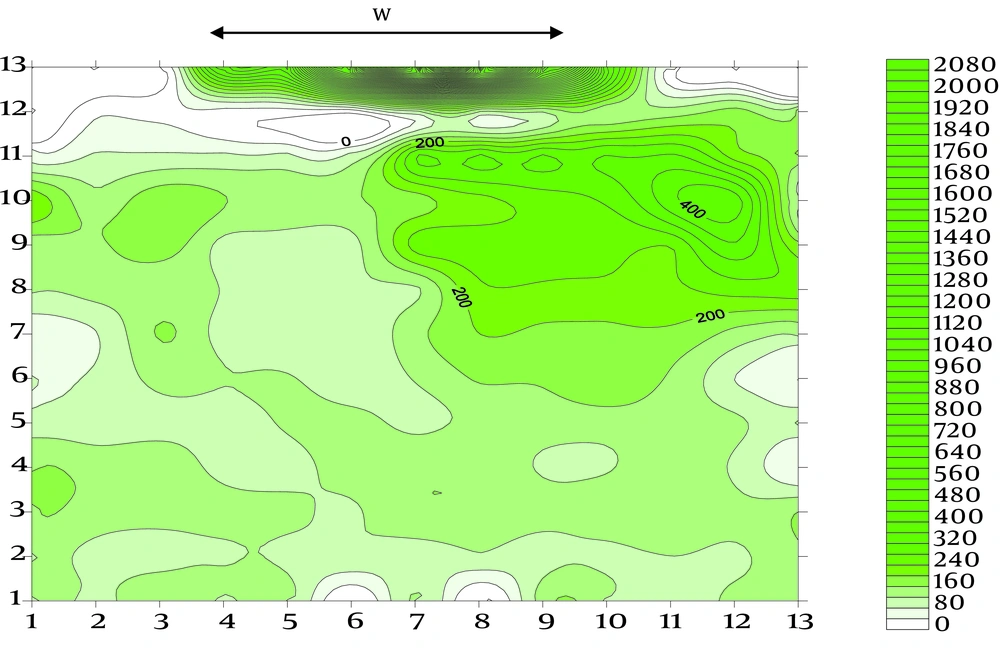
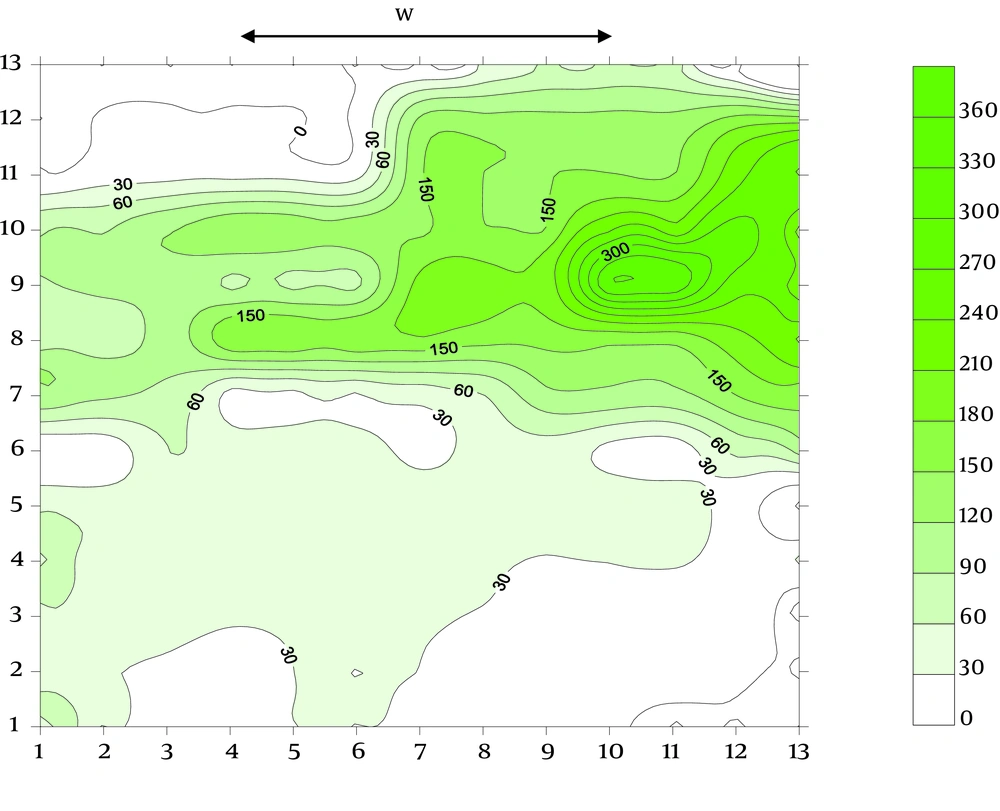
General lighting of CO2 Gas unit Khuzestan Zam Zam Company was provided by a window as the natural source and a metal halide bulb and gas lamp as only source of artificial lighting so that not only arrangement and uniformity of light distribution were not desirable but also their design and installation were not appropriate. The results from measuring the average illumination in 3 shifts, morning, evening and night in are presented in Table 1. Based on the comparison of average illuminance of 3 shifts with standard (300 lx), the average lighting of morning, evening and night shifts in one day were 88.68, 117.11, and 232.56 lux, respectively, which all of them were less than standard.
| Measurement Time per Shift | Recommended Illuminance, lx | Measured Illuminance, lx | |||
|---|---|---|---|---|---|
| Mean ± SD | Min - Max | Median | Mode | ||
| Morning shift (natural light) | 300 | 211.31 ± 292.07 | 30 - 1923 | 148 | 163 |
| Evening shift | 300 | 182.16 ± 205.16 | 11 - 1431 | 130 | 142 |
| Night shift (artificial light) | 300 | 67.44 ± 71.10 | 3 - 656 | 40 | 9 |
Measured Illuminance Levels in 3 Shifts of Morning (Natural Light), Evening, and Night (Artificial Light) a Day
One-way ANOVA was used to compared the average illuminance of 3 shifts, morning (day light), evening, and night (artificial light) with standard illuminance (300 lx). According to this test (P < 0.001), which represents a significant difference between 3 shifts with the standard value, this unit needs a lighting redesign. Graphical displays of the illuminance level in 3 shifts are presented in Figures 1, 2, and 3. In order to avoid the influence of daylight in the calculations of artificial lighting, only average illumination of night shifts was considered, which its rate of 232.56 lx was less than the standard. Therefore, the shortage of lighting should be provided by design with lumen method. Rate of room index, coefficient of utilization, maintenance factor, and other parameters were calculated to determine the total luminous flux and lamp numbers based on the lumen method (Table 2).
Because Metal halide lamps have appropriate color close to natural light, adequate useful life, and industrial applications, they were recommended for Gas units. Color rendering index of these lamps have good color expressions and do not produce much heat in types of 400 W or 250 W. In order to produce natural light as daylight, a mixture of yellow and white light was used, so that the amount of yellow and white light luminous flux were 10% Qt and 90% Qt, respectively. Table 3 shows lighting calculations of lamps.
A 400 W Metal Halide lamp the luminous efficiency is 32000 lumens flux per watt and a 250 W Metal Halide lamp the luminous efficiency is 17000 lumens flux per watt. The required numbers of 400 and 250 watt Metal Halide lamps are obtained by dividing the total luminous flux by each lamp’s luminous flux, which are found as 6 and 10 lamps, respectively. Also, the yellow compact fluorescent lamp luminous efficiency of 150 W and 85 W are 6500 and 5100 lumens per watt, respectively, which is equal to 4 lamps. The calculations of the choice of 400 W and 250 W metal halide lamps are presented in Table 4.
5. Discussion
Based on the average illumination measured in CO2 gas unit per each shift and its comparison with the standard level (300 lx), the average light of morning, evening, and night shifts in one day, was 88.68, 117.11, and 232.56 lx, respectively which were less than the standard level. Results of this study are in agreement with study that was performed in dormitory halls of Isfahan University of Medical Sciences, Iran (25). A similar study was conducted in which 3 different illumination levels were evaluated (450 lx; 1,100 lx; 1,500 lx) (26). Also, the result of this study is in line with the assessment of illuminance levels in automotive assembly industry in 2013 (21) and illuminance measurements in 3 packing plants in Saveh (27). In another study by Espinoza et al. at the University of Costa Rica, in 2010, it was found that half of the measuring stations were poorly lit (28). According to this research, the worker is not allowed to work only with a local lighting source, but his surroundings have to be lit additionally with general lighting sources (at least 10% of the total lighting of the room), otherwise the probability of accidents rises (29). Therefore, the lighting appropriate with this unit was designed with lumen method that based on it, the number of 400 W, 250 W metal halide lamps and 105 W and 85 W compact fluorescent lamps required for lighting units of CO2 Gas Zam Zam Company were 6, 10 and 4,4, respectively. Also, metal halide lamp had appropriate color close to natural day light. The maximum allowable distance between optional 400 W metal halide lamps is 5.5 m and the distance between 400 W Metal Halide lamps and 105 W yellow compact fluorescent lamp is 4.49 m.
This paper considers the solution based on the study of lighting level in one of the production units of a plant food. Because of the poor design and insufficient lighting, the required lighting appropriate for the production site was provided by artificial light system. Through comprehensive surveys on workplace illuminance levels (daylight and artificial light) and design of lighting system (as one of the physical factors in the work place), the efficiency of the production increases and on the other hand, fatigue errors and carelessness, as well as work accidents decrease.


