1. Background
Epidemiological and toxicological researches on air pollution have asserted that air pollution is responsible for human health and the rate of death (1-3). Air pollution is a major environmental risk to health (4). The less the air pollution, the better the cardiovascular and respiratory health of the population will be, both long- and short-term (5-7). Several studies have demonstrated the relation between short and long term effects of exposure to air pollutants and human health. The most important effects of air pollution include: increased rates of hospital admissions, asthma attacks, cardiopulmonary diseases, and annual death (8-12). The US national ambient air quality standards (NAAQS) lists air pollutants as carbon monoxide, ozone, particulate matter, sulfur dioxide, nitrogen dioxide and lead. Sulfur dioxide is a colorless gas, released from burning of coal, high-sulfur coal and diesel fuel. SO2 comprises a major portion of the pollutant load in many cities (13-15). It can cause irritation, reduction of visibility and some respiratory diseases (16-18). Sulfur dioxide can be dangerous to the respiratory system and the function of the lungs and can also lead to irritation of eyes (19, 20). From the past until now, Ahvaz has been well known due to industries as well as environmental pollution. In the last decade, an anthropogenic source of air pollution (dust storm) has joined to other environmental problems (21). Physical, chemical and biological characteristics of dust storm and also identification of hazardous air pollutants (HAPs) such as benzene, toluene, ethyl benzene, and xylenes (BTEX) have been well documented (21-23). Social impacts of dust storm on Ahvaz citizens has also been evaluated (24, 25). With the rapid economic growth in Ahvaz, the level of air pollution by both motor vehicles and industrial emissions has drastically increased. Furthermore, health effect of air pollution in terms of sulfur dioxide, ozone and particulate matter in most megacities particularly in Ahvaz has been reported. Pooled, in 12 European cities, estimated an increase in daily mortality for an increase of 50 μg/m3 in concentrations of sulfur dioxide and particulates, which were 3% and 2%, respectively (26). In Spokane, where sulfur dioxide concentrations were even lower, Schwartz reported similar findings of a significant health effect of particulates independent of sulfur dioxide (27).
2. Objectives
This study was designed to evaluate the association between fluctuations in ambient sulfur dioxide concentrations and hospital admissions of respiratory disease and respiratory mortality in Ahvaz city, southwest of Iran, during 2012.
3. Materials and Methods
In this retrospective study, we assessed the potential effects of sulfur dioxide exposure on human health in Ahvaz city during 2012. Sampling and collection of data was performed by Ahvaz department of environment and meteorological organization. The analysis of sulfur dioxide data was performed by Excel software and AirQ model. The estimation of the impact on health, attributable to the exposure of air pollution to the target population was conducted using AirQ model, which estimated this impact to be related to specific air pollutants on a resident population in a certain area and period (28, 29). AirQ2.2.3 software was proved to be a valid and reliable tool to estimate the potential short-term effects of air pollution, predict health endpoints attributed to criteria pollutants, and allow the examination of various scenarios in which the emission rates of pollutants were varied. This model is a valid and reliable world health organization (WHO)-proved tool to estimate the potential short-term effects of air pollution. This model includes four screen inputs (supplier, quality assurance (AQ) data, location, parameter) and two output screens (table and figure) (20, 29).The most important part of the analysis is data processing which encompasses modification of temperature and pressure, primary processing (deletion, spreadsheet, and synchronization), secondary processing (code writing and condition correction), formulation and filtering. We calculated the cardiovascular deaths related to sulfur dioxide by AirQ2.2.3 based on utilizing the relative risk, attributable proportion and baseline incidence from WHO data (28, 29).
3.1. Description of Study Area
Ahvaz city, with a population of one million approximately, with an area of 8152 square kilometers, the capital of Khuzestan province, is located between 48°to 49°29’ east of Greenwich meridian and between 31°and 45 minutes to the north of the equator (23, 29). To perform this study, data was taken from Ahvaz Department of Environment (ADoE). The stations were located in downtown, Old School of Public Health Bureau of Meteorology and head office of ADoE.
3.2. Data Analysis
For assessing of health impacts related to sulfur dioxide exposure in the ambient air of Ahvaz, we needed the city population, coordination (latitude and longitude), the number of stations and their data sets. All the statistical analyses were performed using Microsoft Excel program as well as statistical software packages with average and standard deviation. As mentioned, the most important part of the analysis was data processing which encompassed removal or recovery of missing figures, correction of temperature and pressure on the basis of meteorological data, code writing, formulation, and filtering. In terms of epidemiological parameters, relative risk, baseline incidence and attributable proportion, they were calculated based on previous studies of WHO. In addition to the total attributable cases, we could estimate the distribution of attributable cases in terms of concentration intervals of pollutant. The results were the excess cases of deaths and diseases associated with the given pollutant (sulfur dioxide).
4. Results
The primary and secondary standard of sulfur dioxide according to NAAQS in 24hourswas 150 µg/m3 (20). Table 1 shows that the annual mean of sulfur dioxide in Ahvaz was 160 µg/m3 in 2012 which was higher than the NAAQS standards. In view of sulfur dioxide concentrations, downtown “Naderi” and Bureau of Meteorology were the highest and the lowest stations during 2012, respectively. The yearly average, summer mean, winter mean and 98 percentile of sulfur dioxide concentrations in these stations are presented in Table 1.
| Parameter | Average in Ahvaz | Stations | |
|---|---|---|---|
| lowest Stations (Bureau of Meteorology) | Highest Stations (Downtown “Naderi”) | ||
| Annual mean | 160 ± 28.3 | 75 ± 17.3 | 220 ± 29.4 |
| Summer mean | 46 ± 9.4 | 37 ± 7.9 | 75 ± 15.7 |
| Winter mean | 173 ± 23.8 | 81 ± 18.7 | 242 ± 26.3 |
| 98 percentile | 171 | 96 | 281 |
Highest and Lowest Concentrations of Sulfur Dioxide Corresponding to Stations a
According to Table 1, the highest sulfur dioxide concentration in Ahvaz city during 2012 occurred in winter which was 173 ± 23.8 μg/m3.
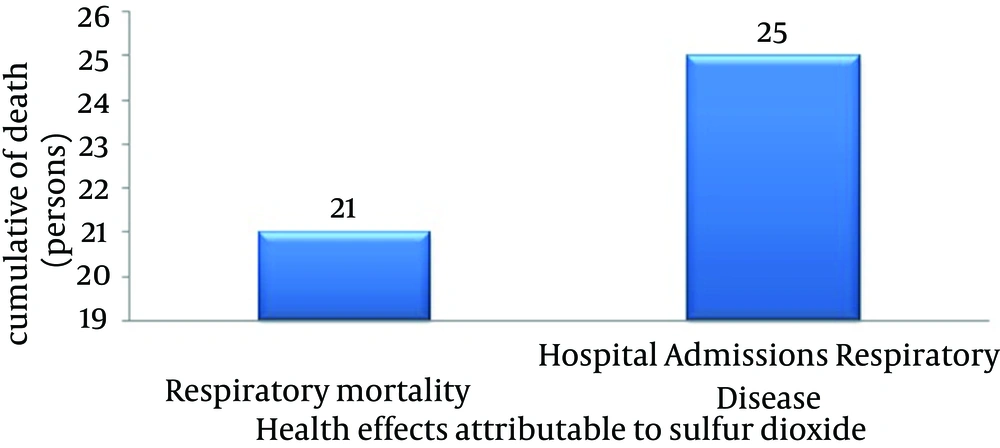
Figure 1 shows the cumulative hospital admissions of respiratory disease and respiratory mortality versus sulfur dioxide. Cumulative cases of this health endpoint were estimated which was 25 in 2012; 80% of this number occurred in days with concentrations lower than 180 µg/m3. Twenty one persons were estimated as respiratory mortality within one year of exposure; 47% of these cases occurred in days with ozone levels not exceeding 90 µg/m3.
The relative risk (RR) and estimated attributable proportion (AP) percentage for respiratory mortality and hospital admissions of respiratory disease are presented in Table 2. The baseline incidence (BI) for this health endpoint for sulfur dioxide was66 per 105; so, the number of respiratory mortality cases was 21 (RR=1.0044 and AP=1.8165%) and for hospital admissions of respiratory disease it was101.4 per 105; so, the number was 25 (RR=1.01 and AP=4.0350%) at the centerline of relative risk.
| Estimate | Indicator | ||
|---|---|---|---|
| RR (Medium) | AP, % | Attributable Excess Cases, Persons | |
| Respiratory mortality (down) | 1.0001 | 0.008 | 8.6 |
| Respiratory mortality (mediocre) | 1.0044 | 1.8165 | 21.2 |
| Respiratory mortality (up) | 1.011 | 4.4207 | 43.5 |
| Hospital admissions for respiratory disease (down) | 1.006 | 2.4607 | 15.8 |
| Hospital admissions for respiratory disease (mediocre) | 1.01 | 4.0350 | 25.8 |
| Hospital admissions for respiratory disease (up) | 1.014 | 5.5593 | 35.6 |
Relative Risks, Attributable Proportions and Number of People With Respiratory Mortality (BI=66) and Hospital Admissions for Respiratory Disease (BI=101.4) Due to Sulfur Dioxide Exposure
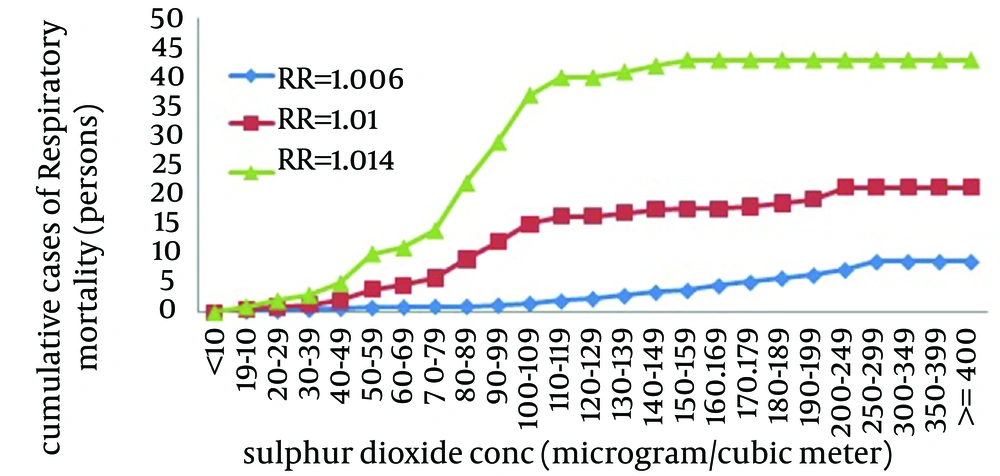
Respiratory mortality versus sulfur dioxide concentration is shown in Figure 2. The estimated cases attributed to sulfur dioxide for respiratory mortality at lower, central and higher RR were 8, 21, and 43, respectively; 63% of this number occurred in the days with concentrations lower than 150 µg/m3. It should be noted that 71% of the above number was corresponded to the days with concentrations below 200 µg/m3.
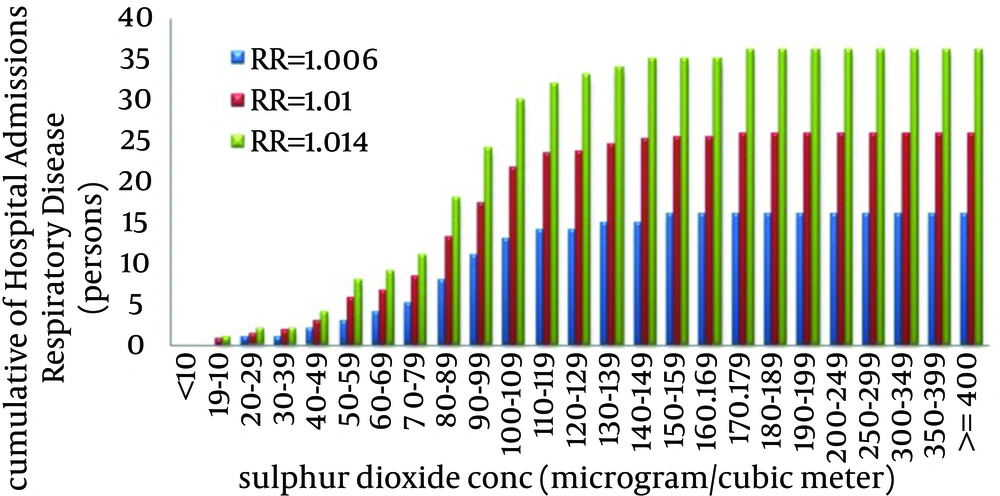
Figure 3 show that no one day in 2012 has been reaches the sulfur dioxide concentration below μg/m3 10, In other words, in 2012, sulfur dioxide concentration was never below 10 μg/m3. The hospital admissions of respiratory disease cases with increase of the concentrations of sulfur dioxide to 20 - 120 μg/m3 have a uniform trend.
5. Discussion
In this study, we estimated the hospital admissions for respiratory disease and respiratory mortality to be associated with short- and long-term fluctuations in concentrations of sulfur dioxide pollutant, using AirQ model in Ahvaz, Iran. Sum of the respiratory diseases attributed to sulfur dioxide in Ahvaz was 21 cases in 2012. The results showed that approximately, Ahvaz with 5% is one of the most polluted cities. The higher percentage of these deaths perhaps could be the result of higher average sulfur dioxide or because of sustained high-concentration days in Ahvaz. Table 1 shows that the 24-hour average of summer and winter of downtown “Naderi” and Bureau of meteorology were the highest and the lowest stations during 2012, respectively. Relative risk, the percentage, the attributable ratio and the respiratory mortality attributed to sulfur dioxide are estimated in Table 2. According to Table 2, the relative risk (RR) of hospital admissions for respiratory disease increased 0.34% in lieu to each 1 mg increase of sulfur dioxide concentration (0.18% per CI= 0.0/5 and 0.96% per CI= 0.95). Figure 3 have illustrated the sulfur dioxide concentrations versus related health endpoint and average concentrations during years. The association of daily mortality and morbidity with short-term variations in the ambient concentrations of air pollutants has been studied (30). In a similar work by Goudarzi et al. In 2009, the sulfur dioxide hygienic effects in Tehran (capital of Iran) were estimated. Based on their results, almost 7.82% and 3.6% of all cases of whole respiratory deaths and hospital admissions for respiratory disease were attributed to sulfur dioxide (31). In another study by Mohammadi et al. In 2009, the health effects of air pollutants in Ahvaz were calculated. Based on their results, approximately 4.03% of total respiratory deaths and 1.8% of hospital admissions for respiratory disease were related to sulfur dioxide (32). Zalaghi et al. (33) In 2010 in a survey regarding the health effects of air pollution in Ahvaz, Bushehr and Kermanshah concluded that approximately 4.4% in Ahvaz, 8.64% in Kermanshah and 3.33% of total respiratory deaths were attributed to sulfur dioxide. According to a study by Sunyer et al. (34) increase of daily sulfur dioxide levels, two days in a row, can lead to cardiovascular and respiratory mortality. They found that an increase in the 10 μg/m3 daily average of sulfur dioxide led to an increase of 0.7% of all the cardiovascular admissions during two consecutive days (34). Lippmann et al. survey on health effects of air pollution in Detroit, the USA, showed that with an increase in the pollutant levels of 10 μg/m3 (daily average of sulfur dioxide), an increase of 2% in hospital admissions occurred (35). Studies in six Italian cities in 2001 showed that increase in daily average of sulfur dioxide was related with an increase of 2.8% in cardiovascular diseases (36). According to a study by Ballester in Valencia, Spain, the increase in sulfur dioxide levels increased the prevalence of circulatory diseases in the community (37).
This study was the second attempt to evaluate the health impacts of sulfur dioxide air pollutants in Ahvaz, Iran. Based on the results of this study, approximately 5% of the total hospital admissions for respiratory disease and respiratory mortality were attributed to respiratory sulfur dioxide. The greatest number of health effects was related to the high concentration of measured sulfur dioxide. Sulfur dioxide concentration was high compared to the standard values issued by The US. EPA (NAAQS guidelines’ values). Although the results of this study were in line with the results of other researches around the world, since the geographic, demographic, and climate characteristics were different, there is still a high demand on further studies to specify local RR and BI. Careful monitoring of air pollution is necessary to reduce the health risks; air pollution can be reduced by limiting the emissions of pollutants from various sources such as changing the modes of transportation and reducing the energy consumption, especially the ones based on combustion sources. Finally, the survey results showed that implementation of basic actions to control sulfur dioxide and prevent it from entering to the stratosphere by decrease of consumption of gasoil fuel in industries and development of green space are essential. Accordingly, cost-effective measures and management schemes should be considered to abate air pollution concentrations and/or reduce the exposure of general population to air pollutants.


