1. Background
The most common job-related exposure factor is noise (1-5). Excessive noise exposure can result in permanent hearing loss. Surgery and hearing aids cannot remedy this hearing loss problem (6). Annually 22,000,000 workers are exposed to possibly harmful noises (7, 8). For workers who have faced with a standard threshold shift, hearing protectors should diminish their exposure to an eight-hour time-weighted average of 85 decibels (dB) or lower (9, 10). Noise exposure measurements are often expressed as dBA (11). The electric arc furnace is a key source and the most important noise source in the steelworks. Extremely intense noise during the melting, particularly at the initial stack, is radiated by the electric arc in the furnace and in refining it can be moderated (12). Hearing loss can be affected by elevated noise levels from crushing and grinding ore, gas discharge blowers, and high-power electric furnaces. Hearing protectors should be worn if the source of the noise cannot be enclosed or isolated. A hearing conservation program containing audiometric testing and training should be introduced (13, 14). Employers are provided with a graphical representation of noise pressure levels, that is the level of noise within the workplace, by creating a contour map demonstrating the noise distribution, and can more quickly determine the noise exposure that employees working at specific places are expected to be facing. The map can also be used for: 1) Identifying the factory creating intensely high noise pressure levels that may be willing to reduce the noise source; 2) tracing the cause of high levels of noise pressure which can be a little apart from the source. Perhaps it is essential to: 1) Follow this precisely by a noise intensity measure; 2) Observe the noise emission resulting from equipment or processes to show up the necessity for maintenance or repair; for example, erode in the defective valves’ bearings; 3) Detect low-noise passageways in an order that the movement of people in the building can be planned to lessen unnecessary exposure; 4) Assess the regions of ear protection and watch the ear protection use; 5) Enjoy the highest advantage. The noise map can be superimposed in the existing building plans, which show the emergency exit places, fire points and so on, and to be visible, it can be placed at the doorway for workers and visitors. Two measures can display the noise contour maps as emission profiles on a floor plan: 1) sound pressure level, i.e., the quantity of the noise energy at a specific place after being reflected by building and machine surfaces; 2) the noise intensity, ie, a measure of the quantity and direction of acoustic energy that flows from a source. Noise contour maps that have a complete machine corridor can give valuable information on regions of lower noise exposure. These regions can regularly be applied as favored access ways for employees to evade the unneeded exposure to noise (15). In a study on pollution in the automobile industry, by Nasiri et al. and in a survey on control of shear cutting noise in a sheet metal industry, Lai JC declared that a noise map can be used for reducing the exposure level of workers in critical areas in terms of the noise intensity (16, 17). In a research, Banerjee statedstated that road traffic noise map was required as an indicator to determine high-risk areas in terms of noise pollution (1, 18, 19). Zhang et al. explained that Surfer software can be a suitable method to display isosonic noise map (20).
2. Objectives
This study was aimed to evaluate the noise pollution status of one of the metal melting industries and draw its noise aligned curves map using Surfer modeling software.
3. Materials and Methods
3.1. Study Population
In this analytical-descriptive and cross-sectional study, the case study was a metal melting plant. The design of the eccentric bottom tap-hole (EBT) furnaces is such that they can be used for melting up to 85% of the sponge iron. Now, it is based on the melting of the working scrap. Furnace baskets are oysters. When the 12-ton cranes of the scrap unit were filled, after weighing, they are moved to the furnace through the scrap wagon and are charged in the furnace by 60-ton cranes. Based on the type and density of the scrap, the number of baskets is variable. After stirring a scrap into the furnace, the melting operation begins with the establishment of the electric arc through three electrodes made of granite, which is usually along with a lot of noise. In ladle furnace (LF) as secondary metallurgy, alloying operation and adjustment of the temperature are performed and then molten cauldron can be transferred to melt the continuous casting unit.
In the next step, the produced bar passes the secondary cooling room. In this room, the water is directly sprayed into the sides of the bar and cools it so that at the end of the secondary cooling room the bar is fully frozen; then, an automatic bar cutting machine, (Bernal Inc. USA) is used to cut the bars in the needed size and the pieces are transferred by the rollers to the cooling bed.
Since the main purpose of the study was to draw a map of isosonic curves of the factory, a purposive sampling was conducted for the designated stations and the overall area of the factory was evaluated by noise.
3.2. Methods
In this study, measurement was done in the two forms of sound pressure level and octave band analysis.
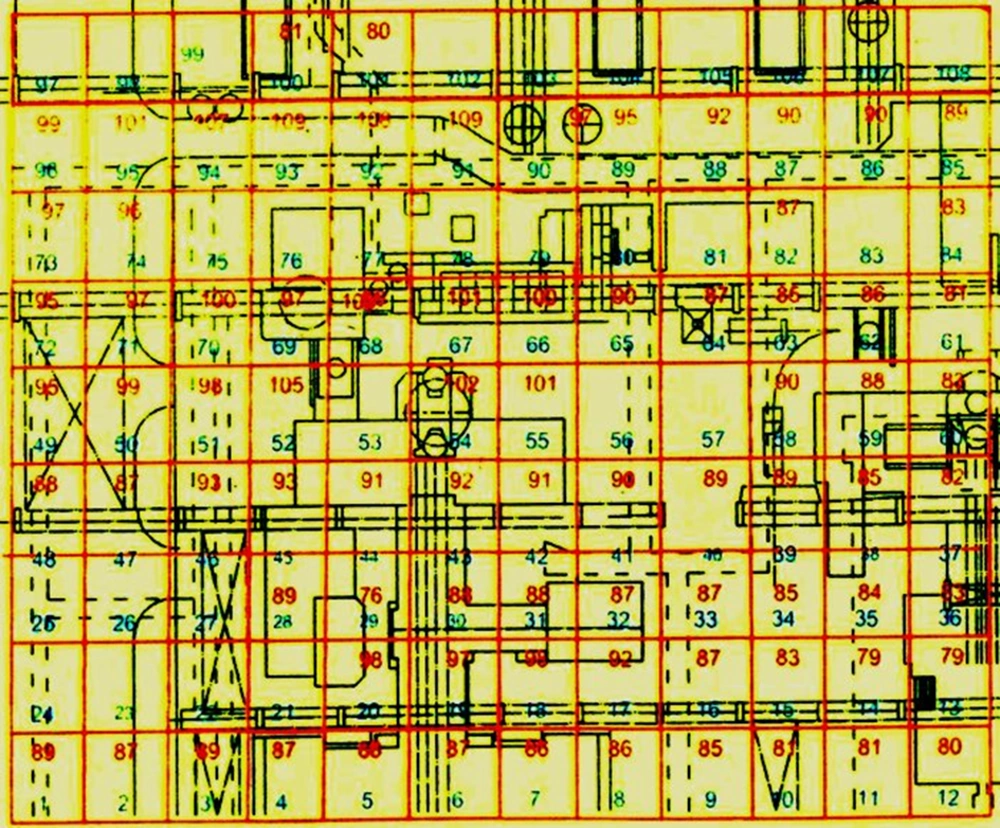
First, after technical visiting of the site of the factory, the noise sources and the equipment layout were determined. Then, using AutoCAD version 2007, the preliminary maps and the stationing maps were respectively drawn. AutoCAD is a software used for drawing buildings, bridges and computer chips. AutoCAD is used mainly by engineers, surveyors and designers (21, 22). In this method, the level of the factory was divided into the squares of 5 × 5 square meters and noise poll was conducted in the center squares. The noise pressure level was measured at all quantifiable stations and the analysis of octave band (31.5 Hz to 16,000 Hz) was also performed in the vicinity of noise-generating equipment with a sound pressure level more than the maximum limit of 85 dBA in a measurement network. In some cases, due to the physical extent of the plant for accuracy and ease of work, the overall map of the factory was divided into several sections. The required information and data and the measured values of noise were entered into the stationing maps. The measurement method of noise included a preliminary study of data collection, measurement of noise, and comparing the results with the ACGIH standard equal to 85 dBA noise for eight hours exposure with noise in a work shift. Noise measurement was carried out based on spatial variability (stationing and places where the individual was exposed to the noises of machineries and instruments). If the sound pressure level was greater than the maximum limit of the noise, the analysis would be performed at octave band frequencies. In the present study, Casella CEL-445 Noise Level Meter (SLM) (England) was used. To ensure the correctness of the results, the SLM device was calibrated by Casella CEL calibrator before used; in addition, modeling software of Surfer version 8 was used for drawing the aligned curves. This software is usually used to perform interpolation and draw the aligned graphs and apply noise maps (23, 24). Moreover, to draw the graphs and tables, Microsoft Office Excel 2010 was used.
4. Results
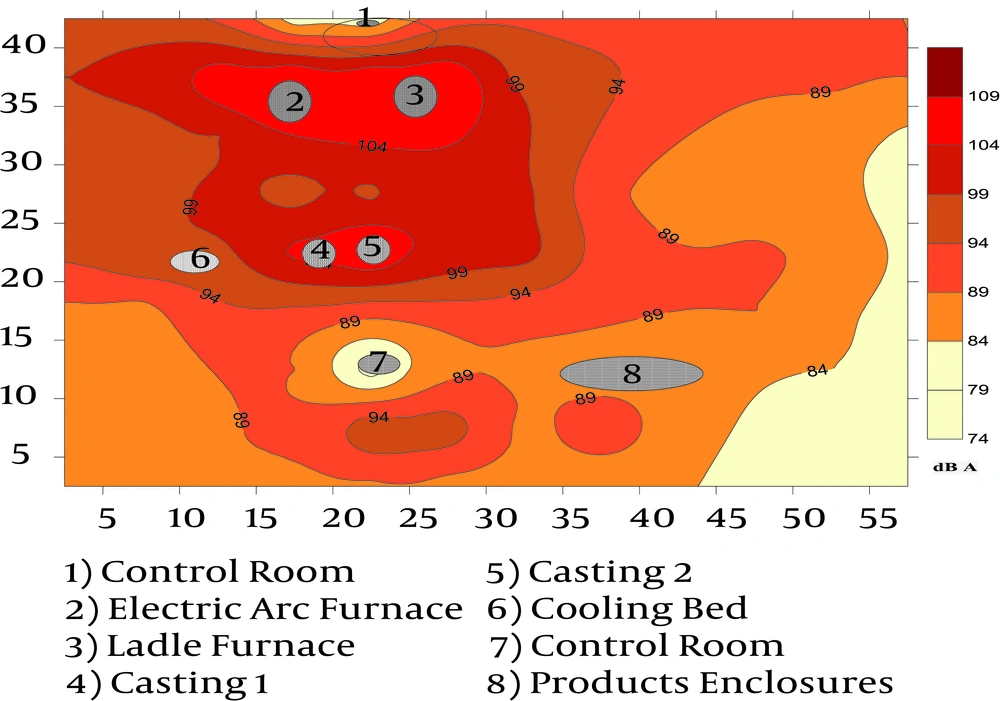
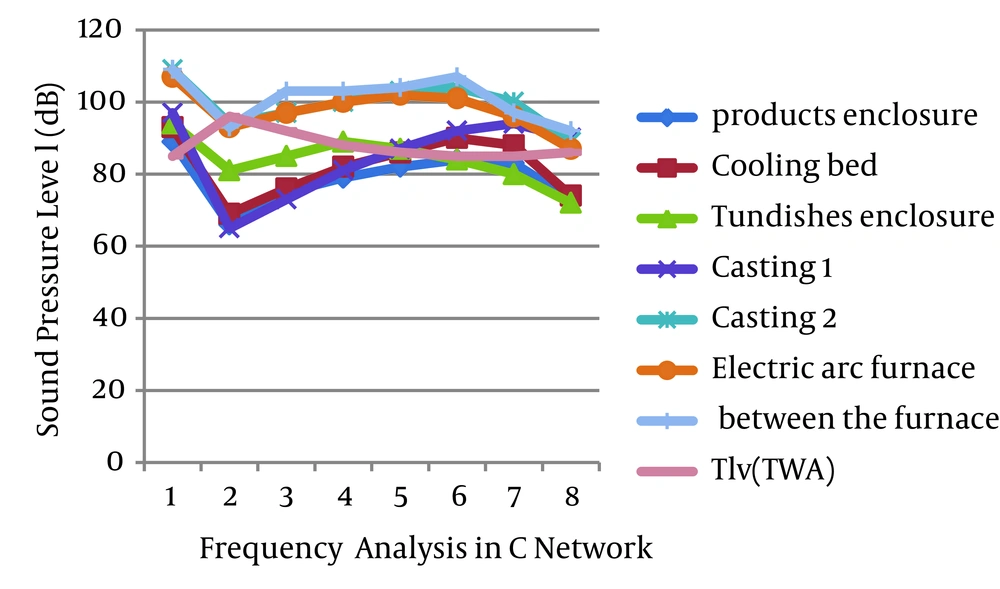
A total of 108 stations were measured by the overall level of noise pressure (Figure 1) and 8 stations were also analyzed by frequency (Table 1). As the factory isosonic map (Figure 2) shows, the average sound pressure level of the electric arc furnace station and its LF were equal to 109 dBA. The results showed the analysis of the frequencies of sound pressure level in the vicinity of noise-generating devices and critical places, in comparison with an allowable eight-hour limit (Figure 3). Then, the casting and the tundishes and cooling bed with respectively 97, 94 and 93 dBA had the maximum noise pollutions. Therefore, most of the noise-generating factors in the plant included electrical arc furnaces, cooling beds and casting tundishes.
Octave band frequency analysis of noise in the studied factory showed that most of the noises produced from the noise sources were in the high-frequency wave category, so that in the metal melting factory, noises generated from an electrical arc furnace, LF, and the enclosure located between furnaces of frequencies from 500 to 8000 Hz were not complied to the standard curve and were higher than the allowable limit. After that, casting and after them, namely cooling beds of the metal melting plant were exposed to a high sound pressure level of a maximum of 110 dBA. Octave band noise analysis showed that most of the noises generated from sources are classified in high-frequency waves. As the metal smelter, the noise produced by electric arc furnace, LF and the furnace area are between 8000 - 500 Hz and did not follow the standard curve. After casting, in frequencies 8000 - 1000 Hz, is higher than the standard eight-hour.
| TWA | Place | SPL | 125f | 250 | 500f | 1000f | 2000f | 4000f | 8000f |
|---|---|---|---|---|---|---|---|---|---|
| 85 | 96 | 92 | 88 | 86 | 85 | 85 | 86 | ||
| 1 | Products enclosure | 89 | 66 | 75 | 79 | 82 | 84 | 83 | 73 |
| 2 | Cooling bed | 93 | 69 | 76 | 82 | 86 | 90 | 88 | 74 |
| 3 | Tundishes enclosure | 94 | 81 | 85 | 89 | 87 | 84 | 80 | 72 |
| 4 | Casting 1 | 97 | 65 | 73 | 81 | 87 | 92 | 94 | 90 |
| 5 | Casting 2 | 96 | 69 | 76 | 80 | 85 | 90 | 92 | 90 |
| 6 | Electric arc furnace | 109 | 94 | 97 | 100 | 103 | 104 | 100 | 89 |
| 7 | Ladle furnace | 107 | 93 | 97 | 100 | 102 | 101 | 96 | 87 |
| 8 | The enclosure in the furnace | 109 | 93 | 103 | 103 | 104 | 107 | 97 | 92 |
The Average Sound Pressure Level of each Frequency Generator Source along with Frequency Analysis in C Network in Metal Melting Factorya
5. Conclusions
In a study by Golmohammadi et al. in a steel industry, environmental evaluations and the noise map of the surrounding environment of the furnace showed that the sound pressure level in all stations in the enclosure of furnace, except for five stations located on the corner points and the output area, were higher than the allowable limit of exposure during an eight-hour work shift in accordance with the national allowed standard; in addition, noise problem around the furnace raised as a health problem to make audio shelter for workers whose presence was not an urgent and permanent necessity along with the audio resources, which can be used as one of the effective solutions for control (25-29). By building or equipping the control rooms in cement and steel factories and power plants, they can be converted into safe shelters. When a noise enters the controlled room in a factory, that actually causes disruption and inconvenience in the conversations; for noise reduction, noise absorbent panels can be used between them and at the junction of the wall of the workshop to the control room wall wherever there is contact between the control room and the workshop wall. In many cases, noise is created due to bad maintenance or lack of control and inspection, and improper functioning of devices and implements. Parts of the machine may become loose over time and causes the noise. The worn parts of devices may also cause the difficulty in devices which can ultimately cause noise. An annoying voice also is created due to the inappropriate lubrication of devices or lack of lubrication in the appropriate times. Maintenance and protection of devices and machines has to be considered as one of the solutions for controlling the noise in plans and instruction (30-33). It seems that the workers act in control rooms in the best part of working time, given the amount of equivalent noise level in the furnace control room equal to 81 dBA, because the furnace is essentially disturbing noise and exposure to its noise is inevitable during activity and there is no possible way to control measures in the building to reduce noise. Therefore, to avoid constant exposure to its noise during activity, in designing its technology, a few rooms have been predicted as places for rest and periodical exposure, or the so-called reducing time of exposure to its noise. According to some studies, an effective factor for the inefficiency of control rooms and recreation of workers around the furnace is their improper design. Because these rooms are in direct exposure to the sound of the furnace, and all openings, including their doors and windows are so high leaking, they are not efficient and their noise level is also annoying and disrupting for the acoustic comfort. Specially, in the control room, the acoustic comfort, comforts in dialogue, and creating focus in the process furnace are very important ergonomically. Therefore, control-modified schemes are recommended to reduce exposure, and thus reduce the receiving dose. There is a need for a serious attention by factory officials to the dangers and health problems caused by noise exposure, voice control room improvement and prevention of unnecessary traffic and to give protective ear muffs along with training of the correct use and maintenance of them as well as controlling the use of ear muffs at necessary times.


