1. Background
Heavy metals are distributed in the environment because of human manipulations and natural chemical reactions (1). For example, application of metal-contaminated fertilizers, animal manures, and sewage sludge can result in high concentration of cadmium (Cd) in agricultural soils (all cases occurring in Khuzestan province, Iran). A food chain contaminated with such heavy metals is a major source for human poisoning. Plants play an important role in heavy metals transfer from contaminated soils to human body (2). This event is remarkable in highly consumed crops such as rice and wheat. Rice is the predominant food crop in the developing countries such as Iran; therefore, 96% of the world’s rice is produced and consumed in such countries (3). Rice ranks second in the food chain of Iranian people. It is the most common crop grown in agricultural lands in the North of Iran (4). Data mining technique aimed at discovering useful information in a data set. Data mining is an advanced information processing technology, which discovers laws over data to obtain useful information. In a broad sense, any method that extracts information from data can be regarded as data mining, which includes a variety of information processing methods (5). Data mining is widely developed in various applications such as agriculture (6), analysis of organic matter (7), medical diagnosis (8), product design (9), marketing (10), credit card fraud detection (11), financial forecasting (12), and automatic abstraction (13).
2. Objectives
The current study pursued data classification and performance measure of the classifier algorithms based on true positive (TP) and false positive (FP) rates generated by J48 algorithm, when applied to the data set. The current study aimed at investigating the Cd concentration in rice grains by a decision tree using J48 algorithm. The study used WEKA software to implement the algorithm.
3. Methods
3.1. Study Area and Sampling Analysis
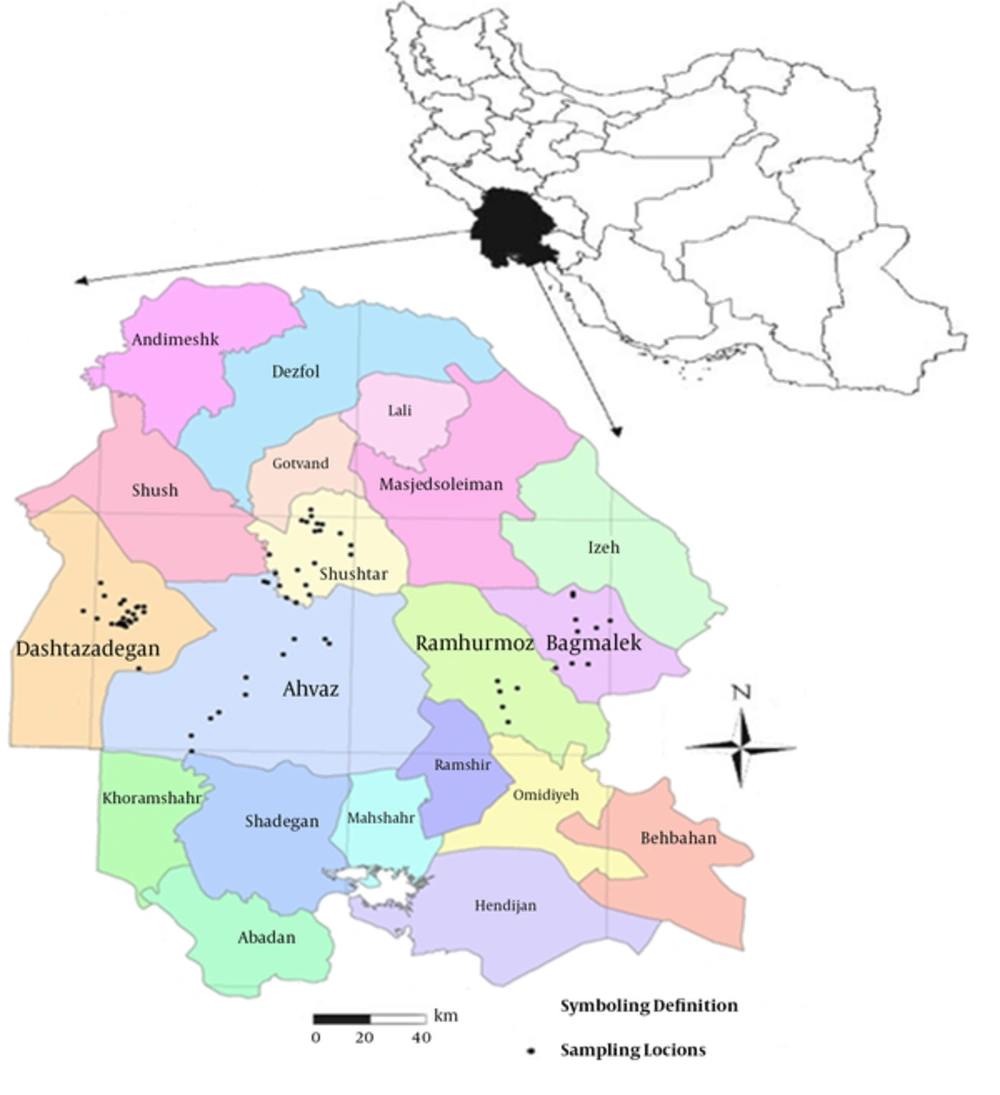
The study area was about 300 km2 in Khuzestan province of Iran (Figure 1). The study area included 5 sub-regions (Ahvaz, Dashte-azadegan, Baghmalek, Ramhurmoz, and Shushtar). A total of 70 soil samples were collected from paddy fields (Figure 1). Seed and soil samples were analyzed according to the standard laboratory procedures. All measurements and explanations in the current study were provided by the same authors (14). Data sets were analyzed with different software packages. Statistical analysis was conducted with SPSS version 17. Descriptive statistic variables such as mean, variance, maximum and minimum of Cd concentrations in soil and rice seed, and measured soil parameters were calculated. The correlation analysis was used to evaluate the relationship between soil properties and seed Cd concentrations.
3.2. Decision tree Algorithm J48
The J48 algorithm is an open source Java performance of the C4.5 algorithm in the weak data mining tool. The algorithm was developed by Ross Quinlan (15). Decision tree J48 is the implementation of algorithm ID3 (Iterative Dichotomiser 3) developed by the WEKA project team. The decision trees made by C4.5 can be applied to different categories. Accordingly, C4.5 is frequently referential as a statistical arranger (16).
3.3. Data Collection Cleaning and Checking
The dataset required for the current study was collected from the private soil testing laboratory in Shahid Chamran University of Ahvaz, Iran. The dataset contain various attributes and the respective values of soil samples taken from 5 regions of Khuzestan province. The dataset has 10 attributes and a total of 980 instances of soil samples. Table 1 shows the attribute description.
| Attribute | Area | ECe | Sand | Silt | Clay | pH | TNV | OM | Cd seed | Cd DTPA |
|---|---|---|---|---|---|---|---|---|---|---|
| Description | Sampling site | Electrical conductivity decisiemen per meter | Sand value | Silt value | Clay value | pH value of soil | Total neutralizing value | Organic matter | Cd in rice seed | Extractable soil Cd |
Attribute Description
4. Result and Discussion
4.1. Descriptive Statistic Parameters
The descriptive statistics of the studied contents in 70 samples of rice seed from 5 sub-regions are shown in Table 2. The average of soil and plant Cd concentrations in the area were 81.4 and 273.6 µg/kg, respectively, which were lower than that of soil Cd and greater than that of plant Cd, based on the ISIRI (the Institute of Standards and Industrial Research of Iran) permitted limits for Cd in rice seed (ie, 0.2 mg/kg), and soil (ie, 3 mg/kg) (17-19). After examining the areas separately, it was observed that in some areas the amount of Cd in rice seed exceeded the permissible limit (Baghmalek) that should be considered (Table 3). The results showed a close relationship between Cd in the seed with ECe, TNV, Cd DTPA, as well as the relationship between CdDTPA, and pH and OM (Table 4). Similar researches were also conducted by the same technique such as Gholap and Sanap et al. but some recent researches reported different parameters such as the high percentage of lime that can play an important role in the behavior of Cd. Further researches by the same authors should address the relationship between the concentrations of Cd in rice seeds and soil (3, 14).
| Soil Characteristics | N | Min | Max | Mean ± SD | CV (%) |
|---|---|---|---|---|---|
| pH | 70 | 6.8 | 7.7 | 7.2 ± 0.22 | 3.0 |
| ECe, dSm-1 | 70 | 1.2 | 40.5 | 7.6 ± 6.76 | 8.9 |
| Sand, % | 70 | 2.0 | 48.0 | 17.0 ± 10.37 | 60.9 |
| Silt | 70 | 30 | 58.0 | 49.5 ± 5.48 | 11.1 |
| Clay, % | 70 | 16 | 52.0 | 33.4 ± 9.04 | 2. 7 |
| TNV | 70 | 22.4 | 49.9 | 48.5 ± 3.55 | 7.3 |
| OM, % | 70 | 0.3 | 1.7 | 0.8 ± 0.25 | 3.1 |
| Cd seed, µg/kg | 70 | 8.9 | 266.2 | 81.4 ± 53.69 | 65.9 |
| Cd DTPA, µg/kg | 70 | 63.3 | 521 | 273.6 ± 111.75 | 40.9 |
Summary of Soil Characteristics in the Studied Areas
| Element | Area | N | Mean ± SD | Min | Max |
|---|---|---|---|---|---|
| Cd | Ahvaz | 12 | 270.9 ± 128 | 120 | 521 |
| Baghmalek | 9 | 296.7 ± 135 | 127 | 465 | |
| Dashte-azadegan | 24 | 275.5 ± 118 | 63.3 | 493 | |
| Ramhurmoz | 5 | 249.6 ± 24.0 | 219 | 283 | |
| Shushtar | 20 | 269.6 ± 123 | 97 | 515 | |
| Total | 70 | 273.6 ± 117 | 63 | 521 |
The Mean Cd Concentrations in Rice Seed Grown in Different Areas
The Correlation Coefficient Between Heavy Metals and Soil Attributes
4.2. Tuning Performance of J48 Algorithm and Decision Tree
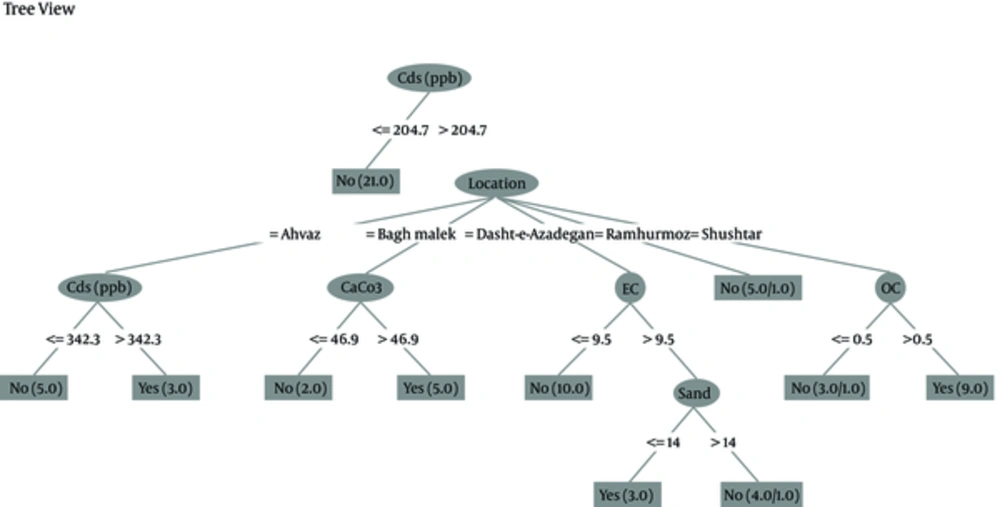
The data mining technique of classification, using the J48 algorithm, was performed on the dataset including 21 samples of concern, to determine a relationship between the results obtained from the classification trees by algorithm J48 methods. The decision tree was provided for the prediction (Figure 2). Some of the characters of the decision tree are shown in Table 5. The quality of the predictions made by applying the J48 model which is presented in Table 6, which indicates that the J48 normative model could predict the concentration of Cd in the rice seed accurately. The accuracy of decision tree in the current study was about 95.7%, which made a good predictive model (Table 5). This performance was confirmed by the MAE and RMSE values (Table 6). The Kappa coefficient was around 0.89, which was a great value for forecasting models (Table 7) (20).
| TP Rate | FP Rate | Precision | Recall | F-Measure | MCC | ROC Area | PRC Area | Class |
|---|---|---|---|---|---|---|---|---|
| 0.87 | 0 | 1 | 0.87 | 0.93 | 0.904 | 0.989 | 0.976 | Yes |
| 1 | 0.13 | 0.94 | 1 | 0.969 | 0.904 | 0.989 | 0.993 | No |
| 0.957 | 0.088 | 0.96 | 0.957 | 0.956 | 0.904 | 0.989 | 0.987 | Weighted Avg. |
Detailed Accuracy by Class for J48 Algorithm
| Value | |
|---|---|
| Correctly classified instances | 95.71% |
| Incorrectly classified instances | 4.29% |
| Kappa statistics | 0.8995 |
| Mean absolute errors | 0.0633 |
| Root mean squared errors | 0.1780 |
Performance Estimation for J48 Algorithm by WEKA Tool
| Poor | Slight | Fair | Moderate | Substantial | Almost Perfect | |
|---|---|---|---|---|---|---|
| Kappa | 0 | 0.2 | 0.4 | 0.6 | 0.8 | 1 |
| Kappa | Agreement | |||||
| < 0 | Less than chance agreement | |||||
| 0.01 - 0.20 | Slight agreement | |||||
| 0.21 - 0.40 | Fair agreement | |||||
| 0.41 - 0.60 | Moderate agreement | |||||
| 0.61 - 0.80 | Substantial agreement | |||||
| 0.81 - 0.99 | Almost perfect agreement | |||||
Interpretation of Kappa Coefficient
4.3. Conclusion
The current study used the algorithm J48 and prediction techniques to analyze Cd concentration in rice samples. It was demonstrated a comparative study of various classification J48 algorithms (C4.5) with the help of data mining tool WEKA. J48 algorithm is a simple designer to construct a decision tree, but it had the best result in the experiments. Various decision tree algorithms can be used to predict the concentration of Cd in rice seed. According to authors’ best knowledge, J48 had 95.71% accuracy, 0.899 Kappa coefficient, and less error (RMSE = 0.179), which made a good predictive model. In future, according to the results on less error and classification areas, it is recommended to build a fertilizer recommendation system, cropping pattern, and given soil.

