1. Background
Water, as a natural resource, is vital to human’s existence and is used for drinking, irrigation, domestic, industrial, and other purposes. In this regard, only 2.8% of water on earth is fresh water; therefore, groundwater resources are highly valued due to their certain properties such as wide-spread occurrence and availability, and also good quality as an ideal supply of drinking water; due to these reasons more than half of the world’s population depend on groundwater for survival (1-7). During the last few decades, contamination of groundwater resources is among the most important environmental issues due to hazardous chemical compounds such as heavy metals, pesticides, and petroleum hydrocarbons (8-15).
Heavy metals as an important environmental pollutant, particularly in regions with high anthropogenic pressure, can lead to serious adverse effects on all organisms. Some of the heavy metals such as Cu, Fe, Mn, and Zn are essential for growth, development, and health at low quantities, while they become toxic at higher concentrations. Others such as As, Cd, Cr, Hg, and Pb are categorized as toxic species on living organisms, even at trace amounts (16-20). Nowadays, overexploitation of groundwater resources for various purposes further affect the groundwater quality. Therefore, assessment of groundwater quality through analysis and prediction of heavy metals content is very important to provide useful information about the suitability of such resources, especially in agricultural areas, due to the application of commercial agrochemicals on agricultural production over the years (18, 21).
In the field of contamination of groundwater resources by heavy metals, the mean concentrations of As, Zn, Pb, and Cu (μg/L) in groundwater samples collected from Asadabad Plain, Hamedan Province, Iran in the spring were 52.53 ± 13.62, 15.51 ± 23.45, 10.10 ± 2.80, and 8.63 ± 10.87, respectively. While in the summer the mean content of metals was 57.60 ± 16.90 μg/L for As, 14.99 ± 17.66 μg/L for Zn, 9.28 ± 2.46 μg/L for Pb, and 10.45 ± 10.30 μg/L for Cu (22). In another study among the analyzed groundwater samples collected from Ghahavand Plain, Hamedan Province, the detected amounts of As ranged 2.92 to 13.67 μg/L, Zn 4.25 to 32.50 μg/L, Pb 0.05 to 11.92 μg/L, and Cu 1.55 to 15.68 μg/L in the spring, while the detected amounts of As ranged 3.10 to 17.16 μg/L, Zn 0.74 to 17.52 μg/L, Pb 0.21 to 13.68 μg/L, and Cu 1.10 to 20.08 μg/L in the summer (14). Yari and sobhanardakani reported that the mean concentration of As, Zn, and Pb (μg/L) in the groundwater resources of Qaleeh Shahin Plain, Kermanshah Province, Iran was 6.41 ± 3.41, 11.21 ± 4.83, and 4.52 ± 2.24 µg/L in the winter and 9.19 ± 6.09, 17.32 ± 8.71, and 6.46 ± 2.61 µg/L in the Summer, respectively (23). Artificial neural networks as nonlinear regression tools attracted a great deal of attention to solve environmental issues. In this regard, Anagu et al. applied ANN and multiple linear regression (MLR) to predict nine heavy metals (Cd, Cr, Cu, Mo, Ni, Pb, Sb, Tl, and Zn) in soils in Germany. The results of the study indicated that the ANN outperformed the MLR to estimate the concentration of heavy metals in soils (24). Liu et al. investigated the ANN model to predict concentration of heavy metals in rice. The proposed model showed good agreement between observed and predicted values (25). Rooki et al. compared performance of ANN, general regression neural network (GRNN), and MLR to predict heavy metals (Cu, Fe, Mn, Zn) of the Sarcheshmeh Copper Mine, Iran. The ANN model revealed more efficient performance compared with other models (26). Venkatramanan et al. applied ANN and multivariate approach to find the relationship between geochemical elements of groundwater and those of sediment in Busan, Korea. The results of the study indicated that compared with multivariate approach, the ANN had better accuracy to identify interrelationship among groundwater and sediment in terms of geochemical elements content (27). Shukla et al. developed a feed forward artificial neural network model to forecast performance of chitosan oligosaccharide-coated iron oxide nanoparticles to remove chromium contamination in water. The results revealed that the ANN had satisfactory ability to detect effective parameters to enhance efficiency of Cr removal from the contaminated water (28).
2. Objectives
Due to the geological structure of the study area, especially minerals containing As, Zn, Pb, and Cu (10), and also discharge of toxic heavy metals into the groundwater resources of Toyserkan Plain due to overuse of chemical inputs including chemical fertilizers, especially phosphorus fertilizers, zinc sulfate, and metal-containing pesticides, the current study aimed at developing a reliable model to predict the concentration of heavy metals in groundwater resources of Toyserkan Plain.
3. Methods
3.1. Study Area
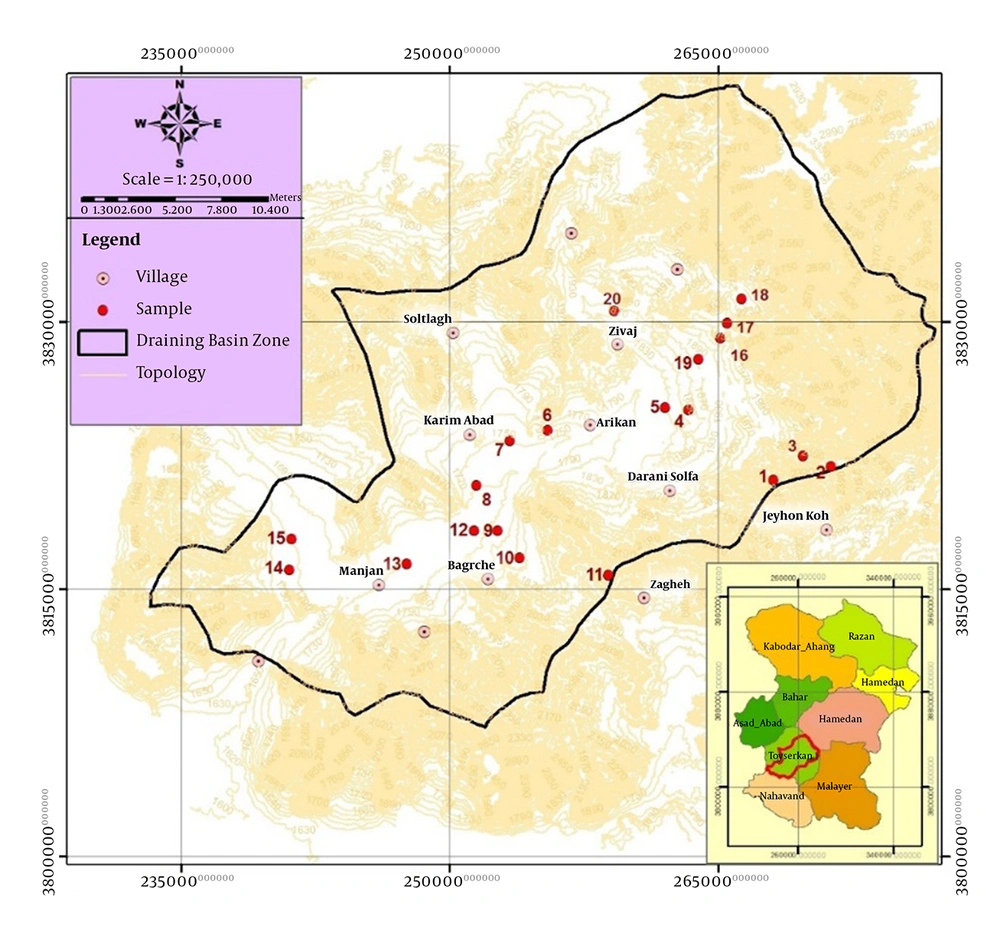
Toyserkan Plain with an area about 800 km2 is located in Toyserkan Township in Hamedan Province. Water requirement of most residents of this township is supplied from 1863 groundwater resources including 1243 wells, 400 springs, and 220 aqueducts (12).
3.2. Sample Collection and Preparation
Based on the Cochran sample size formula (n = (zs)2/d2; z = 1.645, s = 0.50 and d = 0.175) as well as the research constraints, especially lack of financial support, totally 60 groundwater samples were collected from 20 different wells located both in the residential and agricultural regions of the studied area from September to November. Figure 1 shows the locations of sampling stations. The groundwater samples were prepared for metal content analysis through the method described by Edet and Offiong (29). Finally, contents of As, Pb, and Zn in groundwater samples were determined using inductively coupled plasma-optical emission spectrometer (Varian, 710-ES, Australia) at the wavelengths of 188.98 nm for As, 220.35 nm for Pb, and 206.20 nm for Zn.
3.3. Artificial Neural Network
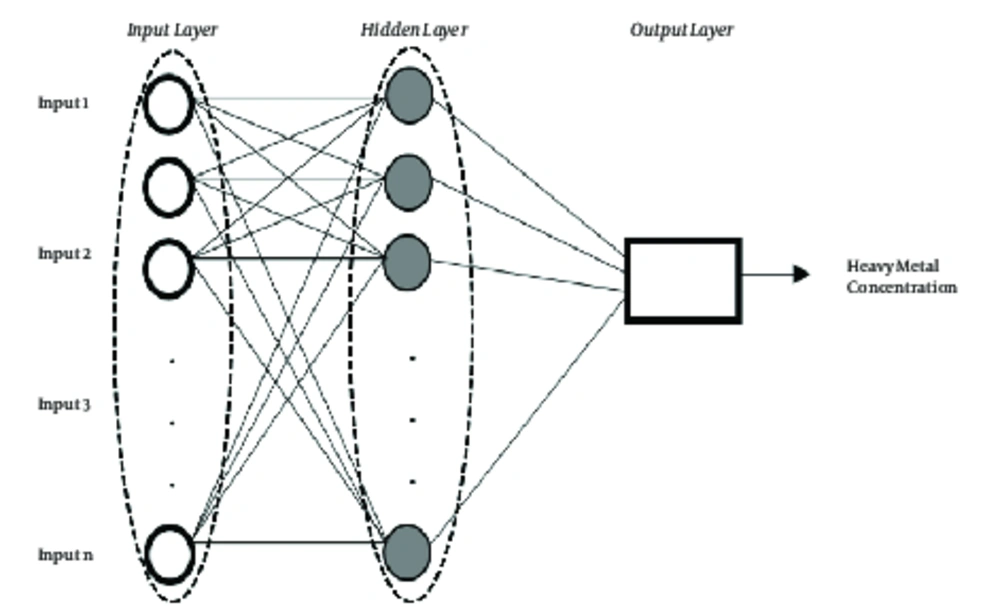
ANNs, as a robust data analysis method, have similar performances to biological systems of humans and animals (30, 31). They are useful to find the relationship between inputs and outputs in a noisy and complex dataset. One of the simple and reliable types of ANNs is multilayer perceptron (MLP). An MLP network constitutes an input layer, one or such hidden layers, and an output layer (12). In recent years, ANNs are successfully used in environmental settings (13, 31). In the current study, the Bayesian regularization algorithm was used to train ANN. This method automatically tunes variables of objective function to obtain optimum values. It can be noted that variables of the network such as the weights and biases are considered as random variables with assigned distribution. Moreover, one of the main benefits of BR is that it precludes over-training in the network. The previous studies successfully applied this algorithm to train ANN to solve different problems (32, 33). The mathematical formulation of the MLP can be expressed as follows:

Where xi and yi are nodal value in the previous layer of i, and nodal value in the present layer of j, respectively. The bi parameter and wji denote bias and weight connection. It can be also noted that N and f stand for the number of nodes and the activation function, respectively (34). Figure 2 shows that the schematic MLP has one hidden layer.
3.4. Particle Swarm Optimization
PSO, as a reliable and efficient evolutionary algorithm can solve complex and nonlinear optimization problems (35). This swarm intelligence based algorithm satisfactorily solved global optimization problems compared with other methods. PSO is an evolutionary technique based on social methods such as fish schooling and bird flocking (36). Based on mathematical concept of PSO, three main parameters play important roles: position, velocity, and fitness. The main step of PSO to solve any optimization problems is as follows:
1. Initializing a population of individuals (particles) with random velocities and positions in the domain of the problem.
2. Computing the fitness value for all particles.
3. Investigating fitness of particles.
4. Updating the velocity and position of particles using equations (2) and (3).


Where r1 and r2 are random numbers, c1 and c2 stand for acceleration constants; ω, χ, Pt and Gt indicate inertia weight, constriction coefficient, pbest, and gbest, respectively. The fitness of each particle is calculated via mean square error of the neural network as follows:

Where f is the fitness function, tkl and pkl are observed and predicted values based on wi, respectively (37). The most important benefit of PSO approach is its low computational cost and simple coding (38). Since PSO algorithm performed accurately to solve global optimum, it was applied to train the MLP in the current study.
3.5. Performance Evaluation
In the current study, accuracy of models to predict heavy metals in the Toyserkan Plain was evaluated using root mean square error (RMSE), determination coefficient (R2) and Pearson correlation coefficient (r). The statistical indictors utilized in the study can be characterized as:


Where Cio and Cip are the observed concentration and predicted concentration of heavy metals, and n is the data number, respectively; Cio and Cip are the mean of the observed and mean of the predicted concentration of heavy metals, respectively.
4. Results
The concentrations of As, Zn, Pb, and Cu in the groundwater samples are presented in Table 1. Data in Table 1 indicate that the mean concentration of elements in groundwater samples was 3.67 ± 2.23, 3.84 ± 4.23, 1.66 ± 1.50, and 8.59 ± 3.19 μg/L for As, Zn, Pb, and Cu, respectively (Table 1). Comparison of the heavy metals concentrations in the groundwater samples under study with those of the maximum permissible limits 10.0, 5000.0, 100.0, and 1000.0 for As, Zn, Pb, and Cu µg/L, respectively established by food and agriculture organization/the world health organization (FAO/WHO) (39, 40) showed that the mean concentrations of all metals in groundwater samples were lower than those of the MPL. In this regard, Sobhanardakani et al. determined the contents of heavy metals in groundwater samples of Razan Plain, Hamedan Province, and reported that the average levels of elements with 3.67 ± 2.23, 3.84 ± 4.23, 1.66 ± 1.50, and 8.59 ± 3.19 μg/L for As, Zn, Pb, and Cu, respectively, were lower than those of the MPL (8, 11). In another study, the mean contents of As and Pb in groundwater resources collected from Dhemaji district, Assam, India were reported 8.0 ± 4.80 and 287.0 ± 45.0 μg/L, respectively, in dry season and 6.0 ± 3.40 and 194.0 ± 47.0 μg/L, respectively, in wet season (41), while the Pb and Cu concentrations in groundwater collected from downward through the tailing dam of Miduk Copper Complex, Kerman, Iran ranged 500.0 to 16100.0 μg/L and 20.0 to 290.0 μg/L, respectively (42). Also, Ramesh and Elango reported that the contents of elements in groundwater resources from Tondiar River Basin, Tamil Nadu, India with an average of 27.50, 0.10, and 9.90 μg/L for Zn, Pb, and Cu, respectively, and for all metals were lower than those of the MPL (43).
| Element | Min. | Max. | Mean ± S.D. |
|---|---|---|---|
| As | 0.08 | 7.48 | 3.67 ± 2.23 |
| Zn | 0.12 | 15.64 | 3.84 ± 4.23 |
| Pb | 0.09 | 5.50 | 1.66 ± 1.50 |
| Cu | 0.89 | 13.58 | 8.59 ± 3.19 |
Statistical Properties of Element Concentrations in Groundwater Resources of Toyserkan Plain
In the current study, PSO was applied to train ANN to enhance the convergence and performance of the predictive models. The same training and testing sets were applied to develop ANN-PSO and ANN-BR approaches. The observed information was divided into training and testing periods (80% and 20%, respectively). To obtain the optimum output, trial and error process was applied to find the best value for the number of hidden node, iteration, and type of activation function. For the proposed models, sigmoid and linear functions were applied for the hidden and output node activation functions, respectively. Moreover, seven hidden neurons and 500 iterations were selected for the ANN-BR models. The optimal parameters for ANN-PSO were as follows:
(a) Number of hidden neurons = 7.0
(b) Number of iterations = 300
(c) Number of particles = 25
(d) c1 and c2 = 2.0
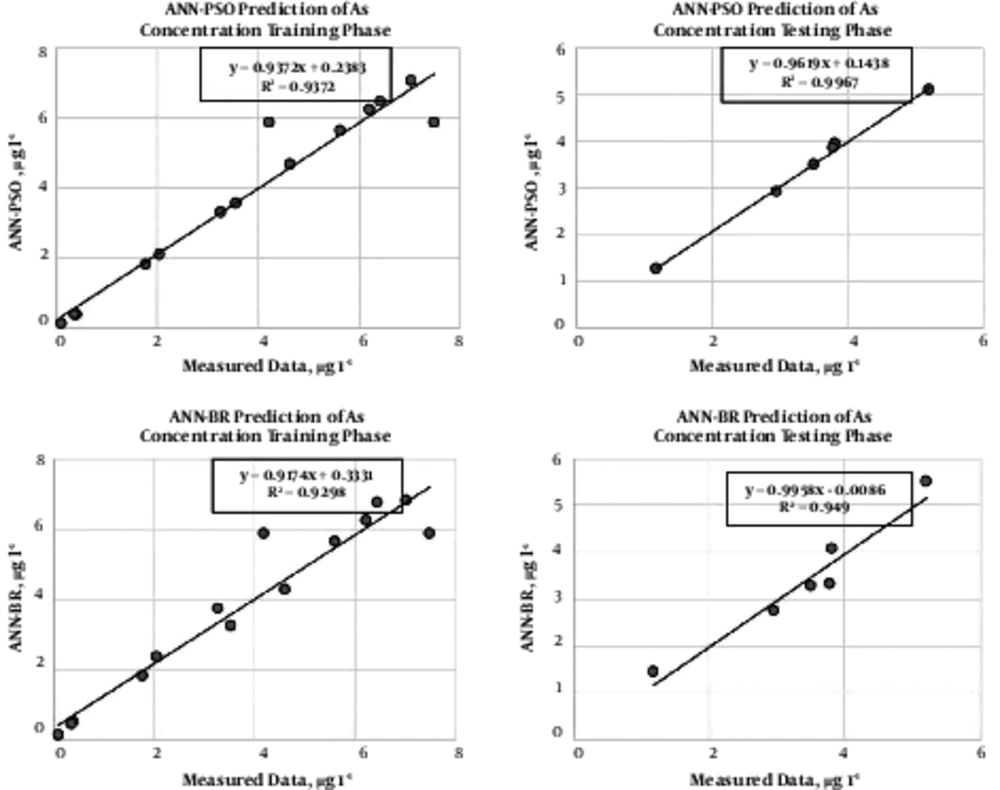
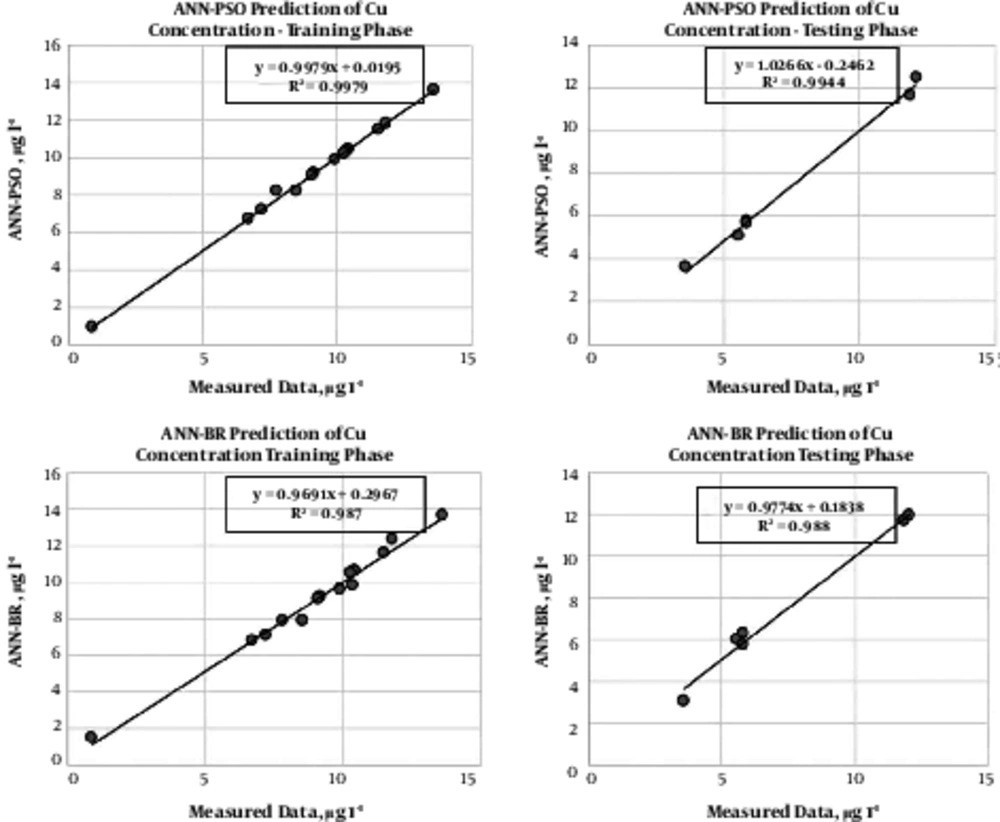
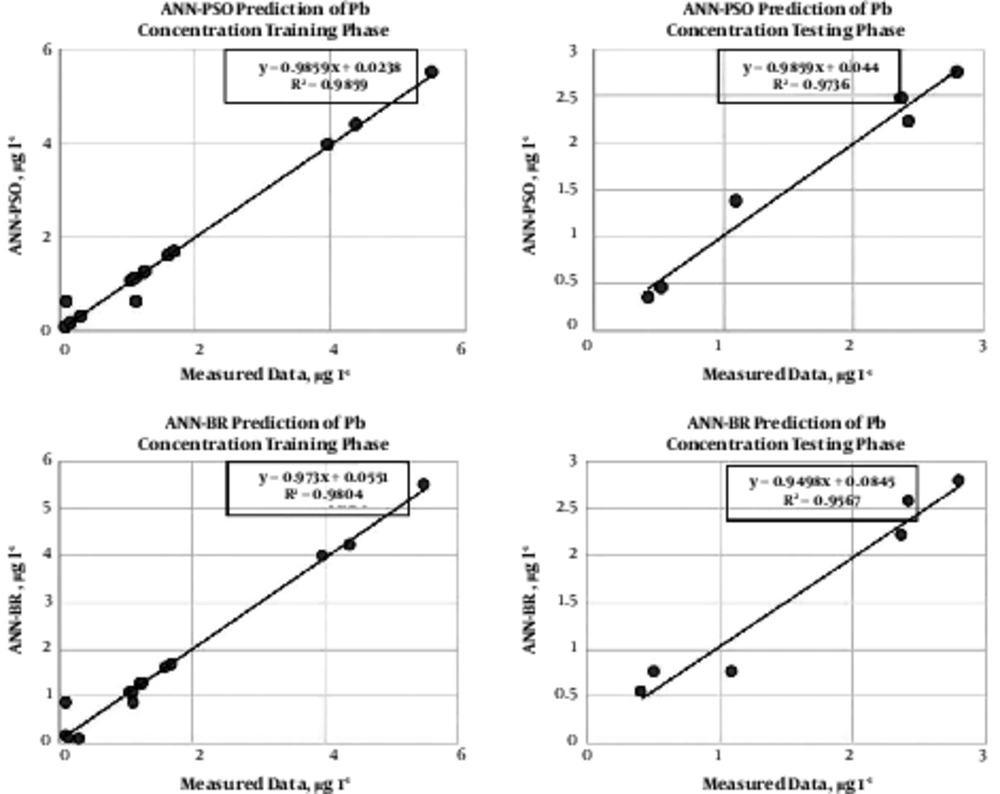
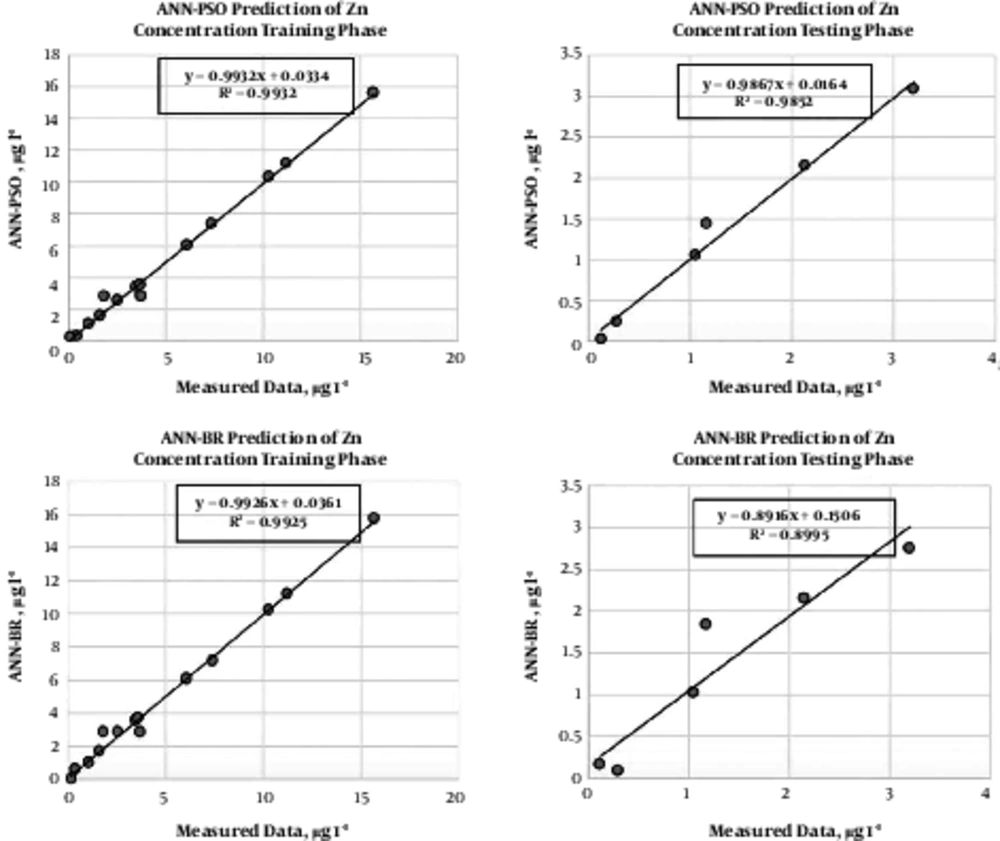
To evaluate the accuracy of ANN-PSO method, an ANN-BR was developed with the similar data used in the ANN-PSO. Observed and predicted concentrations of heavy metals at training and testing periods for ANN-PSO and ANN-BR models were compared as shown in Figures 3 - 6. In order to investigate performance accuracy of models, three statistical indicators including RMSE, R2, and r were used. It was noted that the ANN models and the PSO algorithm to forecast heavy metal concentrations were developed with MATLAB R2014 software program.
5. Discussion
As mentioned before, in the current study, a three-layer neural network with two different training algorithms including particle swarm optimization and Bayesian regulation were utilized. A graphical performance of ANN-PSO and ANN-BR approaches is presented in Figures 3 - 6, as scatterplots of predicted and observed values of As, Cu, Pb, and Zn concentrations both for training and testing periods. Table 2 demonstrates the training and testing accuracies of the ANN-PSO and ANN-BR to predict concentrations of heavy metals. The dataset utilized under study was divided into two groups including training and testing.
| Heavy Metal Concentration/Method | Training | Testing | ||||
|---|---|---|---|---|---|---|
| RMSE | r | R2 | RMSE | r | R2 | |
| As> | ||||||
| ANN-PSO | 0.6199 | 0.968 | 0.9372 | 0.082 | 0.9983 | 0.9967 |
| ANN-BR | 0.6567 | 0.9642 | 0.9298 | 0.2902 | 0.972 | 0.9449 |
| Cu | ||||||
| ANN- PSO | 0.1342 | 0.9989 | 0.9979 | 0.273 | 0.9971 | 0.9944 |
| ANN- BR | 0.3348 | 0.9934 | 0.987 | 0.3622 | 0.9939 | 0.988 |
| Pb | ||||||
| ANN- PSO | 0.1947 | 0.9929 | 0.9859 | 0.1559 | 0.9867 | 0.9736 |
| ANN- BR | 0.245 | 0.9901 | 0.9804 | 0.1999 | 0.9781 | 0.9567 |
| Zn | ||||||
| ANN- PSO | 0.3685 | 0.9956 | 0.9932 | 0.1297 | 0.9925 | 0.9852 |
| ANN- BR | 0.3877 | 0.9962 | 0.9925 | 0.3378 | 0.9484 | 0.8995 |
Determination Coefficient, Pearson Correlation Coefficient, and Root Mean Square Error Goodness of Fit Criteria for Predictive Models
As can be observed in Figure 3, there was a good agreement between the simulated and predicted values. The parameters RMSE = 0.2902, R2 = 0.9449, and r = 0.972 in contrast with the RMSE = 0.082, R2 = 0.9967, and r = 0.9983 showed that the ANN-PSO had a better performance to predict As concentration. For the heavy metal Cu, the predictions of the two models are presented in Figure 4. The scatterplots indicated that the ANN-PSO estimations were closer to the observed concentrations compared with those of the ANN-BR model. The ANN-PSO and ANN-BR models for Cu concentration had a testing RMSE of 0.273 and 0.3622, respectively (Table 2) indicating better performance of the ANN-PSO in estimating Cu concentration. The observed and predicted values of Pb concentration using the ANN-PSO and ANN-BR models are shown in Figure 5. According to Table 2, the ANN-PSO had a lower RMSE (0.1559), and higher R2 (0.9736) and r (0.9867) in the testing period. Here also, the ANN-PSO model performed better than the ANN-BR model. For the Zn concentration, the ANN-PSO had a lower RMSE (0.1297), and higher R2 (0.9852) and r (0.9925). Figure 6 shows the better performance of the ANN-PSO model over the ANN-BR model.
Overall, according to the scatterplots, both in the training and testing periods, the ANN-PSO results indicated more agreement with the observed data than the ANN-BR model for all heavy metal concentrations. The results proved the efficiency and compatibility of the ANN-PSO model to establish effective strategies to solve environmental problems.
5.1. Conclusions
In the current study, a new method based on coupling PSO and ANN was used to forecast the concentration of heavy metals (As, Pb, Cu, and Zn) in groundwater resources of Toyserkan Plain. The ANN-PSO and ANN-BR models were compared using RMSE, R2, and r. Based on the obtained results, the mean concentrations of elements as 3.67 ± 2.23, 3.84 ± 4.23, 1.66 ± 1.50, and 8.59 ± 3.19 μg/L for As, Zn, Pb, and Cu, respectively, in groundwater samples were lower than those of the MPL. Also, the ANN-PSO was more accurate both in the training and testing phases than the ANN-BR to predict concentration of heavy metals in groundwater resources. In general, the satisfactory results of the ANN-PSO model demonstrated that the proposed model can be a useful tool in the area of environmental problems.

