


1. Background
One of the important issues, which has attracted economists, is human capital. The inclusion of human capital in theories of endogenous economic growth began with Arrow (1) and Uzawa (2). This process was completed with Lucas’ work (3, 4). The role of human capital in acceptable economic performance has been confirmed by various studies (5-9). Lucas (4) and Jones (10) believe that the difference between the production of poor and rich countries can be explained by the difference in the level of human capital of countries.
Since the two aspects of education and health are the main constituents and key factors of human capital, the level of health in the community has an important impact on human capital formation. Improving health in the society reduces mortality and increases life expectancy and, as a result, will encourage people to make greater savings. The pursuit of increasing savings in the physical capital community will increase, which will also affect labor productivity and economic growth (11).
The level of health is one of the three dimensions of the United Nations human development index, which uses life expectancy at birth as a variable representing the health of the community. Long life is possible in the light of the availability of suitable health facilities for citizens. Healthy people are more refreshed and energetic and have a better positive outlook on life. Healthier employees do more and perform better work than others and have a more creative and ready mind. It can be said that health directly influences labor productivity and consequently economic growth and development (12).
The importance of awareness of development has made the investigation of development level a research priority among researchers. Grossman (13) considered health as an important part of human capital and derived the pattern of demand for health from the perspective of human capital. He distinguished between health as a commodity and capital goods. Health, on the other hand, directly affects the utility of people as a commodity. On the other hand, health, as a capital item, reduces the number of sick days and, consequently, increases the number of days available to people’s productive activities. Soares et al. (14) provided a development ranking from the Belgian regions to support the regional development policy. This classification was made using 33 economic, health, educational, cultural, etc. indicators.
Local research has been conducted at two national and provincial levels from general and detailed perspectives (industry, healthcare, etc.). From the general point of view, one can refer to studies conducted by Jamali et al. (15), Zarabi and Shahivandi (16), and Abdollahzade and Sharifzadeh (17). On the other hand, studies have examined the health aspect more closely. Zarrabi and Shaykh Baygloo (18) studied the level of development of healthcare indicators in Iranian provinces; 32 indicators were used for this analysis. The results showed that the five factors of expert human resources, rural health services, pharmaceutical services, public healthcare services, and private healthcare accounted for 61% of the differences in the degree of development within the provinces. Pourrashno et al. (19) used 17 indicators to study and compare the degree of development of healthcare sector in Iranian provinces during year 2008. The results showed that the provinces of Ilam, Chaharmahal and Bakhtiari, Isfahan, Yazd, Mazandaran, Semnan, and Gilan were in a better status than other provinces. Ahangari and Baghlani (20) studied the developmental status of Khuzestan in terms of healthcare indicators using numerical taxonomy method, during years 2008 and 2013. The results showed that inequality among the cities of Khuzestan had decreased over the above-mentioned years.
The above-mentioned theoretical and empirical discussions show the importance of development of the healthcare sector and the reduction of the regional inequality in health indicators in development plans. These goals are included in the Sixth Development Plan of the Islamic Republic of Iran. The major goals of the Fifth and Sixth Development Plans of the Islamic Republic are to promote equity in healthcare services, reduce inequality, and establish regional balance in the country (Fifth Plan, health section, article 42; Sixth Plan, health section, article 74). The Fifth Plan, in line with the prospective plan for the year 2025, emphasized on human health and suggested a comprehensive health approach. The following are among features that indicate the efforts of this plan to develop the healthcare sector (Fifth Development Plan, healthcare sector): Assigning 10% of the total net funds proceeds from implementing targeting subsidies law (in addition to the healthcare sector’s special credits) to the healthcare sector in order to fulfill the health equity index, reducing the direct share of people’s expenses to a maximum of 30% of healthcare costs, providing people with equality access to healthcare services, covering medication, treating specific and high-grade patients, reducing the dependency of affiliated healthcare units on specific incomes, helping to train and provide expert human resources, and supplying Iranians health insurance.
Obviously, in order to obtain good health policy-making and achieve the mentioned goals during the Sixth Program, it is necessary to consider the status of health indicators in provinces of the country, relative to each other, at the end of the Fifth Plan (2015).
In this case, the spatial distribution of facilities and health services among the provinces of the country can be studied. Spatial distribution is a concept that in economic and social studies represents features of distribution of facilities in different regions.
In this research, using the selected indicators, the spatial distribution of health facilities and services in Iran will be examined to answer the following two questions:
1. How is the status of health indicators in Iranian provinces, relative to each other in the final year (2015) of the Fifth Development Plan?
2. How is the impact of improvement of health indicators in a province, on the health indicators of neighboring provinces?
2. Objectives
In this research, the level of development of the healthcare sector in Iranian provinces at the end of the Fifth Development Plan (2015) was examined and compared. Moreover, the current researchers studied the impact of a greater focus on healthcare facilities and services in one province on the neighboring provinces. It should be noted that in this research, the assessment of health indicators and ranking of the provinces, was carried on the basis of 17 selected structural indicators, whose data were available. Nevertheless, the results of this research can be useful for planning in the healthcare sector, during the Sixth Development Plan.
3. Methods
In the present study, to answer the first and second questions mentioned in the introduction, the TOPSIS method and Moran test were used, respectively.
3.1. TOPSIS Method
The TOPSIS method was used to calculate the development of healthcare index and its ranking in the provinces. The development of the TOPSIS method for solving multiple criteria decision-making problems was carried out by Hwang and Yoon in 1981 (21). In this method, the more data about one option (province) are closer to the ideal value and farther from the lowest value (negative ideal), the more preferable is the option (22). The simulation results conducted by Zanakis et al. (23) also showed that the TOPSIS method has the least change in the rank compared to other multiple criteria decision-making methods. This method is the most well-known method for solving multi-criteria decision-making problems (24). The steps of the TOPSIS procedure are as follows (21, 23):
Creation of the initial matrix of indices: A matrix with n row (province) and m column (index) is formed.
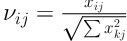
xij is ith option to jth index.
Creation of a harmonized standard matrix (A) according to weights (W), obtained by proper weighting procedure: The determined weights as a diagonal matrix (the main diameter includes the weight of each index and the rest are zero) are multiplied in the standard matrix: (A = V × W)

Calculation of differences of positive (

Calculation of the relative closeness of each option to ideals: For each option, relative closeness was calculated as a fraction.
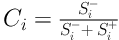
Regarding the above-mentioned ratio, a lower positive distance and a higher negative distance meant a greater fraction; this relationship indicates the proper conditions of the option.
3.2. Moran Coefficient
The Moran coefficient was used to assess the distribution of healthcare facilities in the provinces. This coefficient shows the correlation between the value of a variable for different regions and neighboring regions that was calculated as follows (26):
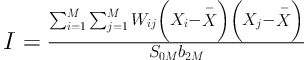
Where M indicates the number of regions, Xi, Xj show the value of the variable for i, j regions,
The computational statistic is calculated as
The data used to calculate the healthcare development index was collected from the Statistical Center of Iran (28) and used with required adjustments. The mentioned source is published annually for the provinces of the country by the Statistical Center of Iran and provides data on various fields, such as industry, agriculture, and health. The focused indicates included the per capita general practitioner, specialist, dentist, pharmacist, medical diagnostic laboratory, hospital, hospital available bed and paramedic, percentage of population covered by urban wastewater collection and disposal services; the per capita primary care centers, rehabilitation centers, nuclear diagnostic and therapeutic establishments, number of clinics and polyclinics, emergencies, veterinary staff and veterinary treatment centers. These indicators (except the case of percentage) are derived from the division of inventory of each facility to the provinces population.
The research constraints were mainly related to the provision and supply of required data for the provinces. As a result, 17 indicators were used in this study.
4. Results
4.1. Ranking the Provinces in Terms of the Health Index
To better understand the conditions for governing the distribution of healthcare services between Iranian provinces in 2015, first, the health promotion index based on the data obtained from 17 indicators was calculated and the results are presented in Table 1.
| Rank | Province | Development Index |
|---|---|---|
| 1 | Semnan | 0.556 |
| 2 | Markazi | 0.535 |
| 3 | Ilam | 0.534 |
| 4 | Yazd | 0.515 |
| 5 | Southern Khorasan | 0.505 |
| 6 | Mazandaran | 0.482 |
| 7 | Hamedan | 0.4762 |
| 8 | Chahar Mahal & Bakhtiari | 0.4761 |
| 9 | Esfahan | 0.4456 |
| 10 | Hormozgan | 0.446 |
| 11 | Kohgiluyeh & Buyer Ahmad | 0.433 |
| 12 | Gilan | 0.427 |
| 13 | Zanjan | 0.422 |
| 14 | Fars | 0.420 |
| 15 | Tehran | 0.411 |
| 16 | Eastern Azarbayejan | 0.407 |
| 17 | Kermanshah | 0.390 |
| 18 | Northern Khorasan | 0.387 |
| 19 | Kordestan | 0.384 |
| 20 | Qazvin | 0.382 |
| 21 | Golestan | 0.379 |
| 22 | Bushehr | 0.375 |
| 23 | Lorestan | 0.372 |
| 24 | Western Azarbayejan | 0.369 |
| 25 | Ardebil | 0.365 |
| 26 | Razavi Khorasan | 0.361 |
| 27 | Qom | 0.314 |
| 28 | Kerman | 0.294 |
| 29 | Sistan & Baluchestan | 0.287 |
| 30 | Alborz | 0.267 |
| 31 | Khuzestan | 0.266 |
Health Index in the Provincesa
Table 1 shows the level of health index in the provinces and its ranking based on the resources and facilities used in this study.
4.2. Spatial Dispersion of the Level of Health Index in the Provinces
Moran coefficient test showed how the value of a variable for different regions is correlated with neighboring regions. By determining the neighborhood matrix W with respect to the province’s neighboring status, the Moran coefficient and the Z parameter are calculated to run its significant test:
According to the results, this coefficient is significant at the 90% level.
5. Discussion
According to Table 1, there is a clear difference in the level of health index in the provinces. Regarding the healthcare status, the first five provinces, including Semnan, Markazi, Ilam, Yazd, and Southern Khorasan, with average of 0.529, were the most benefited provinces, respectively. On the other hand, Qom, Kerman, Sistan and Baluchestan, Alborz, and Khuzestan, with an average of 0.285, were the most deprived provinces, respectively. The above-mentioned figures indicate that on average, the level of health index in the five privileged provinces was about twice as high as the last five provinces in the table. Moreover, the level of index for Semnan was more than twice as high as Khuzestan in the last rank. Despite the important role it has in terms of wealth resources in the country and according to some researches, Khuzestan was the most industrialized province in the country in 2015 (29). Nevertheless, it is the most deprived province in the country in terms of healthcare services. Part of this deprivation could be due to the lack of compensation for the backwardness caused by the years of the imposed war. Statistics on healthcare indicators (Yearbooks of statistics centers of provinces, 2015) shows that regarding the per capita general practitioner, specialist, dentist, pharmacist, and paramedic, Khuzestan has the lowest rate among the provinces of the country. For example, while in the final year of the Fifth Program (2015), the average number of specialists in the country was about 0.30 and the highest rate in Semnan was 0.59 per 1000 individuals, this number in Khuzestan was equal to 0.06.
Also, the negative factor of Moran coefficient shows the establishment of a raster distribution of the level of development of healthcare facilities in the provinces of Iran. In other words, the concentration of healthcare facilities in one area coincides with fewer opportunities in neighboring areas. Establishing a pattern of raster distribution on the level of development of resources and healthcare facilities among Iranian provinces suggests that current trends and situations may lead to more dispersion and regional inequality.
5.1. Conclusion
In the present study, using 17 indicators, the spatial pattern of the provinces of Iran was shown in terms of the level of development of healthcare indicators in the final year of the Fifth Program (2015) and the provinces were ranked accordingly. The apparent inequality in the health index indicated an imbalanced distribution of resources and facilities in this section. It was also found that the pattern was such that the concentration of health resources and facilities in a province would be accompanied by the reduction of facilities and the benefit of neighboring provinces. Based on the results, if no action is taken to improve the allocation and distribution of healthcare facilities across different regions, inequality and imbalances in this area could increase, which contradicts the objectives of the Fifth and Sixth Development Plans for reducing inequality in the benefit of the community of healthcare services and balanced regional development. According to the results of the research in 2015, among 31 provinces of the country, Qom, Kerman, Sistan and Baluchestan, Alborz, and Khuzestan were the most deprived provinces in terms of healthcare services, respectively. The average development index of these provinces was about 50% less than the five privileged provinces. Of these five provinces, Khuzestan and Sistan and Baluchestan were geographically bordering areas.
