1. Background
Nowadays, global water consumption, dwindling water resources, and high-quality water scarcity in many world regions have considerably highlighted the demand for developing alternative means for freshwater resources (1, 2). One of the effective approaches is to desalinate the abundant sea water resources. Seawater desalination system using reverse osmosis (RO) is one of the most dominant desalination processes despite the complexity of design and high maintenance costs (3, 4). RO is used to remove a large portion of contaminants from water by pushing water under pressure through a semi-permeable membrane.
Entry of contaminants into the RO systems is one of the critical issues which causes a dramatic impact on RO membranes’ performance. These undesirable contaminats and deposits cuase RO membrane fouling, which simultaneously increases the maintenance operation costs (1, 2).
Moreover, reduced water qulaity, short lifetime of membranes, and high chemical injections and energy consumption are the consequences of presence of contaminants and membrane fouling (5-7). Types of contaminants are basically categorized as soluble minerals, suspended inorganics and organic and biological pollutants (6, 8, 9). Each of these pollutants results in serious damages to membranes of RO systems. Hence, characterization of these pollutants on the one hand and applying effective measures to remove them on the other hand are of great importance.
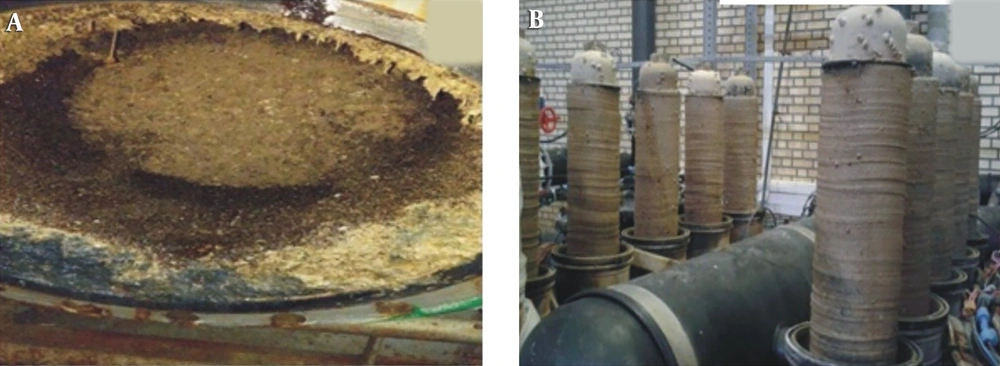
The water salinity of Persian Gulf is extremly higher than the other seas. The Persian Gulf salinity varies from 36% to 44% and slightly increases with depth. Total dissolved solids (TDS) value of Persian Gulf water in some regions exceeds 45000 mg/L, which results in natural crystallization of the dissolved salts and scaling (2). Therefore, different types and amounts of contaminants including suspended organic and biological pollutants, biodeposits, barnacles and inorganic pollutants pass through the filters and enter RO systems (10, 11). Additionally, red tide attacks are considered as the most intense attacks in this region, which contribute to membrane damage. Figure 1A and B indicates some of the contaminants for the currently studied site. As can be seen, organic and inorganic pollutants, biological deposits, barnacles, and green, and red and blue red tides cause biological growth and deposition in water-intake systems, pumping stations, pre-treatment units, RO membranes, and their water passage paths.
Most RO plants have post-treatment filtration or disinfection systems. Disinfection is one of the dominant pretreatment methods which is highly useful for destroying microorganisms (2). There are various types of disinfection methods in which UV lamps (electrical method) and chlorination (chemical method) are two of the most commonly employed methods. Chlorine is one of the effective chemical disinfectants added to water to dissociate and oxidize microorganisms (12, 13). The efficacy of chlorine is dependent on the pH of water, chlorine concentration, and exposure time (14). There are different chlorine species (2) such as hypochlorite, chloroamines, and chlorine dioxide. One of the factors that affects the injection amount of chlorine is silt density index (SDI). SDI and turbidity (nephelometric turbidity unit [NTU]) are important indictors of low levels of suspended contaminants, which should be monitored and controlled regularly for membrane performance.
In the present study, the removal of organic contaminants has been studied through disinfection pretreatment method using calcium hypochlorite. The correlation between turbidity, SDI and the residual chlorine (ORP) has been studied as well. Besides, the effects of SDI control via chlorine injection on the lifetime of cartridge filters and final operation costs was studied.
Although fundamental parameters of raw inlet water such as SDI, turbidty, and ORP play a key role in operating and maintenance of membranes of reverse osmosis, very few studies have been carried out to investigate the correlation between them.
2. Objectives
The aim of the current study was to identify the correlations between SDI, turbidty and ORP parameters in order to optimize the amount of chlorine injection.
3. Methods
3.1. Chemical Solutions
Detailed concentrations of the used chemical solutions are given in Table 1. Calcium hypochlorite is used as a disinfectant to inactivate pathogenic microorganisms. Calcium hypochlorite 65% chlorine (hypochlorite) by weight is normally dissolved in water to form a solution. The amount of injection depends on the amount of organic and biological contaminants of raw water and SDI value of the RO units. Poly aluminum chloride (PAC) is used as a coagulant to enhance particulates collection by lowering repulsive interactions between particles. According to the results of Jar test, the amount of coagulant solution can be estimated. Polyacrylamide as a coagulant aid solution with the trade name of Ulteraclear (RSCO27232) is injected into raw water based on the optimal conditions in the Jar test.
| Chemical Solutions | Average Dosing (PPM) | Average Dosing, kg/Mon |
|---|---|---|
| Calcium hypochlorite (65%) | 4.5 | 3137 |
| Poly aluminum chloride | 3 | 2091 |
| Polyacrylamide | 3 | 2091 |
Concentrations of Used Chemical Solutions
3.2. Control Parameters Determination
Inlet turbidity is a measure of the degree to which water loses its quality and transparency because of suspended particulates. The turbidity of raw water is measured by the turbidity apparatus (AQUALYTIC, AL250T-IR model) through nephelometric light method.
Silt density index (SDI) is a parameter characterizing the fouling propensity of water, which is one of the fundamnental parameters in RO membrane processes (15). Based on ASTM D 4189-95 (16), SDI analysis evaluates the quantity of matter in water based on the time required to filter a volume of the feed water through a 0.45-μm filter at a constant pressure of 20.86 KPa (30 PSI) (9, 16). In fact, SDI is the percent drop per minute in permeate flux through the filter, which is an average of 15 minutes. The maximum value of SDI 15 to predict the fouling capacity is less than 5, and its optimum value is less than 3 (17, 18). The measurement of SDI values is carried out by the AQUALYTIC apparatus of the SDI meter model for a period of 15 minutes using the following formula:

Where ti is the initial time in seconds required to fill the 100-mL sample for the first time. tf is the final time in seconds required to fill the 100-mL sample for a second time after 15 minutes. T denotes the time of 15 minutes for the exit flow between first and second sampling times.
The oxidation reduction potential (ORP) is a measure to identify the degree of oxidation/reduction of materials. The ORP value changes show the amount of injected or residual chlorine (after injection) and the usual reaction time (19). The amount of injected chlorine is measured every two hours by the ORP meter online machine (JUMO brand), based on millivolt. The amount of residual chlorine in terms of mg/L is measured by the MD200 LOVIBOND machine using a spectrophotometric method with DPD specification.
In a three-month study, with the stabilization of the desalination system, the process data and the above-mentioned variables were systematically recorded. The data bank contains 378 data. Some of the processed data are presented in Table 2.
| Nephelometric Turbidity Unit (NTU) | Qxidation Reduction Potential (ORP) | Silt Density Index (SDI) |
|---|---|---|
| 69 | 616 | 4.9 |
| 58 | 380 | 3.7 |
| 54 | 360 | 3.8 |
| 48 | 370 | 3.5 |
| 41 | 350 | 4.3 |
| 55 | 280 | 4.9 |
| 68 | 510 | 4.5 |
| 65 | 570 | 4.2 |
| 56 | 530 | 4.3 |
| 63 | 510 | 3.9 |
| 67 | 540 | 3.7 |
| 65 | 501 | 3.4 |
| 68 | 370 | 3.6 |
| 67 | 495 | 4.8 |
| 65 | 540 | 4.3 |
Typical Process Data
Pressure difference is the difference in pressure measured before and after for equipment such as filter cartridges and membranes, which indicates the obstacle level against water passage and is measured by a pressure gauge based on bar unit.
3.3. Description of the Operation Process
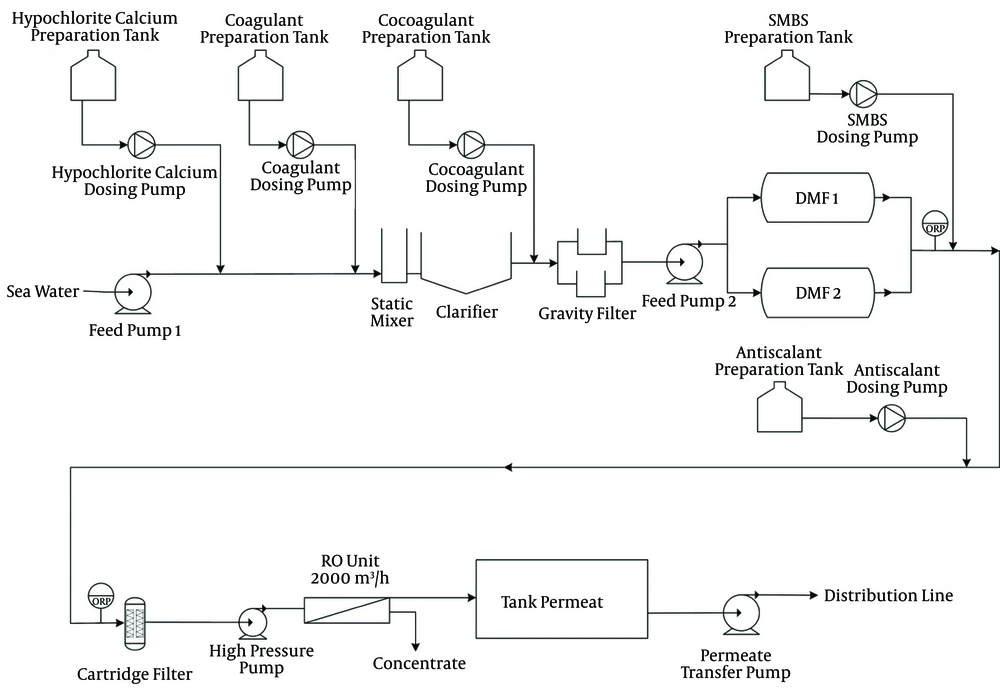
The operation process includes water-intake unit, pre-treatment unit, and RO systems. The pre-treatment unit includes clarifiers, gravity sand filtering, high pressure filter, and filter cartridges. First of all, chemical solutions including chlorine disinfectant and coagulants are injected into the water. Then, water enters the clarifier to remove the suspended particles and water turbidity. The turbidity reduction efficiency in clarifier is more than 80%. To efficiently eliminate the causing factors of turbidity and RO pollutants, the water enters the gravity sand filter at a rate of 8 m/h. NTU value of less than 1 can be reached when the water passes through the pressure sand filters. Filtration rate in these sand filters is more than 17 m/h. Afterwards, water enters the filter cartridges to control the amount of SDI. Filter cartridges are polypropylene cylindrical filters with a pore diameter of 5 and 1 microns, which prevent the entry of fine particles to membranes. Therefore, the SDI value is dependent on the performance of the pre-treatment system and chemical injections. The RO unit production capacity is 2000 m3/day and has 154-SWFilmtec membranes. The schematic diagram of the process is shown in Figure 2.
4. Results
4.1. Analysis of Raw Water Inlet
Typical water quality measurements made at 34.5°C are provided in Table 3. In order to determine the severity of organic pollution of the input water, tests including biochemical oxygen demand (BOD) and chemical oxygen demand (COD) were performed four times by the water and wastewater company based on the Standard Test Method (2012) (20, 21). COD is defined as the total quantity of oxygen required to oxidize all organic materials, and BOD is defined as the amount of oxygen required by bacteria while decomposing organic matter (22). COD values are always greater than BOD values. The results demonstrated that the high values of BOD and COD in raw water are due to the presence of organic and biological pollutants.
| Factor Name | Amount | Unit |
|---|---|---|
| COD | 27 | PPM |
| BOD | 19 | PPM |
| pH | 7.75 | - |
| Turbidity | 35 | NTU |
| Temperature | 34.5 | °C |
| TDS | 45000 | mg/L |
Raw Water Analysis
4.2. Correlation Between Control Indices
Figure 3 shows the variations of seawater turbidity (NTU) and SDI at a constant value of injected chlorine (470 mV). The values of turbidity are divided by 10. Identical reduction in turbidity values can be seen while the SDI value altered insignificantly. Indeed, the SDI value measurements at constant chlorine injection revealed no changes at high or low levels of turbidity.
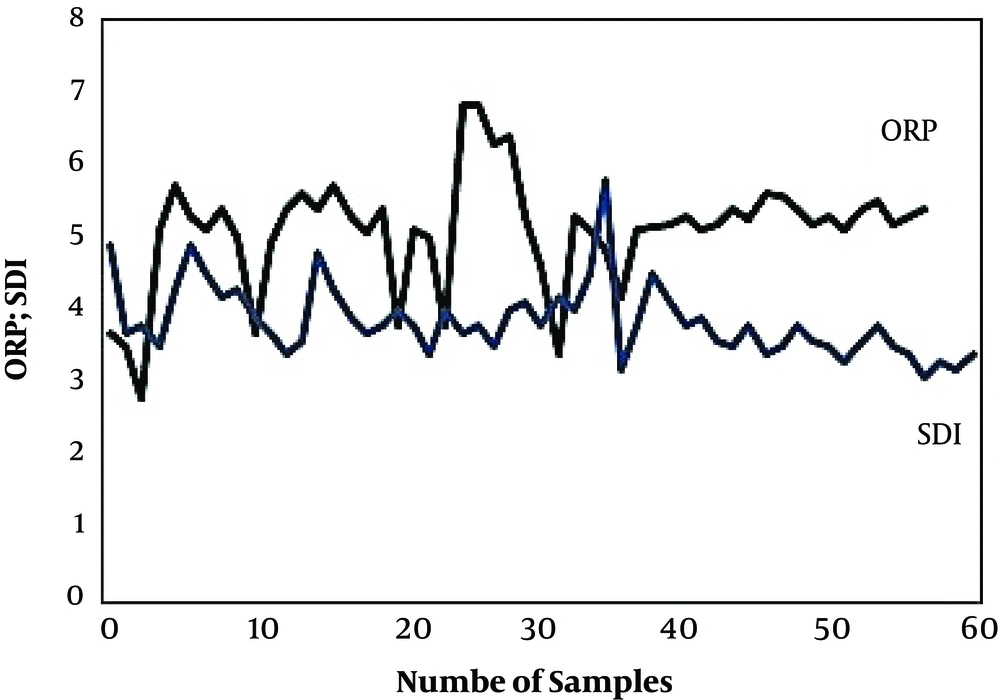
Figure 4 displays the variation of ORP and SDI values. First of all, the operation conditions for the variation trends of the ORP and SDI values were studied. The amounts of ORP were divided by 100 to draw the SDI and ORP data in a graph. The ORP values were increased with increasing SDI, representing the operation conditions of the system. It can be concluded that the operator by observing the ascending order of SDI, increases the amount of ORP through increasing the amount of injected chlorine.
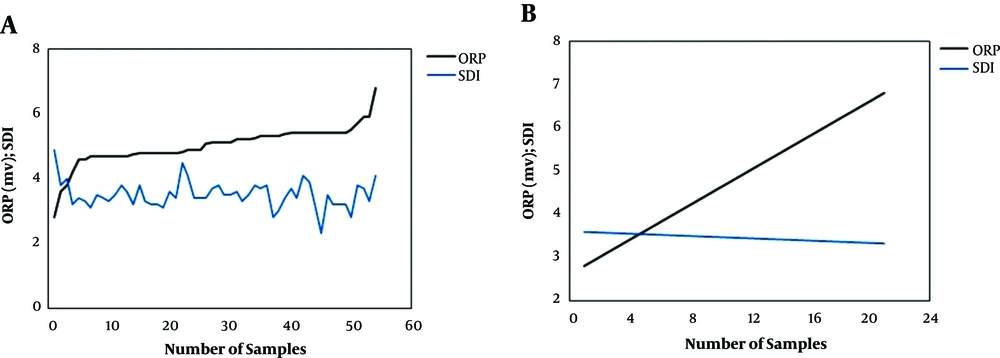
Figure 5 demonstrates the variations of SDI and ORP values at certain intervals. The values of ORP are divided by 100. ORP measurement presents the concentration of chlorine oxidants and its trend related to the degree of oxidation/reduction. Remarkable fluctuation of SDI values accompanied with raise in the ORP values can be observed.
4.3. Pressure Differences in Filter Cartridge
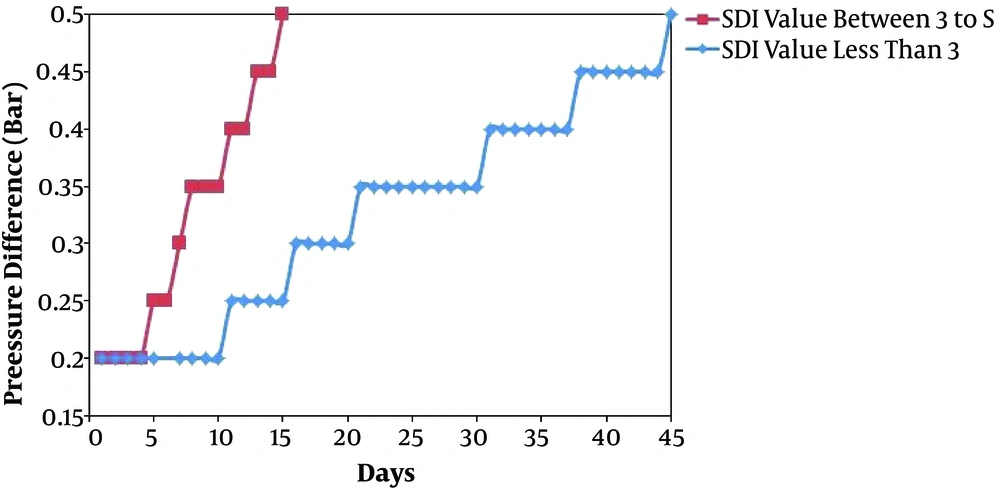
Changes in pressure differences of filter cartridge are given in Table 4 in two conditions. First, pressure difference was measured for cases without particular SDI control via chlorine injection and SDI values of 3 to 5. The results indicate that pressure difference of filter cartridge is about 0.2 bar at the initial stages of operation, while after 15 days of operation, this difference reaches to 0.5 bar. Second, pressure difference was measured for cases with particular SDI control via chlorine injection and SDI values of less than 3. Figure 6 shows the variation of pressure difference for both cases. As can be noted, for particular SDI control via chlorine injection, the increase of pressure difference occurs in a longer time. The results show that pressure difference of filter cartridge is about 0.2 bar at the initial stages of operation, and after 45 days of operation, this difference reaches to 0.5 bar.
| Water Intake | Description | Number | Monthly Consumption Number | Unit Cost, $/kg | Monthly Cost, $ | Cost, $/CUM |
|---|---|---|---|---|---|---|
| Chlorine injection with SDI value between 3-5 | Filter cartridge (1 µm) | 256 | 512 | 2.5 | 1280 | 0.0052 |
| Chlorine injection with SDI value less than 3 | Filter cartridge (1 µm) | 256 | 171 | 2.5 | 427 | 0.0017 |
Changes in Pressure Differences of Filter Cartridge
5. Discussion
5.1. Correlation Between Turbidity and SDI
Based on the results of turbidity and SDI variations obtained (Figure 3) at a constant value of injected chlorine, reduction in turbidity values can be seen while the SDI value altered insignificantly. Concentration and particle size could be the main reasons for this phenomenon because SDI is indicative of the amount of submicron particulates present in water, while turbidity is a measure of water clarity (2). According to the pre-treatment system of the studied sampling site, the turbidity level of water after passing through the pressure sand filters of dual media filtration (DMF) reaches to less than 1 NTU due to the removal of suspended colloidal particles. However, submicron particles of organic and biological matters still remain suspended in raw water, which determine the SDI values. Rachman et al. (23) also showed that particle size and concentration play a key role in SDI quantification. In addition, Mosset et al. (15) made the point that an increase in turbidity may not be directly represented in SDI values, and SDI measurements could be affected by numerous parameters including temperature, pH and membrane wetting despite low turbidity.
5.2. Correlation Between SDI and ORP Values
The results showed that with increasing ORP values as a result of chlorine injection, SDI values decrease significantly. As the chlorine oxidants increase, hypochlorous and hydrochloric acids are produced, which play an integral role in oxidizing microorganisms. The residual effect of free chlorine inhibits the re-growth of microorganisms (2). In particular, Simon et al. (24) revealed that adenosine triphosphate (biomolecule present in all living microorganisms) and total cell count (bacterial abundance) are significantly diminished by using sodium hypochlorite disinfectants. In this regard, reducing the amount of submicron particles in water changes the SDI value. In the linearization, turbidity and chlorine injection are considered as the independent variables, while SDI value is the dependent variable. It is found that at a constant turbidity level at higher injection times, the amount of SDI is less than the amount of chlorine injected with a small amount.
According to the results, the following equations are obtained:

35 < NTU ≤ 55, 280 ≤ ORP ≤ 680, R = 0.982, N = 170

55 < NTU ≤ 80, 315 ≤ ORP ≤ 616, R = 0.990, N = 167

80 < NTU ≤ 150, 420 ≤ ORP ≤ 630, R = 0.993, N = 37
By adjusting the NTU values in specific ranges of 35 - 55, 55 - 80, and 80 - 150 and ORP in the ranges of 280 - 680, 315 - 680, and 420 - 680 mV, the desirable SDI value of inlet water can be obtained. Using the obtained correlations as a result of measuring turbidity and SDI values of inlet raw water, the optimum amount of injectable chlorine (ORP) can be achieved. The obtained relations could be useful to optimize the operation of these units with the same pre-treatment systems and superficial raw water sources.
An in-depth analysis of water intake shows high-quality water product as a result of successful implementation of the pretreatment operation based on the requirements of the World Health Organization (WHO) and ISIRI 1053.
Based on the results of Table 4, in the case of controlling via chlorine injection, due to the decrease of suspended particles and SDI value, the implement load for cartridge filtration greatly reduces resulting in its longer lifetime. Consequently, the operation cost is decreased to 66% and desirable SDI value is obtained.
5.3. Conclusions
The experience of several years of operation at the desalination site showed that chlorine disinfection injections greatly reduces the SDI value of raw water in the RO unit due to removing suspended organic and biological matters as the main sources of contamination. In this regard, chlorine injection showed a distinct effect on reducing the causing factors of high SDI values. Besides, these injections contribute to water turbidity reduction. There is no direct correlation between SDI and turbidity in low turbidity water. Complete removal of water turbidity may not necessarily be associated with low SDI value. Sometimes in these water sources, for water with turbidity less than 1, high SDI values (more than 5) can be measured. SDI control via chlorine injection increased cartridge filters’ lifetime and reduced the operation costs.

