1. Background
Currently, it appears that new molecular-based methods could substitute microscopic and culture assessment for the first-line detection of microorganisms isolated from clinical specimens (1). However, it will remain the “continual strategy" until this technology is attuned to identifying all fungi that can be isolated from biological specimens. In this regard, Aspergillus spp. is considered the leading cause of morbidity and mortality in immunocompromised individuals (2-4). In the clinical laboratory, molecular methods are not regarded as global identification tools since they fail to discriminate filamentous fungi. The most commonly used method to identify is DNA sequencing. However, this technique is time-consuming and involves a high cost since it necessities the sequencing of the whole section of query genes (5).
The results obtained from the improved polymerase chain reaction-restriction fragment length polymorphism (PCR-RFLP) analysis via enzymatic digestion of a specific PCR segment of DNA showed two or more segments in the restriction site. In this region, the lack of the restriction position highlights the occurrence of mutation (6). Moreover, PCR-RFLP is a reasonable and straightforward method, and it is appropriate to discriminate Aspergillus from colony culture (7). However, it is recommended to compare this method with other methods to obtain more realistic results.
The high-resolution melting (HRM) is an approach that can probably screen DNA for mutations. This technique follows the usual PCR program of the point zone in the presence of an intercalating double-stranded DNA-binding dye (8). Consequently, the double-stranded DNA is a portion with rising heat. A melting curve was obtained after separating the double-stranded DNA, followed by a reduction in fluorescence and a release in the intercalating double-stranded DNA-binding dye (9). The melting curves of particular DNA fragments contain unique melting temperature (Tm) points, and 50% of the DNA is double-stranded in these points (10). Moreover, a DNA section has a particular Tm, which requires numerous features, such as guanine/cytosine, content, and length of the fragment (10).
2. Objectives
To date, very few studies have used HRM to identify fungi isolated from clinical specimens (10-13). Most of the isolates belong to the genus Candida; however, little is known about the reliability of HRM in identifying filamentous fungi of clinical interest. The present study aimed to validate the PCR-HRM technique to identify clinical filamentous fungi. Moreover, it was attempted to compare the obtained results with those of the target gene's PCR sequencing.
3. Methods
3.1. Specimens
A total of 54 specimens of bronchoalveolar lavage (BAL), nail, ear discharge, cerebrospinal fluid (CSF), and cornea of patients suspected of fungal infection were collected from the mycology laboratory of the Center for Research and Training in Skin Diseases and Leprosy, Tehran, Iran. All fungal isolates were identified by the morphological features (the distinctive macro/microscopic structures of the colonies), and a stock of all these strains was kept in the tryptic soy broth (TSB) (Merck, Germany) at -70˚C. This study included two standard strains of A. flavus (ATCC9643, PTCC 5004) and A. fumigatus (PTCC 5054), as well as two standard strains of F. solani complex (PTCC 5284) and A. oxysporum (PTCC 5115).
3.2. Molecular Assays
3.2.1. DNA Extraction
All clinical isolates and reference control strains were cultured on SDA and incubated at 35˚C for five days. A fungal colony was scratched from the SDA plate using the bistoury and transferred into the liquid nitrogen. Subsequently, DNA was extracted according to a previously used method (14).
3.2.2. PCR Assay Targeting Tef-α and Beta-Tubulin Regions
The Tef-α and beta-tubulin genes were amplified for each proven sample of Fusarium and Aspergillus spp. (Table 1) (15, 16). The reaction mixture was prepared in 25 µL and included 12.5 µL of master mix (Amplicon, Denmark), 1 µL of each specific primer and DNA (2 µL), and ddH2O up to the final volume. The PCR condition was planned and initially denatured at 95˚C for 15 min, followed by 30 cycles of 30s at 94˚C, 30s at 58˚C, 45s at 72˚C, and a final extension step at 72˚C for 5 min.
| Locus | Primer Sequences (5'-3') |
|---|---|
| Tef-α | |
| Forward | ATGGGTAAGGARGACAAGAC |
| Reverse | GGARGTACCAGTSATCATGTT |
| BT2 | |
| Forward | GGTAACCAAATCGGTGCTGCTTT |
| Reverse | CATCCTTGGAGATACCAGC |
3.2.3. Sequencing
The PCR products were subjected to the sequence using the mentioned primers by Noor Gene Company. The sequences were analyzed using the sequence analysis software (version 3.1). Subsequently, they were edited and aligned with Mega software (version 10).
3.2.4. High-resolution Melting Analysis
High-resolution melting (HRM) was used to screen the 54 specimens known by sequencing the Tef-α and beta-tubulin genes. This liquefaction was run on the Corbet using the HRM Reagent Kit (Amplicon, Denmark). The HRM reactions (20 µL) contained 2X HRM master, 1 µL of each primer, and 2 µL DNA. The HRM cycling setting was set at 95˚C for 10 min continued by 40 sets at 95˚C for 15 s and 58˚C for 1 min. Subsequently, dissolving evaluation was accomplished by heating to 95˚C for 10 s and cooling to 60˚C for 1 min. It was continued with an incremental increase in warmth to 95˚C, a modification of 0.03˚C per second, and an ultimate chilling to 60˚C for 15 s. In the present study, all Fusarium spp. and Aspergillus spp. were recognized based on Tef-α and beta-tubulin regions' sequencing. The Tef-α and beta-tubulin sequences of the tested isolates were aligned using the Clustal W, as implemented in MEGA software (version 7.0.21). The query sequences were matched with those in the GenBank database using the Blast analysis.
4. Results
4.1. Identification of Fusarium spp. and Aspergillus spp. Using PCR Sequencing
The Tef-α sequence analysis revealed that the most frequent species was F. solani (14), followed by F. oxysporum (n = 3), F. caucasicum (n = 3), F. coeruleum (n = 3), F. falciforme (n = 1), F. proliferatum (n = 1), F. brevicatenulatum (n = 1), F. globosom (n = 1), and F. verticillioides (n = 1). A phylogenetic analysis based on Tef-α sequences was performed to position the isolates in the genus Fusarium (Table 2). Based on beta-tubulin sequences, A. flavus (n = 10), A. fumigatus (n = 7), A. niger (n = 2), A. terreus (n = 1), and A. orezea (n = 1) were identified in this study (Table 2). Some sequences were deposited in GenBank (Table 2).
| Species | Source | GenBank Accession Number | Phylogenetic Tree Clade |
|---|---|---|---|
| Fusarium solani | Nail (No., 4); Cornea (No., 16) | MW551548 | FSSC |
| F. falciforme | Cornea (No., 1) | MW551549 | FSSC |
| F. caucasicum | Cornea (No., 3) | MW551550 | FSSC |
| F. oxysporum | Cornea (No., 3) | MW551551 | FOSC |
| F. coeruleum | Cornea (No., 3) | MW551552 | FFSC |
| F. verticillioides | Cornea (No., 1) | MW551553 | FFSC |
| Aspergillus flavus | CSF (No., 1); BAL (No., 1); Cornea (No., 8) | MW551554 | Section Flavi |
| A. orezea | Cornea (No., 1) | MW551555 | Section Flavi |
| A. fumigatus | CSF (No., 1); BAL (No., 3); Cornea (No., 5) | MW551556 | Section Fumigati |
| A. niger | Ear discharge (No., 2) | MW551557 | Section Nigri |
| A. niger | Ear discharge (No., 1) | MW551558 | Section Nigri |
| A. terreus | Cornea (No., 1) | MW551559 | Section Terrei |
4.2. Identification of Fusarium spp. and Aspergillus spp. Using the HRM
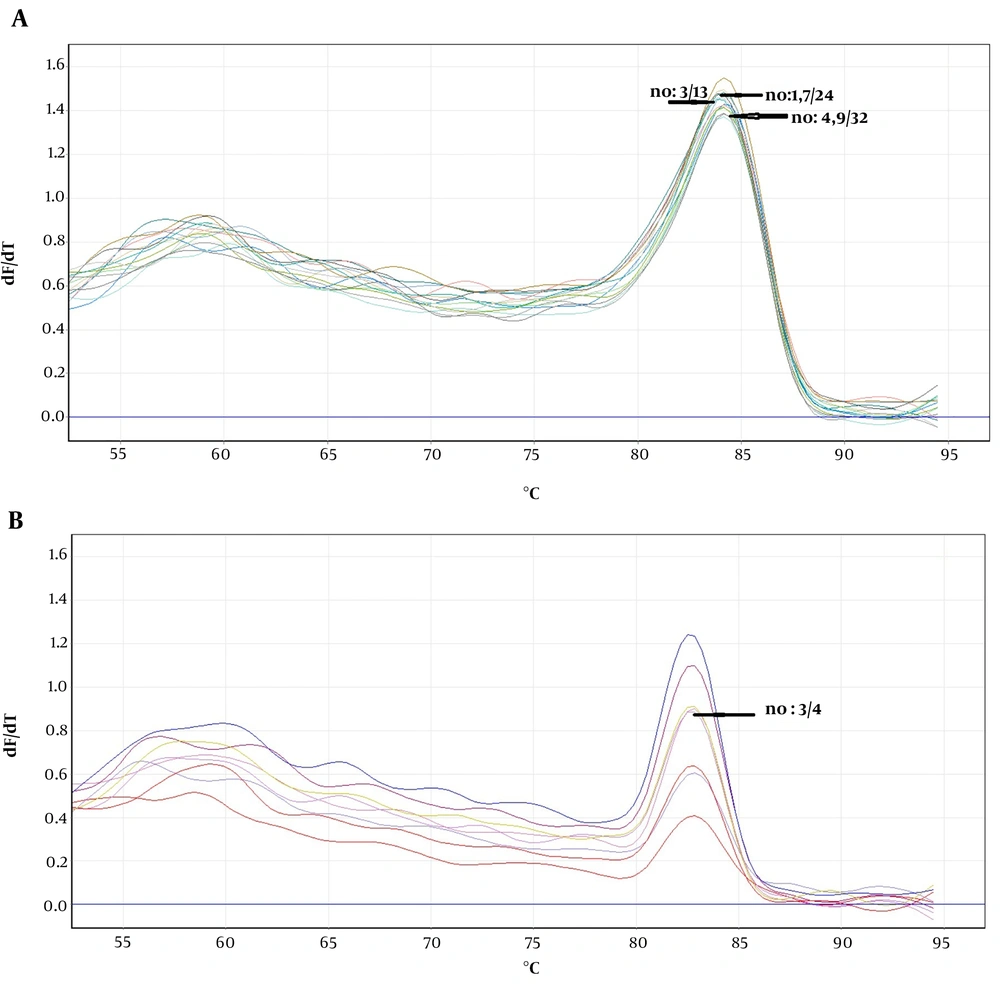
The obtained melting curves using PCR-HRM are shown in Figure 1. The close curve changes are not exhibited for isolated 3, 4, 9 - 12 Fusarium, and 4 Aspergillus spp. Accordingly, there were overlaps between curves 3 and 13 (F. globosom/proliferatum), the curves 4, 9, and 32, and the curves 1, 7, and 24 (F. solani/caucasicum). Furthermore, an overlap was observed between curves 10 and 12 and the curves 1, 7, and 24 (F. solani/coeruleum). Regarding Aspergillus spp., there was an overlap between the curves 3 and 4 (A. flavus/orezea).
5. Discussion
Based on the phylogenetic analysis of the sequencing results, the Fusarium spp. were classified in FFSC, FSSC, and FOSC clades. Furthermore, F. caucasicum was included in FSSC, and F. coeruleum belonged to a well-characterized phylogenetic clade closer to FFSC (Table 1). Based on the results, F. brevicatenulatum was not classified in these mentioned clades. A phylogenetic tree belonging to the beta-tubulin fragment was created for all Aspergillus isolates. The dendrogram defined associations among all the tested isolates and the isolates belonging to each species were assembled with high support (more than 90%) in separate clades. It should be noted that A. orezea was classified into section Flavi (Table 1).
Using molecular approaches yielded 100% accuracy in identifying the usual Aspergillus and Fusarium spp. in the present study. Moreover, the results of identifying Aspergillus and Fusarium spp. using HRM were confirmed by the sequence of the conserved region. The dataset analysis of PCR-HRM revealed that 33 isolates belonged to Fusarium spp., including F. solani (n = 24), F. oxysporum (n = 3), F. proliferatum (n = 3), F. falciforme (n = 1), F. verticillioides (n = 1), and F. brevicatenulatum (n = 1). Additionally, isolates (n = 21) belonging to Aspergillus spp. were A. flavus (n = 11), A. fumigatus (n = 7), A. niger (n = 2), and A. terreus (n = 1).
A previously conducted study discriminated seven F. oxysporum formaespeciales using ITS based on HRM analysis. The results revealed that the real-time PCR-HRM technique was an economical, accurate, and rapid close-tubed test for distinguishing F. oxysporum formaespeciales complexes (17). When melting curves overlap among some species, it can be stated that the pun fungal primer in the PCR-HRM method fails to differentiate the majority of the closely related species.
5.1. Conclusions
Due to the time-consuming and costly nature of sequencing methods and the observed consistency between the results obtained from the sequence of the Tef-α/beta-tubulin regions and PCR-HRM, the PCR-HRM method is regarded as a reliable approach in the clinical laboratory to identify the most common Aspergillus and Fusarium spp. However, it is noteworthy that some closely related species have no curve algorithm differences in PCR-HRM and should be designed using a new pan fungal primer to outperform the existing ones.

