


1. Background
Bacterial resistance to antibiotics is becoming a global threat to human health. An alarming increase in antimicrobial resistance (AMR) among both Gram-positive and Gram-negative pathogens has been observed in China (1) and Europe (2) in recent decades. In recent years, however, the prevalence of many resistant Gram-positive bacteria (GPB) has remained relatively stable or declined. Besides, the prevalence of methicillin-resistant Staphylococcus aureus (MRSA) has begun to decrease in some countries in recent years (2). Gram-negative bacteria (GNB) are more concerning than GPB, as the levels of AMR in many important pathogens, including Escherichia coli, Pseudomonas aeruginosa, Acinetobacter baumannii, and Klebsiella pneumoniae, have increased in China (3) and other areas of the world (4). It has been reported that epidemiological surveillance of antimicrobial agents’ resistance levels can provide useful information for clinical prevention efforts, effective antibiotic therapy administration, and optimized antibiotic use, which has become one of the most important components of AMR control.
Although the AMR levels are published by China antimicrobial surveillance network (CHINET) researchers every year, the AMR levels are obtained from a small amount of hospital data in large cities of China and do not fully represent the AMR levels in all regions of China (34 provinces or cities). According to the CHINET (5), the resistance rates of E. coli isolates to cefepime and imipenem in 2011 to 2014 were 40.7 to 28.1% and 1.0 to 0.9%, respectively. However, the resistance rates of E. coli isolates to cefepime and imipenem in Zhengzhou city, China, from 2011 to 2014 were 49.7 to 38.4% and 0.9 to 1.3%, respectively (6). There were significant differences in the distributions of resistance levels in different geographical locations. According to another national surveillance program (7), except for carbapenem-resistant (CR) E. coli (CREC), which did not differ greatly by region, the prevalence of carbapenem-resistant K. pneumoniae (CRKP) and extensively drug-resistant P. aeruginosa (XDRPA) and A. baumannii (XDRAB) strains varied significantly across regions.
2. Objectives
We evaluated the antimicrobial susceptibility patterns of GPB and GNB isolated from hospitalized patients (ICUs and the whole hospital) in a regional tertiary teaching hospital in southwestern China.
3. Methods
3.1. Study Design and Setting
In this surveillance study, we recorded and analyzed data from bacterial cultures and antimicrobial susceptibility tests performed on both GPB and GNB causing nosocomial infections in all wards at the Affiliated Hospital of Southwest Medical University from January 2013 to December 2018. The study setting is a 3200-bed tertiary teaching hospital and the largest hospital in southern Sichuan province, China. The hospital offers health care services to more than 1.8 million outpatients and 130,000 inpatients per year for patients living in the four provinces and cities (Sichuan province, Yunnan province, Guizhou province, and Chongqing city, approximately 40 million persons). Data were collected from all wards [including 39 general wards and three ICUs (general intensive care unit, neonatal ICU, and coronary CU)]. The study protocol was approved by the ethics committee of the hospital.
3.2. Isolate Collection
The isolates were collected in our hospital from January 1, 2013, to December 31, 2018. The isolates were cultured from all sample sources (e.g., bloodstream, respiratory tract, urinary tract, secretions, cerebrospinal fluid, other sterile body fluids, feces, genital tract, and others). The identification of these bacteria was performed with a MicroScan WalkAway 96 Plus System (Siemens, Germany) and a Microflex LT (Bruker Diagnostics Inc., USA) matrix-assisted laser desorption/ionization time-of-flight mass spectroscopy (MALDI-TOF MS) system.
3.3. Susceptibility Testing
Antimicrobial susceptibility tests were performed by using modified broth microdilution tests with the MicroScan System (Siemens, Germany). The tests were performed according to the manufacturer’s recommendations, and the results were interpreted according to the Clinical Laboratory and Standards Institute (CLSI) breakpoints for the respective years (CLSI document M100-S23-28, Wayne, PA: CLSI, 2013-2018) (8-13). The US Food and Drug Administration (FDA) breakpoints were used for tigecycline. The MRSA and extended-spectrum β-lactamase (ESBL) isolates were identified by a MicroScan WalkAway 96 Plus System according to the manufacturer’s instructions. Methicillin-resistant S. aureus and ESBL-producing E. coli and K. pneumoniae were determined according to the CLSI guidelines. The control bacterial strains were S. aureus ATCC 25923, E. coli ATCC 25922, K. pneumoniae ATCC 700603, P. aeruginosa ATCC 27853, and A. baumannii ATCC 19606.
3.4. Statistical Analysis
The chi-square or Fisher’s exact tests were used to compare categorical data, and Student’s t-tests or the Mann-Whitney U test to compare continuous data. The trend was analyzed by linear regression analysis. All of the data were analyzed using SPSS 24.0 (IBM Corporation, Armonk, NY). Probability values of P < 0.05 were considered statistically significant.
4. Results
4.1. Distribution and Culture-Positive Rate of Specimens
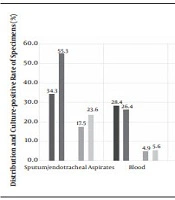
From 2013 to 2018, a total of 275,944 and 11,335 non-repetitive specimens were collected from all wards and ICUs in our hospital, respectively. The total culture-positive rates of the specimens in the whole hospital and ICUs were 14.8% and 18.0%, respectively. The distribution and culture-positive rates of these specimens in all wards were as follows: Sputum/endotracheal aspirates (34.3 and 17.5%), blood (28.4 and 4.9%), secretions (12.6 and 35.4%), urine (12.4 and 18.1%), sterile body fluid (8.6 and 7.7%), and other specimens (3.8 and 2.2%). The distribution and culture-positive rates of these specimens in the ICUs were as follows: Sputum/endotracheal aspirates (55.3 and 23.6%), blood (26.4 and 5.6%), sterile body fluid (6.8 and 18.3%), urine (5.5 and 12.1%), secretions (4.3 and 35.9%), and other specimens (1.6 and 1.6%). The detailed data are shown in Figure 1.

Annual percentage of distribution and culture-positive rate of specimens in ICUs and the whole hospital; Others include ducts, tissues, bile, prostatic fluid, drainage fluid, feces, etc.
4.2. Detection Rate of Bacteria
From 2013 to 2018, the total detection rates were 20.5% (56535/275944) in the whole hospital and 31.0% (3518/11335) in the ICU wards (P < 0.001), which included 14,872 isolates of GPB (26.3%) and 41,663 isolates of GNB (73.7%) in the whole hospital and 646 isolates of GPB (18.4%) and 2,872 isolates of GNB (81.6%) in the ICUs. The five dominant bacteria were E. coli (20.3%), K. pneumoniae (12.2%), S. aureus (11.4%), P. aeruginosa (8.1%), and A. baumannii (6.0%) in the whole hospital, and A. baumannii (17.6%), P. aeruginosa (11.4%), K. pneumoniae (9.6%), E. coli (8.2%) and S. aureus (5.3%) in the ICUs. The five dominant species accounted for 54.8 to 60.1% of all isolates in the whole hospital and 48.1 to 57.7% of all isolates in the ICUs. The detailed data are shown in Table 1. The non-dominant bacterial populations are shown in Appendix.
| Bacterial Species/Wards | Total | 2013 | 2014 | 2015 | 2016 | 2017 | 2018 | 2018 - 2013, % Change | P-Value b | P-Value c |
|---|---|---|---|---|---|---|---|---|---|---|
| All isolates | < 0.001 | |||||||||
| Whole hospital | 56535 (20.5) | 7429 (21.6) | 8754 (19.3) | 9389 (20.9) | 10309 (20.7) | 10752 (20.0) | 10082 (18.0) | -3.6 | 0.147 | |
| ICU | 3518 (31.0) | 412 (40.8) | 344 (30.1) | 398 (30.2) | 673 (27.0) | 920 (28.2) | 771 (33.7) | -7.1 | 0.344 | |
| Escherichia coli | < 0.001 | |||||||||
| Whole hospital | 11486 (20.3) | 1602 (21.6) | 1927 (22.0) | 1868 (19.9) | 2025 (19.6) | 1972 (18.3) | 2092 (20.7) | -0.9 | 0.189 | |
| ICU | 289 (8.2) | 32 (7.8) | 40 (11.6) | 30 (7.5) | 50 (7.4) | 49 (5.3) | 88 (11.4) | 3.6 | 0.968 | |
| Klebsiellapneumoniae | 0.066 | |||||||||
| Whole hospital | 6897 (12.2) | 1097 (14.8) | 1109 (12.7) | 1177 (12.5) | 1292 (12.5) | 1148 (10.7) | 1074 (10.7) | -4.1 | 0.007 | |
| ICU | 337 (9.6) | 45 (10.9) | 38 (11.0) | 53 (13.3) | 64 (9.5) | 82 (8.9) | 55 (7.1) | -3.8 | 0.097 | |
| Staphylococcus aureus | < 0.001 | |||||||||
| Whole hospital | 6452 (11.4) | 788 (10.6) | 1007 (11.5) | 1012 (10.8) | 1310 (12.7) | 1111 (10.3) | 1224 (12.1) | 0.7 | 0.521 | |
| ICU | 187 (5.3) | 27 (6.6) | 16 (4.7) | 12 (3.0) | 48 (7.1) | 53 (5.8) | 31 (4.0) | -2.6 | 0.719 | |
| Pseudomonas aeruginosa | 0.130 | |||||||||
| Whole hospital | 4573 (8.1) | 519 (7.0) | 568 (6.5) | 695 (7.4) | 744 (7.2) | 934 (8.7) | 1113 (11.0) | 4.0 | 0.031 | |
| ICU | 401 (11.4) | 33 (8.0) | 40 (11.6) | 21 (5.3) | 70 (10.4) | 122 (13.3) | 115 (14.9) | 6.9 | 0.137 | |
| Acinetobacterbaumannii | < 0.001 | |||||||||
| Whole hospital | 3410 (6.0) | 367 (4.9) | 477 (5.4) | 587 (6.3) | 697 (6.8) | 730 (6.8) | 552 (5.5) | 0.6 | 0.294 | |
| ICU | 620 (17.6) | 88 (23.4) | 45 (13.1) | 86 (21.6) | 156 (23.2) | 163 (17.7) | 82 (10.6) | -12.8 | 0.337 | |
| Total percentage of five targeted species | 0.005 | |||||||||
| Whole hospital | 32818 (58.0) | 4373 (58.9) | 5088 (58.1) | 5339 (56.9) | 6068 (58.9) | 5895 (54.8) | 6055 (60.1) | -1.2 | 0.919 | |
| ICU | 1834 (52.1) | 257 (54.6) | 179 (52.0) | 202 (50.8) | 388 (57.7) | 469 (51.0) | 371 (48.1) | -6.5 | 0.363 |
Percentage of Five Targeted Species Among Total Number of Reported Isolates a
4.3. Patterns of Antimicrobial Resistance
In the whole hospital, the pooled resistance levels of ESBL-E. coli, CR-A. baumannii (CRAB), and XDRAB isolates were highest (54.1, 65.5, and 12.9%, respectively), and XDRAB showed a marked linear increase from 2.5 to 25.9% (P < 0.05). Besides, CR-P. aeruginosa (CRPA) showed a marked increase from 8.7 to 22.4%. However, ESBL-E. coli showed a linearly decreasing trend (P < 0.05), and MRSA showed a linear decrease from 29.8 to 21.3% (P < 0.05). The rates of XDR isolates of E. coli (XDREC) and K. pneumoniae (XDRKP) were low (less than 1.0%) but showed a linear increase (P < 0.05). In the ICUs, the detection rates of CRAB and XDRAB were more than 80% and 20%, respectively. Also, ESBL-E. coli and -K. pneumoniae and XDRAB showed marked increases from 56.3 to 70.0%, 17.8 to 25.5%, and 2.3 to 23.2%, respectively (P < 0.05). The detection rate of MRSA showed a marked decrease from 40.7 to 12.9% (P < 0.05). No XDR strains were found for E. coli, K. pneumoniae, and S. aureus. The detection rates of ESBL- and XDR-E. coli, CRAB, and XDR-S. aureus showed significant differences between the ICUs and the whole hospital (P < 0.05). The detailed data are shown in Table 2.
| Bacterial Species/Resistance Level/Wards | Pooled | 2013 | 2015 | 2016 | 2017 | 2018 | 2018 - 2013, % Change | P-Value a | P-Value b |
|---|---|---|---|---|---|---|---|---|---|
| E. coli | |||||||||
| ESBLs | 0.001 | ||||||||
| Whole hospital | 54.1 | 57.1 | 57.1 | 53.8 | 51.2 | 50.9 | -6.2 | 0.012 | |
| ICU | 67.4 | 56.3 | 66.7 | 70.0 | 63.3 | 70.0 | 13.7 | 0.433 | |
| CR | 0.948 | ||||||||
| Whole hospital | 1.1 | 2.2 | 0.4 | 1.4 | 0.6 | 1.4 | -0.8 | 0.54 | |
| ICU | 1.3 | 0.0 | 3.3 | 0.0 | 0.0 | 3.3 | 3.3 | 0.414 | |
| XDR | 0.014 | ||||||||
| Whole hospital | 0.1 | 0.00 | 0.05 | 0.10 | 0.20 | 0.19 | 0.19 | 0.003 | |
| ICU | 0.0 | 0 | 0 | 0 | 0 | 0 | 0 | - | |
| K. pneumoniae | |||||||||
| ESBLs | 0.369 | ||||||||
| Whole hospital | 26.1 | 24.8 | 25.5 | 24.6 | 25.9 | 29.7 | 4.9 | 0.204 | |
| ICU | 24.9 | 17.8 | 28.3 | 28.1 | 28.0 | 25.5 | 7.7 | 0.114 | |
| CR | 0.552 | ||||||||
| Whole hospital | 1.9 | 2.0 | 1.0 | 1.7 | 1.0 | 5.0 | 3 | 0.263 | |
| ICU | 2.7 | 6.7 | 1.9 | 6.3 | 0.0 | 1.8 | -4.9 | 0.486 | |
| XDR | 0.092 | ||||||||
| Whole hospital | 0.1 | 0.0 | 0.0 | 0.2 | 0.2 | 0.5 | 0.47 | 0.022 | |
| ICU | 0.0 | 0 | 0 | 0 | 0 | 0 | 0 | - | |
| P. aeruginosa | |||||||||
| CR | 0.95 | ||||||||
| Whole hospital | 17.4 | 8.7 | 12.1 | 15.7 | 26.0 | 22.4 | 13.7 | 0.01 | |
| ICU | 25.5 | 15.2 | 19.1 | 24.4 | 40.2 | 20.0 | 4.8 | 0.191 | |
| XDR | 0.444 | ||||||||
| Whole hospital | 1.8 | 1.7 | 2.7 | 1.6 | 1.3 | 1.3 | -0.4 | 0.217 | |
| ICU | 2.0 | 0.0 | 0.0 | 2.9 | 2.5 | 2.6 | 2.6 | 0.031 | |
| A. baumannii | |||||||||
| CR | < 0.001 | ||||||||
| Whole hospital | 65.5 | 69.5 | 70.7 | 61.5 | 61.1 | 73.7 | 4.2 | 0.774 | |
| ICU | 87.1 | 87.5 | 89.5 | 83.3 | 87.7 | 86.6 | -0.9 | 0.377 | |
| XDR | 0.182 | ||||||||
| Whole hospital | 12.9 | 2.5 | 9.0 | 12.3 | 13.8 | 25.9 | 23.4 | 0.013 | |
| ICU | 21.8 | 2.3 | 16.0 | 33.0 | 24.5 | 23.2 | 20.9 | 0.12 | |
| S. aureus | |||||||||
| MRSA | 0.098 | ||||||||
| Whole hospital | 26.5 | 29.8 | 29.2 | 24.9 | 26.2 | 21.3 | -8.5 | 0.013 | |
| ICU | 36.9 | 40.7 | 41.7 | 50.0 | 30.2 | 12.9 | -27.8 | 0.103 | |
| XDR | < 0.001 | ||||||||
| Whole hospital | 0.5 | 0.5 | 0.7 | 0.3 | 0.3 | 0.4 | -0.1 | 0.197 | |
| ICU | 0.0 | 0 | 0 | 0 | 0 | 0 | 0 | - |
Annual Proportions of MRSA, ESBLs- Escherichia coli, and Klebsiella pneumoniae, CR Gram-Negative Bacilli, and XDR Gram-Positive and Gram-Negative Bacteria Causing Intensive Care Unit and Hospital-wide Infections
4.4. Trends in Antimicrobial Resistance
4.4.1. Escherichia coli
The resistance rate of cephem antibiotics was over 50% in the ICUs and the whole hospital. The resistance rates of penicillin in the ICUs and the whole hospital were more than 90 and 80%, respectively. Amikacin, piperacillin/tazobactam, cefoperazone/sulbactam, imipenem, meropenem, ertapenem, and tigecycline were still highly active against E. coli in the ICUs and the whole hospital (resistance rate < 5%). All the E. coli strains (100%) were susceptible to imipenem, meropenem, and tigecycline in the ICUs. The resistance levels of penicillin and cephems, imipenem, meropenem, tetracycline, and tigecycline were different between the ICUs and the whole hospital (P < 0.05). E. coli was first found to be resistant to tigecycline in 2017 in our hospital. The detailed data are shown in Table 3.
| Antimicrobial Agent/Wards | Pooled | 2013 | 2014 | 2015 | 2016 | 2017 | 2018 | 2018 - 2013, % Change | P-Value a | P-Value b |
|---|---|---|---|---|---|---|---|---|---|---|
| AMP | < 0.001 | |||||||||
| Whole hospital | 84.0 | 85.8 | 84.5 | 83.5 | 83.5 | 83.6 | 83.5 | -2.3 | 0.050 | |
| ICU | 91.0 | 87.5 | 92.5 | 90.0 | 90.0 | 89.8 | 93.3 | 5.8 | 0.274 | |
| AMK | 0.988 | |||||||||
| Whole hospital | 2.8 | 2.8 | 3.3 | 2.2 | 1.9 | 2.9 | 3.5 | 0.7 | 0.743 | |
| ICU | 3.4 | 3.2 | 2.5 | 0.0 | 0.0 | 4.1 | 6.7 | 3.5 | 0.352 | |
| GEN | 0.484 | |||||||||
| Whole hospital | 42.2 | 44.2 | 45.7 | 42.6 | 41.7 | 40.8 | 39.1 | -5.1 | 0.008 | |
| ICU | 45.7 | 46.9 | 40.0 | 46.7 | 48.0 | 32.7 | 53.3 | 6.4 | 0.381 | |
| PIP | 0.023 | |||||||||
| Whole hospital | 81.4 | 82.2 | 80.7 | 80.0 | 80.3 | 79.2 | 85.9 | 3.7 | 0.543 | |
| ICU | 91.7 | 81.3 | 90.0 | 83.3 | 88.0 | 100.0 | 96.7 | 15.4 | 0.049 | |
| TZP | 0.944 | |||||||||
| Whole hospital | 2.9 | 3.9 | 2.2 | 3.5 | 3.1 | 2.3 | 2.5 | -1.4 | 0.262 | |
| ICU | 2.7 | 3.3 | 4.0 | 3.7 | 2.0 | 2.0 | 2.3 | -1 | 0.079 | |
| CRO | 0.001 | |||||||||
| Whole hospital | 55.7 | 58.9 | 56.7 | 57.9 | 54.2 | 52.9 | 54.6 | -4.3 | 0.037 | |
| ICU | 67.4 | 59.4 | 75.0 | 66.7 | 70.0 | 65.3 | 66.7 | 7.3 | 0.835 | |
| CFZ | 0.007 | |||||||||
| Whole hospital | 63.1 | 67.6 | 64.4 | 66.1 | 61.4 | 58.5 | 61.8 | -5.8 | 0.047 | |
| ICU | 72.2 | 65.6 | 82.5 | 73.3 | 74.0 | 69.4 | 70.0 | 4.4 | 0.771 | |
| CXM | 0.008 | |||||||||
| Whole hospital | 58.8 | 63.5 | 60.5 | 61.8 | 57.5 | 55.4 | 55.3 | -8.2 | 0.005 | |
| ICU | 68.4 | 59.4 | 77.5 | 66.7 | 70.0 | 69.4 | 66.7 | 7.3 | 0.790 | |
| CTX | 0.003 | |||||||||
| Whole hospital | 55.0 | 58.4 | 56.5 | 57.8 | 54.2 | 52.1 | 52.0 | -6.4 | 0.008 | |
| ICU | 66.7 | 56.3 | 75.0 | 66.7 | 70.0 | 63.3 | 66.7 | 10.4 | 0.746 | |
| CAZ | 0.027 | |||||||||
| Whole hospital | 54.9 | 58.4 | 56.3 | 58.0 | 54.0 | 51.6 | 51.9 | -6.5 | 0.012 | |
| ICU | 62.3 | 56.3 | 72.5 | 66.7 | 70.0 | 63.3 | 53.3 | -3 | 0.596 | |
| FEP | 0.004 | |||||||||
| Whole hospital | 54.9 | 58.4 | 56.6 | 57.5 | 54.2 | 51.7 | 52.0 | -6.4 | 0.006 | |
| ICU | 65.7 | 56.3 | 75.0 | 66.7 | 70.0 | 63.3 | 63.3 | 7 | 0.960 | |
| SCF | 0.603 | |||||||||
| Whole hospital | 3.5 | 3.4 | 2.9 | 4.2 | 4.2 | 5.1 | 1.5 | -1.9 | 0.816 | |
| ICU | 3.5 | 4.3 | 3.9 | 4.8 | 5.3 | 6.3 | 0.0 | -4.3 | 0.511 | |
| FOX | 0.924 | |||||||||
| Whole hospital | 12.9 | 15.1 | 12.4 | 14.3 | 12.7 | 11.5 | 11.9 | -3.2 | 0.075 | |
| ICU | 12.0 | 9.4 | 7.5 | 23.3 | 12.0 | 14.3 | 10.0 | 0.6 | 0.830 | |
| IMP | 0.039 | |||||||||
| Whole hospital | 0.4 | 0.0 | 0.2 | 0.1 | 0.3 | 0.5 | 1.0 | 1 | 0.014 | |
| ICU | 0.0 | 0.0 | 0.0 | 0.0 | 0.0 | 0.0 | 0.0 | 0 | - | |
| MEM | 0.014 | |||||||||
| Whole hospital | 0.3 | 0.1 | 0.2 | 0.1 | 0.5 | 0.3 | 0.8 | 0.7 | 0.045 | |
| ICU | 0.0 | 0.0 | 0.0 | 0.0 | 0.0 | 0.0 | 0.0 | 0 | - | |
| ETP | 0.914 | |||||||||
| Whole hospital | 1.2 | 2.2 | 1.0 | 0.4 | 1.2 | 0.6 | 1.7 | -0.5 | 0.662 | |
| ICU | 1.3 | 0.0 | 0.0 | 3.3 | 0.0 | 0.0 | 3.3 | 3.3 | 0.414 | |
| LEV | 0.433 | |||||||||
| Whole hospital | 45.8 | 47.7 | 45.4 | 43.6 | 47.5 | 43.3 | 47.6 | -0.1 | 0.887 | |
| ICU | 48.1 | 46.9 | 35.0 | 56.7 | 56.0 | 55.1 | 43.3 | -3.6 | 0.625 | |
| CIP | 0.515 | |||||||||
| Whole hospital | 49.9 | 51.2 | 49.6 | 49.0 | 51.5 | 47.2 | 51.0 | -0.2 | 0.727 | |
| ICU | 51.6 | 56.3 | 37.5 | 56.7 | 62.0 | 55.1 | 46.7 | -9.6 | 0.908 | |
| SXT | 0.136 | |||||||||
| Whole hospital | 56.5 | 58.1 | 59.8 | 57.8 | 55.1 | 55.7 | 53.4 | -4.7 | 0.020 | |
| ICU | 62.5 | 65.6 | 67.5 | 60.0 | 66.0 | 46.9 | 66.7 | 1.1 | 0.510 | |
| TET | 0.048 | |||||||||
| Whole hospital | 65.4 | 66.8 | 67.0 | 65.0 | 65.8 | 66.9 | 61.5 | -5.3 | 0.155 | |
| ICU | 76.6 | 71.9 | 82.5 | 76.7 | 74.0 | 57.9 | 87.5 | 15.6 | 0.988 | |
| TGC | - | |||||||||
| Whole hospital | 0.05 | 0.0 | 0.0 | 0.1 | 0.1 | 0.1 | 0.067 | |||
| ICU | 0.0 | 0.0 | 0.0 | 0.0 | 0.0 | 0 | - |
Resistance Rates (%) of Escherichia coli to Antimicrobial Agents in the Whole Hospital and Intensive Care Units
4.4.2. Klebsiella pneumoniae
There were marked increases in resistance to cefoperazone/sulbactam, imipenem, and meropenem, from 0.0 to 7.4%, 0.1 to 4.0%, and 0.5 to 3.5%, respectively, in the whole hospital and to piperacillin, cefoperazone/sulbactam, tetracycline, and tigecycline, from 35.6 to 98.2%, 0.0 to 9.1%, 20.0 to 29.1%, and 0.0 to 5.5%, respectively, in the ICUs. However, resistance to amikacin, cefuroxime, cefoxitin, and ertapenem decreased from 6.7 to 0.0%, 40.0 to 30.9%, 24.4 to 10.9%, and 6.7 to 1.8%, respectively. Imipenem and meropenem resistance rates essentially fluctuated by approximately 1.6 and 2.2%, respectively. The antimicrobial agent resistance levels did not significantly differ between the ICUs and the whole hospital (P > 0.05). Klebsiella pneumoniae was first found to be resistant to tigecycline in 2017, and the resistance is gradually increasing. The detailed data are shown in Table 4.
| Antimicrobial Agent/Wards | Pooled | 2013 | 2014 | 2015 | 2016 | 2017 | 2018 | 2018 - 2013, % Change | P-Value a | P-Value b |
|---|---|---|---|---|---|---|---|---|---|---|
| AMK | 0.654 | |||||||||
| Whole hospital | 2.9 | 2.6 | 2.4 | 2.2 | 2.3 | 2.2 | 6.2 | 3.6 | 0.218 | |
| ICU | 2.4 | 6.7 | 0.0 | 3.8 | 1.6 | 2.4 | 0.0 | -6.7 | 0.213 | |
| GEN | 0.627 | |||||||||
| Whole hospital | 17.7 | 17.1 | 17.9 | 16.1 | 17.2 | 18.4 | 19.5 | 2.4 | 0.156 | |
| ICU | 17.5 | 13.3 | 7.9 | 18.9 | 23.4 | 19.5 | 16.4 | 3.1 | 0.269 | |
| PIP | 0.525 | |||||||||
| Whole hospital | 52.2 | 52.9 | 47.9 | 52.0 | 55.7 | 59.8 | 43.7 | -9.2 | 0.902 | |
| ICU | 62.3 | 35.6 | 28.9 | 58.5 | 59.4 | 73.2 | 98.2 | 62.6 | 0.004 | |
| TZP | 0.292 | |||||||||
| Whole hospital | 6.2 | 7.1 | 8.6 | 4.7 | 5.5 | 4.4 | 7.4 | 0.3 | 0.509 | |
| ICU | 4.7 | 6.7 | 2.6 | 7.5 | 7.8 | 2.4 | 1.8 | -4.9 | 0.349 | |
| CRO | 0.265 | |||||||||
| Whole hospital | 27.8 | 26.9 | 29.2 | 26.3 | 25.3 | 28.7 | 31.1 | 4.2 | 0.352 | |
| ICU | 26.1 | 22.2 | 15.8 | 28.3 | 29.7 | 29.3 | 25.5 | 3.3 | 0.229 | |
| CFZ | 0.389 | |||||||||
| Whole hospital | 35.0 | 37.9 | 36.7 | 34.1 | 32.5 | 34.0 | 35.4 | -2.5 | 0.202 | |
| ICU | 33.5 | 35.6 | 18.4 | 34.0 | 35.9 | 37.8 | 32.7 | -2.9 | 0.502 | |
| CXM | 0.579 | |||||||||
| Whole hospital | 33.1 | 35.2 | 34.7 | 32.2 | 30.7 | 31.8 | 34.5 | -0.7 | 0.449 | |
| ICU | 34.4 | 40.0 | 28.9 | 34.0 | 37.5 | 34.1 | 30.9 | -9.1 | 0.506 | |
| CTX | 0.281 | |||||||||
| Whole hospital | 27.4 | 26.9 | 29.0 | 26.3 | 25.2 | 27.4 | 30.0 | 3.1 | 0.59 | |
| ICU | 25.8 | 22.2 | 15.8 | 28.3 | 29.7 | 28.0 | 25.5 | 3.3 | 0.248 | |
| CAZ | 0.305 | |||||||||
| Whole hospital | 27.5 | 26.9 | 29.2 | 26.6 | 25.9 | 27.1 | 30.0 | 3.1 | 0.597 | |
| ICU | 26.1 | 24.4 | 15.8 | 28.3 | 29.7 | 28.0 | 25.5 | 1.1 | 0.358 | |
| FEP | 0.386 | |||||||||
| Whole hospital | 27.2 | 26.7 | 28.8 | 26.2 | 25.3 | 27.1 | 29.8 | 3.1 | 0.561 | |
| ICU | 26.1 | 22.2 | 15.8 | 28.3 | 31.3 | 28.0 | 25.5 | 3.3 | 0.266 | |
| SCF | 0.942 | |||||||||
| Whole hospital | 4.6 | 0.0 | 1.2 | 3.8 | 3.3 | 11.8 | 7.4 | 7.4 | 0.035 | |
| ICU | 5.7 | 0.0 | 0.8 | 1.9 | 4.7 | 12.2 | 9.1 | 9.1 | 0.015 | |
| FOX | 0.8 | |||||||||
| Whole hospital | 16.1 | 18.9 | 18.2 | 14.8 | 13.5 | 14.6 | 17.1 | -1.8 | 0.3 | |
| ICU | 16.3 | 24.4 | 15.8 | 17.0 | 20.3 | 12.2 | 10.9 | -13.5 | 0.059 | |
| IMP | 0.3 | |||||||||
| Whole hospital | 1.0 | 0.1 | 0.1 | 0.3 | 0.5 | 1.0 | 4.0 | 3.9 | 0.055 | |
| ICU | 0.3 | 0.0 | 0.0 | 0.0 | 1.6 | 0.0 | 0.0 | 0.0 | 0.805 | |
| MEM | 0.822 | |||||||||
| Whole hospital | 1.0 | 0.5 | 0.6 | 0.4 | 0.7 | 0.9 | 3.5 | 3.0 | 0.104 | |
| ICU | 0.9 | 2.2 | 0.0 | 1.9 | 1.6 | 0.0 | 0.0 | -2.2 | 0.232 | |
| ETP | 0.564 | |||||||||
| Whole hospital | 1.9 | 1.9 | 0.9 | 1.1 | 1.9 | 1.5 | 4.6 | 2.7 | 0.176 | |
| ICU | 2.7 | 6.7 | 0.0 | 1.9 | 6.3 | 0.0 | 1.8 | -4.9 | 0.485 | |
| LEV | 0.635 | |||||||||
| Whole hospital | 11.8 | 11.2 | 10.5 | 12.1 | 11.4 | 11.8 | 14.1 | 2.9 | 0.079 | |
| ICU | 11.9 | 2.2 | 5.3 | 13.2 | 12.5 | 22.0 | 7.3 | 5.1 | 0.242 | |
| CIP | 0.365 | |||||||||
| Whole hospital | 16.6 | 15.6 | 14.5 | 16.1 | 16.3 | 17.1 | 20.3 | 4.7 | 0.034 | |
| ICU | 20.2 | 20.0 | 7.9 | 18.9 | 20.3 | 25.6 | 21.8 | 1.8 | 0.236 | |
| SXT | 0.636 | |||||||||
| Whole hospital | 26.6 | 26.0 | 25.6 | 26.7 | 26.5 | 27.0 | 27.8 | 1.8 | 0.013 | |
| ICU | 26.4 | 26.7 | 10.5 | 26.4 | 28.1 | 31.7 | 27.3 | 0.6 | 0.322 | |
| TET | 0.417 | |||||||||
| Whole hospital | 31.7 | 29.2 | 33.3 | 28.7 | 30.7 | 34.8 | 34.0 | 4.8 | 0.184 | |
| ICU | 30.3 | 20.0 | 18.4 | 22.6 | 28.1 | 48.8 | 29.1 | 9.1 | 0.135 | |
| TGC | 0.33 | |||||||||
| Whole hospital | 0.3 | - | - | 0.0 | 0.0 | 0.3 | 0.8 | 0.8 | 0.068 | |
| ICU | 1.6 | - | - | 0.0 | 0.0 | 1.2 | 5.5 | 5.5 | 0.123 |
Resistance Rates (%) of Klebsiella pneumoniae to Antimicrobial Agents in the Whole Hospital and Intensive Care Units
4.4.3. Pseudomonas aeruginosa
There were marked decreases in resistance to amikacin, gentamicin, ciprofloxacin, and levofloxacin, from 11.8 to 3.7%, 32.0 to 5.7%, 30.8 to 18.5%, and 30.6 to 19.0% in the whole hospital, and from 12.1 to 2.6%, 51.5 to 6.1%, 36.4 to 17.4%, and 45.5 to 14.8% in the ICUs, respectively. Cefoperazone/sulbactam, ticarcillin/clavulanic acid, imipenem, and meropenem resistance levels showed marked increases, from 0.0 to 5.9%, 20.4 to 42.2%, 12.5 to 22.4%, and 5.8 to 19.3% in all wards, respectively. P. aeruginosa was still highly sensitive to amikacin, cefoperazone/sulbactam, and cefepime (resistance rates < 10%). The AMR levels did not significantly differ between the ICUs and the whole hospital (P > 0.05). The detailed data are shown in Table 5.
| Antimicrobial Agent/Wards | Pooled | 2013 | 2014 | 2015 | 2016 | 2017 | 2018 | 2018 - 2013, % Change | P-Value a | P-Value b |
|---|---|---|---|---|---|---|---|---|---|---|
| AMK | 0.892 | |||||||||
| Whole hospital | 6.2 | 11.8 | 11.4 | 6.2 | 5.1 | 3.7 | 3.7 | -8.1 | 0.006 | |
| ICU | 5.7 | 12.1 | 10.0 | 4.8 | 12.9 | 1.6 | 2.6 | -9.5 | 0.122 | |
| GEN | 0.857 | |||||||||
| Whole hospital | 15.1 | 32.0 | 24.1 | 21.7 | 11.8 | 9.1 | 5.7 | -26.3 | < 0.001 | |
| ICU | 13.7 | 51.5 | 27.5 | 4.8 | 20.0 | 4.1 | 6.1 | -45.4 | 0.049 | |
| PIP | 0.076 | |||||||||
| Whole hospital | 22.1 | 26.6 | 22.7 | 26.6 | 17.9 | 13.6 | 26.9 | 0.3 | 0.516 | |
| ICU | 29.9 | 42.4 | 27.5 | 23.8 | 22.9 | 27.9 | 34.8 | -7.6 | 0.6 | |
| TZP | 0.388 | |||||||||
| Whole hospital | 10.8 | 8.7 | 10.9 | 15.8 | 9.5 | 8.9 | 11.1 | 2.5 | 0.999 | |
| ICU | 11.0 | 9.1 | 22.5 | 19.0 | 17.1 | 4.9 | 8.7 | -0.4 | 0.388 | |
| SCF | 0.69 | |||||||||
| Whole hospital | 5.3 | 0.0 | 0.0 | 4.7 | 7.1 | 9.6 | 5.9 | 5.9 | 0.038 | |
| ICU | 6.2 | 0.0 | 0.0 | 9.5 | 11.4 | 7.4 | 5.2 | 5.2 | 0.25 | |
| TIM | 0.159 | |||||||||
| Whole hospital | 28.8 | 20.4 | 22.4 | 26.0 | 22.6 | 28.6 | 42.2 | 21.8 | 0.041 | |
| ICU | 40.1 | 33.3 | 32.5 | 28.6 | 35.7 | 27.0 | 63.5 | 30.1 | 0.246 | |
| CAZ | 0.865 | |||||||||
| Whole hospital | 11.5 | 7.5 | 10.7 | 16.8 | 9.9 | 11.1 | 11.9 | 4.4 | 0.583 | |
| ICU | 9.5 | 12.1 | 15.0 | 14.3 | 8.6 | 8.2 | 7.8 | -4.3 | 0.062 | |
| FEP | 0.052 | |||||||||
| Whole hospital | 9.9 | 6.6 | 9.7 | 11.8 | 9.4 | 9.3 | 11.1 | 4.6 | 0.237 | |
| ICU | 8.0 | 6.1 | 5.0 | 4.8 | 10.0 | 8.2 | 8.7 | 2.6 | 0.124 | |
| ATM | 0.424 | |||||||||
| Whole hospital | 22.1 | 18.9 | 18.3 | 23.3 | 20.2 | 24.4 | 24.2 | 5.3 | 0.051 | |
| ICU | 23.2 | 27.3 | 22.5 | 19.0 | 22.9 | 19.7 | 27.0 | -0.3 | 0.857 | |
| IMP | 0.302 | |||||||||
| Whole hospital | 16.7 | 12.5 | 9.2 | 10.8 | 10.5 | 26.0 | 22.4 | 9.8 | 0.088 | |
| ICU | 24.4 | 18.2 | 10.0 | 19.0 | 17.1 | 40.2 | 20.0 | 1.8 | 0.297 | |
| MEM | 0.215 | |||||||||
| Whole hospital | 13.3 | 5.8 | 7.9 | 6.2 | 8.2 | 22.9 | 19.3 | 13.5 | 0.043 | |
| ICU | 20.9 | 12.1 | 10.0 | 19.0 | 17.1 | 35.2 | 14.8 | 2.7 | 0.295 | |
| CIP | 0.737 | |||||||||
| Whole hospital | 25.0 | 30.8 | 24.5 | 29.5 | 20.8 | 30.0 | 18.5 | -12.3 | 0.257 | |
| ICU | 26.2 | 36.4 | 17.5 | 14.3 | 8.6 | 46.7 | 17.4 | -19.0 | 0.93 | |
| LEV | 0.988 | |||||||||
| Whole hospital | 24.4 | 30.6 | 21.8 | 28.3 | 19.6 | 29.9 | 19.0 | -11.7 | 0.393 | |
| ICU | 26.2 | 45.5 | 17.5 | 14.3 | 12.9 | 44.3 | 14.8 | -30.7 | 0.625 |
Resistance Rates (%) of Pseudomonas aeruginosa to Antimicrobial Agents in the Whole Hospital and Intensive Care Units
4.4.4. Acinetobacter baumannii
Except for cefoperazone/sulbactam and tigecycline, to which A. baumannii was highly susceptible, other antimicrobial agents in the ICUs and the whole hospital showed high resistance levels of over 80 and 60%, respectively. Sulfamethoxazole/trimethoprim and cefoperazone/sulbactam resistance rates showed marked increases, from 31.6 to 51.1% and 0 to 21.7% in the whole hospital and 27.3 to 35.4% and 0 to 18.3% in the ICUs (P < 0.05), but the others showed decreasing trends, and amikacin, tobramycin, and piperacillin/tazobactam resistance levels showed marked linear declines (P < 0.05). Except for cefoperazone/sulbactam, sulfamethoxazole/trimethoprim, and tigecycline, the resistance rates of the other antimicrobial agents were significantly different between the ICUs and the whole hospital (P < 0.05), but all of them showed high resistance levels and the same change trends with time. A. baumannii was first found to be resistant to tigecycline in 2014. The detailed data are shown in Table 6.
| Antimicrobial Agent/Wards | Pooled | 2013 | 2014 | 2015 | 2016 | 2017 | 2018 | 2018 - 2013, % Change | P-Value a | P-Value b |
|---|---|---|---|---|---|---|---|---|---|---|
| AMK | 0.001 | |||||||||
| Whole hospital | 58.4 | 71.9 | 54.7 | 62.2 | 52.2 | 54.0 | 62.1 | -9.8 | 0.382 | |
| ICU | 79.8 | 93.2 | 86.7 | 86.0 | 71.2 | 80.4 | 70.7 | -22.5 | 0.026 | |
| GEN | 0.001 | |||||||||
| Whole hospital | 65.3 | 76.3 | 60.2 | 69.0 | 59.0 | 63.3 | 69.2 | -7.1 | 0.572 | |
| ICU | 85.3 | 95.5 | 86.7 | 89.5 | 76.3 | 89.0 | 79.3 | -16.2 | 0.155 | |
| TOB | 0.002 | |||||||||
| Whole hospital | 61.7 | 74.7 | 56.2 | 66.8 | 56.4 | 56.0 | 66.7 | -8.0 | 0.497 | |
| ICU | 81.6 | 94.3 | 86.7 | 89.5 | 73.7 | 81.0 | 73.2 | -21.1 | 0.028 | |
| PIP | 0.001 | |||||||||
| Whole hospital | 71.7 | 75.5 | 63.5 | 74.1 | 67.6 | 66.0 | 86.6 | 11.1 | 0.486 | |
| ICU | 90.5 | 94.3 | 97.8 | 91.9 | 84.0 | 92.0 | 90.2 | -4.1 | 0.280 | |
| TZP | 0.002 | |||||||||
| Whole hospital | 66.5 | 74.4 | 61.6 | 70.5 | 62.1 | 60.8 | 73.9 | -0.5 | 0.835 | |
| ICU | 84.7 | 92.0 | 91.1 | 88.4 | 84.6 | 84.7 | 69.5 | -22.5 | 0.020 | |
| SCF | 0.816 | |||||||||
| Whole hospital | 9.0 | 0.0 | 9.6 | 6.3 | 8.2 | 6.6 | 21.7 | 21.7 | 0.082 | |
| ICU | 7.6 | 0.0 | 8.9 | 4.7 | 6.4 | 8.6 | 18.3 | 18.3 | 0.050 | |
| CAZ | < 0.001 | |||||||||
| Whole hospital | 67.9 | 73.3 | 63.1 | 71.7 | 63.6 | 64.7 | 74.3 | 1.0 | 0.978 | |
| ICU | 88.4 | 89.8 | 95.6 | 90.7 | 84.0 | 89.6 | 86.6 | -3.2 | 0.255 | |
| FEP | < 0.001 | |||||||||
| Whole hospital | 67.7 | 74.7 | 62.5 | 71.0 | 63.7 | 64.2 | 73.4 | -1.3 | 0.874 | |
| ICU | 87.4 | 93.2 | 97.8 | 90.7 | 83.3 | 84.0 | 86.6 | -6.6 | 0.072 | |
| IMP | < 0.001 | |||||||||
| Whole hospital | 62.8 | 66.2 | 56.2 | 69.2 | 60.3 | 60.1 | 66.5 | 0.3 | 0.930 | |
| ICU | 84.0 | 86.4 | 88.9 | 84.9 | 82.7 | 86.5 | 75.6 | -10.8 | 0.104 | |
| MEM | < 0.001 | |||||||||
| Whole hospital | 64.0 | 67.3 | 54.5 | 69.5 | 60.7 | 60.4 | 73.4 | 6.1 | 0.562 | |
| ICU | 86.3 | 86.4 | 91.1 | 89.5 | 82.1 | 87.7 | 85.4 | -1.0 | 0.461 | |
| CIP | < 0.001 | |||||||||
| Whole hospital | 68.0 | 75.7 | 61.0 | 70.7 | 64.7 | 64.8 | 74.6 | -1.1 | 0.998 | |
| ICU | 88.1 | 94.3 | 95.6 | 88.4 | 81.4 | 89.6 | 86.6 | -7.7 | 0.159 | |
| LEV | < 0.001 | |||||||||
| Whole hospital | 63.1 | 68.9 | 56.6 | 67.5 | 59.1 | 57.9 | 72.1 | 3.2 | 0.187 | |
| ICU | 85.0 | 89.8 | 95.6 | 82.6 | 79.5 | 86.5 | 84.1 | -5.6 | 0.262 | |
| SXT | 0.601 | |||||||||
| Whole hospital | 47.4 | 31.6 | 37.1 | 40.2 | 49.5 | 63.3 | 51.1 | 19.5 | 0.026 | |
| ICU | 56.3 | 27.3 | 53.3 | 41.9 | 59.0 | 88.3 | 35.4 | 8.1 | 0.431 | |
| TGC | 0.198 | |||||||||
| Whole hospital | 1.5 | 3.4 | 2.4 | 1.0 | 0.5 | 1.6 | -1.8 | 0.146 | ||
| ICU | 2.6 | 6.7 | 4.7 | 1.9 | 1.2 | 2.4 | -4.3 | 0.076 |
Resistance Rates (%) of Acinetobacter baumannii to Antimicrobial Agents in the Whole Hospital and Intensive Care Units
4.4.5. Staphylococcus aureus
No isolate was found to be resistant to vancomycin and linezolid. Staphylococcus aureus showed high susceptibility to sulfamethoxazole/trimethoprim, clindamycin, erythromycin, and penicillin, but the susceptibility rates showed marked decreasing trends with time (P < 0.05). The other AMR levels showed marked decreasing trends with time (P < 0.05) in the ICUs and the whole hospital from 2013 to 2018, and rifampicin, levofloxacin, ciprofloxacin, gentamicin, and tetracycline resistance levels showed marked linear declines (P < 0.05). Except for levofloxacin and ciprofloxacin resistance levels, which were significantly different between the ICUs and the whole hospital (P < 0.05), the other AMR levels were not significantly different between the ICUs and the whole hospital (P > 0.05). The detailed data are shown in Table 7.
| Antimicrobial Agent/Wards | Pooled | 2013 | 2014 | 2015 | 2016 | 2017 | 2018 | 2018 - 2013, % Change | P-Value a | P-Value b |
|---|---|---|---|---|---|---|---|---|---|---|
| VAN | - | |||||||||
| Whole hospital | 0.0 | 0.0 | 0.0 | 0.0 | 0.0 | 0.0 | 0.0 | 0.0 | - | |
| ICU | 0.0 | 0.0 | 0.0 | 0.0 | 0.0 | 0.0 | 0.0 | 0.0 | - | |
| LZD | - | |||||||||
| Whole hospital | 0.0 | 0.0 | 0.0 | 0.0 | 0.0 | 0.0 | 0.0 | 0.0 | - | |
| ICU | 0.0 | 0.0 | 0.0 | 0.0 | 0.0 | 0.0 | 0.0 | 0.0 | - | |
| RD | 0.378 | |||||||||
| Whole hospital | 7.3 | 16.1 | 10.3 | 6.8 | 4.7 | 6.2 | 3.3 | -12.7 | 0.015 | |
| ICU | 11.8 | 37.0 | 31.3 | 0.0 | 10.4 | 0.0 | 6.5 | -30.6 | 0.064 | |
| SXT | 0.623 | |||||||||
| Whole hospital | 6.0 | 6.5 | 6.5 | 7.7 | 5.9 | 6.3 | 3.9 | -2.6 | 0.154 | |
| ICU | 5.9 | 0.0 | 12.5 | 25.0 | 2.1 | 9.4 | 0.0 | 0.0 | 0.738 | |
| LEV | 0.019 | |||||||||
| Whole hospital | 13.9 | 20.2 | 16.0 | 12.5 | 12.8 | 13.6 | 10.6 | -9.6 | 0.026 | |
| ICU | 28.3 | 44.4 | 50.0 | 33.3 | 35.4 | 15.1 | 12.9 | -31.5 | 0.009 | |
| CIP | 0.011 | |||||||||
| Whole hospital | 16.3 | 22.5 | 19.3 | 15.5 | 15.5 | 15.8 | 12.0 | -10.5 | 0.008 | |
| ICU | 33.2 | 51.9 | 50.0 | 33.3 | 41.7 | 18.9 | 19.4 | -32.5 | 0.012 | |
| GEN | 0.369 | |||||||||
| Whole hospital | 24.3 | 36.5 | 31.2 | 23.3 | 21.1 | 21.3 | 17.5 | -19.0 | 0.005 | |
| ICU | 27.3 | 59.3 | 50.0 | 41.7 | 14.6 | 20.8 | 12.9 | -46.4 | 0.005 | |
| DA | 0.706 | |||||||||
| Whole hospital | 60.0 | 65.5 | 68.5 | 59.9 | 59.2 | 59.9 | 50.3 | -15.2 | 0.022 | |
| ICU | 55.6 | 55.6 | 68.8 | 75.0 | 58.3 | 60.4 | 29.0 | -26.5 | 0.218 | |
| ERY | 0.768 | |||||||||
| Whole hospital | 60.8 | 65.1 | 69.7 | 61.0 | 59.5 | 61.1 | 51.6 | -13.5 | 0.037 | |
| ICU | 56.1 | 51.9 | 68.8 | 83.3 | 60.4 | 60.4 | 29.0 | -22.8 | 0.336 | |
| PEN | 0.843 | |||||||||
| Whole hospital | 93.3 | 95.3 | 95.7 | 94.9 | 95.6 | 95.0 | 84.6 | -10.7 | 0.145 | |
| ICU | 93.0 | 88.9 | 93.8 | 100.0 | 100.0 | 96.2 | 77.4 | -11.5 | 0.546 | |
| OXA | 0.098 | |||||||||
| Whole hospital | 26.5 | 29.8 | 29.9 | 29.2 | 24.9 | 26.2 | 21.3 | -8.4 | 0.013 | |
| ICU | 36.9 | 40.7 | 56.3 | 41.7 | 50.0 | 30.2 | 12.9 | -27.8 | 0.103 | |
| TET | 0.526 | |||||||||
| Whole hospital | 30.0 | 37.9 | 34.1 | 28.8 | 28.2 | 30.2 | 24.2 | -13.7 | 0.015 | |
| ICU | 32.1 | 59.3 | 62.5 | 25.0 | 25.0 | 24.5 | 19.4 | -39.9 | 0.028 |
Resistance Rates (%) of Staphylococcus aureus to Antimicrobial Agents in the Whole Hospital and Intensive Care Units
5. Discussion
Microbial resistance to antimicrobial agents (AMR) has been a major challenge. The main cause of AMR is the overuse and misuse of antimicrobial agents in healthcare settings and by the general public. The containment of AMR is an urgent priority, both in China and worldwide (14). Monitoring AMR is the most effective means to provide useful information for prevention and help clinicians prescribe effective antibiotic therapy.
Our study showed that only the percentages of sputum/endotracheal aspirate specimens were higher in the ICUs than in the whole hospital. Moreover, the culture-positive rates of sputum/endotracheal aspirates in the ICUs were higher than those in the whole hospital. The reason may be that ICU-acquired pneumonia and ventilator-associated pneumonia (VAP) were the most common types of healthcare-associated infections in ICU patients, and ICU-acquired pneumonia and VAP are major causes of morbidity and mortality in ICU patients (15, 16). It was similar to those from Tanzania (17). Additionally, this study showed that most of the isolates were recovered from sputum/endotracheal aspirates from the whole hospital (40.4%) and ICUs (72.5%), similar to reports from CHINET surveillance in China (18, 19) (40.0% in 2017 and 41.6% in 2016) for the whole hospital and in Iran (20) (70.63%) for ICUs. The distributions of the other specimens with isolates were different in the ICUs and the whole hospital. The sources of isolates in the whole hospital were significantly different from those in the ICUs. Therefore, it was necessary to analyze the distribution and detection rate of specimens in different areas.
This study showed that the percentages of GPB and GNB in the whole hospital were similar to those reported by CHINET surveillance in China (19) (GPB, 29.2% and GNB, 70.8%) and Greece (21) (GPB, 31.8% and GNB, 68.2%) and different from those reported in China (22) (GPB, 20.25% and GNB, 79.75%) and southern Ethiopia (23) (GPB, 37.23% and GNB, 62.77%). In the ICUs, the percentages of bacteria were 18.4% for GPB and 81.6% for GNB, different from those reported in Poland (24) (GPB, 21.6% and GNB, 71.6%) and similar to those reported in Saudi Arabia (25) (GPB, 15.9% and GNB, 81.0%) and Greece (21) (GPB, 18.5% and GNB, 81.5%). The percentage of GNB was significantly higher in the whole hospital than in the ICUs (P < 0.05). This study found that there were differences in the percentages of isolates between different cities, but we could still refer to the national data of CHINET surveillance in China.
Our results showed that the species of the five dominant bacteria were consistent with those reported in studies in other regions, including the CHINET for China (5), Zhengzhou (China) (6), Nanjing (China) (26), Seoul (Korea) (27), Somalia (28), and Greece (21), but the proportions of the five dominant bacteria were different. Therefore, it was necessary to analyze the proportions of bacteria in different areas. This study found that the detection rates of MRSA, ESBL-E. coli, CRPA, CRAB, and XDRAB in the whole hospital were lower than those in the ICUs, similar to other reports from China (Wuhan) (29); however, the detection rates of ESBL-K. pneumoniae, CREC, CRKP, and XDRPA in the ICUs and the whole hospital were similar, while the detection rates of XDREC, XDRKP, and XDRSA in the ICUs were lower than those in the whole hospital. These results were different from reports in New Jersey (the USA) (30). Besides, MRSA showed a decreasing trend in both the ICUs and the whole hospital, similar to that reported by CHINET surveillance (5). The detection rates of XDRPA and XDRAB were similar to those reported by CHINET surveillance, but the rate of XDRKP was lower than that reported by CHINET surveillance (5). Therefore, it is necessary to monitor the patterns of AMR in this area, and this study provides reference data for the prevention and control of super-resistant bacteria in this area.
The trends of most antimicrobial resistance levels among E. coli and K. pneumoniae were stable in the ICUs and the whole hospital. For P. aeruginosa, a decrease in resistance with time was observed for amikacin, gentamicin, ciprofloxacin, and levofloxacin, and an increase in resistance was observed for ticarcillin/clavulanic acid, cefoperazone/sulbactam, cefepime, imipenem, and meropenem in both the ICUs and the whole hospital. For A. baumannii, a decrease in resistance with time was observed for amikacin, gentamicin, tobramycin, piperacillin/tazobactam, ciprofloxacin, imipenem, and tigecycline in the ICUs, while an increase in resistance was observed for cefoperazone/sulbactam in both the ICUs and the whole hospital. The resistance rates of S. aureus to all the antimicrobial agents showed decreasing trends, especially in the ICUs, similar to other reports (Wuhan) (29).
The results of the present study showed that the resistance levels to carbapenems, β-lactam-containing agents, and tigecycline in E. coli were higher than those in K. pneumoniae; however, E. coli and K. pneumoniae maintained high sensitivity to all the agents. In this study, the resistance rates of E. coli to all the antimicrobial agents in the whole hospital and the ICUs were higher than those reported in other areas, including by CHINET surveillance (5) and in Nanjing (26), Zhengzhou (6), and Greece (31). However, the resistance levels of K. pneumoniae to most of the antimicrobial agents were lower than those reported in these areas. For P. aeruginosa, we found that it was more sensitive to all the antimicrobial agents than A. baumannii. However, A. baumannii had a high sensitivity to only cefoperazone/sulbactam and tigecycline, while it had a high resistance rate to all the other antimicrobial agents.
In the whole hospital and ICUs, the resistance rates of A. baumannii to ceftazidime, cefepime, imipenem, and meropenem were higher than those reported by CHINET surveillance (5) and those in Zhengzhou (6) and Kazakhstan (32) but lower than those reported in Nanjing and Lebanon. However, in the whole hospital and ICUs, the resistance rates of P. aeruginosa to all the antimicrobial agents were lower than those reported by CHINET surveillance (5) and those in Zhengzhou (6), Nanjing (26), and Greece (21). We also found that P. aeruginosa was more sensitive to ceftazidime and cefepime than to imipenem and meropenem in our study. This may be related to the mechanism of carbapenem resistance caused by the deletion of outer membrane proteins and the overexpression of efflux pump genes in P. aeruginosa. For S. aureus, the resistance rate to most of the antimicrobial agents in the whole hospital was lower than that reported by CHINET surveillance (5) and those in Zhengzhou (6), Nanjing (26), and North Korea (27), but higher than that reported in Dongguan (33). In the ICUs, the resistance rates of S. aureus to most of the antimicrobial agents were lower in our study than those in Greece (21) and higher than those in Kazakhstan (32). The difference in resistance of these bacteria to different antibiotics may be related to the distribution of patients in the region and the management of antibiotic use.
The results of the present study showed that the susceptibility of A. baumannii to tigecycline began in 2014, with resistance rates of 3.4% (hospital-wide) and 6.7% (ICUs). However, resistance to tigecycline showed a decreasing trend with time. The resistance level of E. coli to tigecycline (< 0.05) has remained stable since 2015, but it was higher than those reported in Africa (0), North America (0), and South America (0) and lower than those reported in Asia (0.3%) and Europe (0.1%) (34). The resistance levels of K. pneumoniae to tigecycline showed an increasing trend with time, which was higher than those reported in Africa (0) and North America (0) but lower than those reported in Asia (1.3%), South America (0.9%), and Europe (0.7%) (34). However, bacterial isolates were still highly sensitive to tigecycline in vitro in our study (susceptibility > 99%).
This study has two limitations. First, it was a single-center study. Since susceptibility rates vary among hospitals and units in different regions, the results may not be representative of and generalizable to other institutions, especially primary health care institutions. Second, incubation periods may vary according to the type of the pathogen or a patient’s underlying condition, and it was difficult to distinguish between cases of ICU-acquired infections and pre-existing colonization on ICU admission. Therefore, we will conduct a separate and more detailed study of cases of ICU-acquired infections and pre-existing colonization on ICU admission in future studies.
5.1. Conclusions
The distribution of clinical samples, the detection rate, and the sensitivity of clinical isolates varied with time and region. The susceptibility rates of E. coli and A. baumannii to antimicrobial agents were significantly higher than those in other areas. Besides, K. pneumoniae and P. aeruginosa had higher susceptibility to antimicrobial agents in our study than those reported in other regions, and the resistance of S. aureus to antimicrobial agents gradually decreased over time. Between the ICUs and the whole hospital, the resistance rates to antimicrobial agents were significantly different for A. baumannii and slightly different for E. coli, but there was no difference for K. pneumoniae, S. aureus, and P. aeruginosa. These data provide important useful information for the treatment and prevention of clinical infections.
