


1. Background
Urinary tract infection (UTI) is one of the most common human infections of bacterial origin. Among the bacteria that cause UTIs, the strains of E. coli, called uropathogenic Escherichia coli (UPEC), are the most important causes of this infection. This infection is one of the main causes of hospitalization with significant complications and high healthcare costs (1, 2). Today, E. coli phylogenetic groups are determined based on the presence of chuA, TspE4.C2, and yjaA genes. According to the results of various studies, most uropathogenic E. coli strains are in the B2 and D phylogroups while commensal strains belong to groups A and B1 (3). The ability of E. coli strains to cause urinary tract infections is due to the formation of biofilms and the presence of many virulence factors that depend on the invasion, colonization, and survival of uroepithelium cells (4, 5). Bacteria with these factors can fight host defense factors such as cytokines, including interleukin-8, urinary flow, and Tamm-Horsfall proteins (uroepithelial cell defensin peptides). Therefore, the pathogenicity of E. coli strains in UTIs depends on the balance between the host and these bacterial virulence factors (6).
Biofilms are microbial communities enclosed in the extracellular polymeric matrix composed of nucleic acids, proteins, and enzymes that bind to living and non-living surfaces. Biofilms can increase the survival of bacteria in the urinary tract by protecting them against the cleansing effects of hydrodynamic forces, host defense mechanisms, phagocytosis, and antibiotics. Therefore, biofilm production plays an important role in the pathogenicity of UPEC strains (7-10). Uropathogenic E. coli strains are pathogenic due to virulence factors such as adhesion fimbriae (fim-H, iha), toxins (cnf1, hlyA), iron-forming systems (iroN, aer), macrophage degradation agents (ompT protease), and serum resistance factors (traT), which are commonly encoded in Pathogenicity Islands (PAI). Besides, serum resistance factors (traT) contribute to the pathogenesis of E. coli strains in UTIs (11-14).
The pathogenicity islands (PAIs) are specific regions on the bacterial chromosome where virulence genes accumulate. PAIs and their associated virulence genes spread among bacterial populations by horizontal transfer (8). Increased antibiotic resistance (due to overuse and improper use of antibiotics) among pathogens, especially those causing UTIs, is a major problem that is the main reason for the emergence of resistant strains (especially multidrug-resistant strains), dissemination of resistance factors to susceptible strains, increased treatment costs, treatment failure, and death (3, 14, 15). Due to the increasing infections associated with E. coli and different factors involved in bacterial pathogenesis in different parts of the world, as well as the emergence of drug-resistant strains, it seems necessary to study pathogenic factors in drug-resistant bacteria (16).
2. Objectives
This study determined the ability of biofilm formation by the Congo red agar method, the presence of virulence genes and phylogenetic groups using the multiplex PCR method, and the relationship between biofilm formation and antibiotic resistance patterns and virulence genes in E. coli clinical isolates in Yasuj.
3. Methods
In this cross-sectional study, 144 E. coli isolates were collected from urine samples of patients with UTIs who had been referred to Imam Sajjad and Shahid Beheshti hospitals in Yasuj. The isolates were incubated on blood agar and Eosin methylene blue agar (Merck, Germany) at 37°C for 24 h. After culture, they were identified and confirmed using standard microbiological and biochemical methods. The biochemical analyses like indole test, citrate test, triple sugar iron agar test, and urease test were performed for the identification of microorganisms. The isolates were finally stored in Trypticase soy broth (Merck, Germany), with 20% glycerol at -20°C for the study of biofilm formation and DNA extraction (3).
3.1. Biofilm Production Assays
Biofilm production was detected using the Congo red agar method, following the procedure described by Freeman et al. The Congo red agar medium was prepared by mixing its ingredients such as agar (Merck, Germany), sucrose, and Congo red dye and brain-heart infusion broth in one liter of distilled water. The Congo red agar reagent was prepared separately as an aqueous solution and autoclaved at 121°C for 10 min. After preparation of brain-heart infusion broth with agar 10 g/mL, the reagent with 50 g/L sucrose was added to the medium. By removing a single bacterial colony from the Eosin methylene blue agar medium (Merck, Germany) with a loop, it was cultured on the surface of the Congo red agar medium. Finally, the plates were incubated for 24 to 48 h at 37°C. Biofilm-producing strains were divided into three groups: strong biofilm producers, moderate biofilm producers, and weak biofilm producers (17, 18).
3.2. Antimicrobial Susceptibility Test
We assessed the susceptibility of E. coli isolates to the antibiotics ciprofloxacin (30 μg), nalidixic acid (30 μg), cefotaxime (30 μg), cotrimoxazole (25 μg), ampicillin (10 μg), ceftriaxone (30 μg), tetracycline (30 μg), aztreonam (30 μg), ceftizoxime (30 μg), and amikacin (30 μg; BD-BBL Company, America) using the Kirby-Bauer disk diffusion method as per the CLSI and clinical standards. To control the quality of the disks, E. coli ATCC 25922 was used (3).
3.3. DNA Extraction
In the present study, genomic DNA extraction was performed using the boiling method. Briefly, several colonies of bacteria (24 h) were first dissolved in 300 μL of distilled water. It was then boiled at 95°C for 10 min. Centrifugation was done at 12,000 rpm for 10 min. To perform the PCR method, the supernatant was stored as a template DNA (9).
3.4. PCR Method to Determine Virulence Genes and Phylogenetic Groups
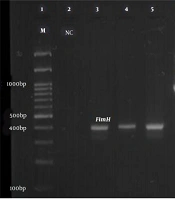
All isolates were tested for the presence of virulence genes such as fimH, ihA, iroN, iutA, aer, ompT, traT, Pai, cnf1, and hlyA genes. The primers used to detect the virulence genes in this study are shown in Table 1, which were purchased from Pishgam Company (Iran). In the present study, the phylogenetic groups of E. coli isolates were determined using triplex PCR with chuA, TspE4.C2, and yjaA primers as described by Clermont et al. (19). The PCR program to identify the virulence genes and phylogenetic groups of E. coli strains was as follows: (1) initial denaturation at 94°C for 5 min; (2) 30 cycles including denaturation at 94°C for one minute; and (3) binding the primers (annealing) of the phylogenetic groups to the template DNA at 59°C for 20 s. The binding temperatures of virulence gene primers are listed in Table 1. The extension stage was done at 72°C for one minute, and the final extension stage was performed at 72°C for 10 min (Table 1). Electrophoresis of PCR products was performed on a 2% agarose gel with DNA safe stain dye solution in the presence of a 100 bp marker (Pishgam, Iran) and 90-volt constant voltage for 65 min. The gel was then examined with a UV Transilluminator (Major Science, Taiwan) (Figures 1 and 2).
| Gens | Sequences (5′ → 3′) | Product size (bp) | Annealing Tm, (°C) | References |
|---|---|---|---|---|
| FimH | 400 | 55 | (20) | |
| Forward | GTTGTTCTGTCGGCTCTGTC | |||
| Reverse | TAAATGTCGCACCATCCAG | |||
| ihA | 827 | 58 | (21) | |
| Forward | CTGGCGGAGGCTCTGAGATCA | |||
| Reverse | TCCTTAAGCTCCCGCGGCTGA | |||
| iroN | 1048 | 58 | (22) | |
| Forward | CGGTTCCTGGCACGAATATCAT | |||
| Reverse | TTTTGGGATTTCCCCAACCTGG | |||
| iutA | 300 | 63 | (23) | |
| Forward | GGCTGGACATCATGGGAACTGG | |||
| Reverse | CGTCGGGAACGGGTAGAATCG | |||
| aer | 602 | 61 | (24) | |
| Forward | TACCGGATTGTCATATGCAGACCGT | |||
| Reverse | AATATCTTCCTCCAGTCCGGAGAAG | |||
| ompT | 559 | 58 | (25) | |
| Forward | ATCTAGCCGAAGAAGGAGGC | |||
| Reverse | CCCGGGTCATAGTGTTCATC | |||
| TraT | 290 | 63 | (24) | |
| Forward | GGTGTGGTGCGATGAGCACAG | |||
| Reverse | CACGGTTCAGCCATCCCTGAG | |||
| Cnf1 | 498 | 63 | (24) | |
| Forward | AAGATGGAGTTTCCTATGCAGGAG | |||
| Reverse | CATTCAGAGTCCTGCCCTCATTATT | |||
| HlyA | 1177 | 63 | (26) | |
| Forward | AACAAGGATAAGCACTGTTCTGGCT | |||
| Reverse | ACCATATAAGCGGTCATTCCCGTCA | |||
| PAI | 930 | 63 | (24) | |
| Forward | GGACATCCTGTTACAGCGCGCA | |||
| Reverse | TCGCCACCAATCACAGCCGAAC |
Primers Used to Detect Virulence Genes in Uropathogenic Escherichia coli Isolates
.")
PCR product electrophoresis for FimH, PAI, and hlyA genes (Row M, marker 100 bp DNA ladder; Rows 3, 4, and 5, positive sample of FimH gene 400 bp; Row 6, positive sample of PAI gene 930 bp; Rows 8 and 9, positive sample of hlyA gene 1177 bp; Rows 2 and 10, negative control).
.")
PCR product electrophoresis for aer, iroN, ompT, ihA, and cnf1 genes (Row M, marker 100 bp DNA ladder; Rows 3 and 12, positive sample of aer 602 bp; Row 4, positive sample of TraT gene 290 bp; Row 5, positive sample of iroN gene 1148 bp; Rows 6 and 11, positive sample of ihA 857 bp; Rows 6 and 11, positive sample of ompT gene 559 bp; Row 8, positive sample of cnf1 gene 498 bp, and Rows 1 and 13, negative control).
3.5. Statistical Analysis
We used SPSS version 18.0 software for statistical analysis. Fisher's exact and chi-square tests were used to investigate the relationship between the formation of biofilms and virulence genes. The significance level was set at P-value < 0.05.
4. Results
4.1. Distribution of Virulence Genes
According to the results of the PCR test for the identification of surveyed virulence genes, the highest frequency belonged to the FimH gene, which was detected in 93.8% of the isolates. The prevalence of iutA virulence gene was 90.3% (130 samples), traT 88.8% (128 samples), ompT 88.2% (127 samples), PAI 77.8% (112 samples), aer 62.5% (90 Sample), ihA 59.7% (86 samples), cnf1 toxin-related gene 41.7% (60 samples), and HlyA 34.7% (50 samples). The iroN gene had the lowest frequency as 32.6% (47 samples). The expression patterns of virulence genes are shown in Table 2.
| Type of Virulence Factors | Virulence Genes | No. (%) (n = 144) |
|---|---|---|
| Adhesion | fimH | 135 (93.8) |
| ihA | 86 (59.7) | |
| Iron acquisition systems | iutA | 130 (90.3) |
| iroN | 47 (32.6) | |
| aer | 90 (62.5) | |
| Toxins | Cnf1 | 60 (41.7) |
| HlyA | 50 (34.7) | |
| Outer membrane proteins | ompT | 127 (88.2) |
| Serum Resistance | traT | 128 (88.8) |
| pathogenicity islands | PAI | 112 (77.8) |
| Patterns of Gene Expression | ||
| Pattern Codes | Virulence Genes | No. (%) (n = 144) |
| E1 | FimH, ihA | 81 (56.25) |
| E2 | FimH, iutA | 122 (84.72) |
| E3 | IutA, iron | 42 (29.16) |
| E4 | IroN, aer | 20 (13.8) |
| E5 | ompT, traT | 112 (77.77) |
| E6 | OmpT, PAI | 99 (68.75) |
| E7 | PAI.HlyA | 39 (27.08) |
| E8 | traT, cnf1 | 53 (36.8) |
| E9 | HlyA, cnf1 | 27 (18.75) |
| E10 | PAI, ompT, traT | 91 (63.19) |
| E11 | PAI, cnf1, hlyA | 20 (13.8) |
| E12 | HlyA, cnf1, ompT, traT | 23 (15.97) |
| E13 | fimH, ompT, iuta, PAI | 86 (59.72) |
| E14 | FimH, PAI, ompT, traT | 87 (60.41) |
| E15 | FimH, iha, HlyA, cnf1 | 17 (11.80) |
| E16 | ompT, traT, fimH, iha, HlyA, cnf1 | 14 (9.7) |
| E17 | ompT, traT, fimH, iha, HlyA, cnf1, cnf1 | 9 (6.25) |
Results on the Frequency of Virulence Genes and Selected Patterns of Urinary Tract Infection
The Triplex PCR results showed that 106 (73.6%) isolates belonged to the phylogenetic group B2, 23 (15.9%) isolates belonged to group D, eight (5.5%) isolates belonged to group B1, and seven (4.86%) isolates belonged to group A. Also, the distribution of virulence genes among the phylogenetic groups of E. coli was investigated that showed the prevalence of virulence genes belonging to group B2 was higher than those of other phylogenetic groups. The highest frequency of pathogenic genes in group B2 belonged to fimH (94%), iutA (92%), ompT (90%), traT (89%), PAI (76%), aer (69%), ihA (62%), cnf1 (41%), hlyA (34%), and iroN (31%). A significant correlation was observed between E. coli phylogenetic groups and aer (P = 0.019), iroN (P = 0.042), and ompT (P = 0.032) virulence genes (Table 3).
| Phylogenetic Group | No. Strains | Virulence Factors | |||||||||
|---|---|---|---|---|---|---|---|---|---|---|---|
| fimH | iutA | ihA | PAI | aer | iroN | TraT | hlyA | CNF | ompT | ||
| A | 7 (4.8) | 6 (85) | 5 (71) | 5 (71) | 5 (71) | 2 (28) | 3 (31) | 6 (85) | 2 (28) | 3 (42) | 4 (51) |
| B1 | 8 (5.6) | 7 (87) | 6 (755) | 2 (25) | 5 (62) | 4 (50) | 3 (42) | 5 (62) | 2 (25) | 5 (62) | 8 (100) |
| B2 | 106 (73.6) | 100 (94) | 98 (92) | 66 (62) | 81 (76) | 74 (69) | 33 (31) | 95 (89) | 36 (34) | 44 (41) | 96 (90) |
| D | 23 (16) | 22 (95) | 21 (91) | 13 (25) | 21 (91) | 10 (43) | 5 (21) | 22 (95) | 10 (43) | 8 (34) | 19 (82) |
| P-value | 0.680 | 0.135 | 0.188 | 0.285 | 0.019 | 0.042 | 0.077 | 0.740 | 0.597 | 0.032 | |
Distribution of Virulence Genes Among Phylogenetic Groups of Uropathogenic Escherichia coli a
4.2. Results of Biofilm Formation in Escherichia coli Strains
Based on the Congo red agar method for biofilm formation, out of 144 E. coli isolates from UTI cases in Yasuj, 113 isolates could form biofilms. The results were interpreted based on the appearance of the colony. Out of 113 isolates with positive biofilms, 22 isolates had very black colonies (strong biofilm producers), 27 isolates had black colonies with smooth and round surfaces (medium biofilm producers), and 64 isolates had gray colonies (weak biofilm producers). Biofilm production was significantly associated with cnf1 virulence genes (P = 0.038), but no significant association was observed with other virulence genes (Table 4). In this study, the expression of virulence genes was investigated by the PCR method. The prevalence of virulence genes in biofilm-producing strains was as follows. The results showed that among biofilm producers, the prevalence of fimH, iutA, ompT, traT, PAI, aer, ihA, Cnf1, hlyA, and iroN genes was 93.8, 92, 89, 89, 79, 62, 61, 46, 35, and 29%, respectively (Table 4).
The biofilm forming isolates showed maximum resistance to ampicillin (85%), tetracycline (69%), cotrimoxazole (66%), ceftizoxime (64%), aztreonam (61%), nalidixic acid (59%), ceftriaxone (53%), ciprofloxacin (52%), cefotaxime (50%) and the lowest to amikacin (0%). In this study, a significant relationship was observed between the strains of biofilm formation and resistance to ampicillin (P = 0.020) and cotrimoxazole (P = 0.038) antibiotics (Table 5). Besides, we investigated the relationship between the presence of virulence genes in E. coli strains and antibiotic resistance patterns, as shown in Table 6.
| Gens Virulence | No. (%) of Strains | P-Value | |||
|---|---|---|---|---|---|
| Strong Biofilm Producers (n = 22 ) | Moderate Biofilm Producers (n = 27) | Weak Biofilm Producers (n = 64) | Total | ||
| FimH | 20 (93.8) | 25 (92.6) | 61 (95.3) | 106 (93.8) | 0.728 |
| ihA | 14 (63.3) | 14 (51.9) | 42 (65.6) | 70 (61.9) | 0.458 |
| Hly | 11 (50) | 8 (29.6) | 21 (32.8) | 40 (35.4) | 0.268 |
| Cnf1 | 15 (68.2) | 14 (51.9) | 24 (37.5) | 53 (46.9) | 0.038 |
| iroN | 8 (36.4) | 8 (29.65) | 17 (26.6) | 33 (29.2) | 0.683 |
| iutA | 21 (95.5) | 25 (92.6) | 58 (90.6) | 104 (92) | 0.765 |
| Aer | 13 (59.1) | 20 (74.1) | 38 (59.4) | 71 (62.8) | 0.383 |
| ompT | 20 (90.9) | 25 (92.6) | 56 (87.5) | 101 (89.4) | 0.746 |
| TraT | 18 (81.8) | 23 (85.8) | 60 (93.8) | 101 (89.4) | 0.211 |
| PAI | 20 (90.9) | 20 (74.1) | 50 (78.1) | 90 (79.6) | 0.312 |
Frequency of Virulence Genes in Escherichia coli Isolates of Uropathogen-Forming Biofilms a
| Antibiotics | Biofilm Producers; 113 (78.4%) | Non-biofilm Producers; 31 (21.5%) | P-Value | ||
|---|---|---|---|---|---|
| R | S | R | S | ||
| Ampicillin | 97 (85) | 16 (14) | 21 (67) | 10 (32) | 0.020 a |
| Cefotaxime | 57 (50) | 53 (46) | 12 (38) | 19 (61) | 0.611 |
| Ceftriaxone | 61 (53) | 52 (46) | 12 (38) | 19 (61) | 0.406 |
| Ceftizoxime | 73 (64) | 40 (35) | 11 (35) | 20 (64) | 0.109 |
| Cotrimoxazole | 75 (66) | 37 (32.7) | 16 (51) | 15 (48) | 0.038 a |
| Aztreonam | 69 (61) | 34 (30) | 18 (58) | 13 (41) | 0.622 |
| ciprofloxacin | 59 (52) | 54 (47.7) | 14 (45) | 17 (54) | 0.422 |
| Nalidixic acid | 67 (59) | 46 (40) | 15 (48) | 16 (51) | 0.093 |
| Tetracycline | 78 (69) | 35 (30.9) | 18 (58) | 13 (41) | 0.325 |
Antibiotic Susceptibility Results of Biofilm and Non-biofilm Producing Uropathogenic Escherichia coli by Congo Red Agar
| Virulence Gen | Antibiotic | ||||||||
|---|---|---|---|---|---|---|---|---|---|
| Ampicillin | Cefotaxime | Ceftriaxone | Ceftizoxime | Cotrimoxazole | Aztreonam | Ciprofloxacin | Nalidixic Acid | tetracycline | |
| FimH | 109 (80) | 56 (41) | 56 (41) | 57 (42) | 77(54) | 73(54) | 45 (33) | 63 (46) | 83 (63) |
| P-value | 0.889 | 0.552 | 0.538 | 0.258 | 0.167 | 0.316 | 0.100 | 0.410 | 0.249 |
| ihA | 71 (82) | 42 (48) | 41 (47) | 43 (50) | 54(62) | 55(64) | 41 (47) | 45 (52) | 52 (67) |
| P-value | 0.757 | 0.137 | 0.277 | 0.099 | 0.528 | 0.037 | 0.001 | 0.185 | 0.971 |
| iutA | 105 (80) | 57 (43) | 54 (41) | 58 (44) | 79 (60) | 74 (56) | 46 (35) | 63 (48) | 77 (59) |
| P-value | 0.852 | 0.417 | 0.831 | 0.738 | 0.156 | 0.425 | 0.994 | 0.757 | 0.561 |
| iroN | 37 (78) | 14 (29) | 9 (19) | 16 (34) | 26 (55) | 24 (51) | 12 (25) | 20 (42) | 28 (59) |
| P-value | 0.497 | 0.027 | 0.000 | 0.263 | 0.745 | 0.601 | 0.181 | 0.655 | 0.241 |
| aer | 69 (76) | 42 (46) | 44 (48) | 46 (51) | 51 (56) | 53 (58) | 35 (38) | 50 (72) | 52 (57) |
| P-value | 0.236 | 0.032 | 0.29 | 0.005 | 0.662 | 0.149 | 0.069 | 0.051 | 0.445 |
| Hly A | 39 (78) | 14 (28) | 18 (36%) | 16 (32) | 29 (58) | 21 (42) | 11 (22) | 23 (46) | 33 (66) |
| P-value | 0.148 | 0.034 | 0.148 | 0.106 | 0.902 | 0.043 | 0.032 | 0.530 | 0.394 |
| CNF | 45 (75) | 21 (35) | 21 (35) | 23 (38) | 35 (58) | 33 (55) | 22 (36) | 26 (43) | 23 (38) |
| P-value | 0.140 | 0.137 | 0.186 | 0.387 | 0.725 | 0.537 | 0.323 | 0.176 | 0.330 |
| TraT | 104 (81) | 56 (43) | 56 (43) | 55 (44) | 76 (59) | 75 (58) | 48 (37) | 62 (48) | 78 (60) |
| P-value | 0.670 | 0.205 | 0.182 | 0.380 | 0.552 | 0.116 | 0.237 | 0.298 | 0.380 |
| ompT | 103 (81) | 52 (40) | 56 (40) | 53 (41) | 74 (58) | 75 (58) | 44 (34) | 64 (50) | 78 (61) |
| P-value | 0.241 | 0.642 | 0.344 | 0.487 | 0.824 | 0.722 | 0.176 | 0.266 | 0.335 |
| PAI | 90 (80) | 51 (45) | 52 (46) | 51 (45) | 64 (57) | 65 (58) | 42 (37) | 59 (52) | 68 (60) |
| P-value | 0.598 | 0.274 | 0.487 | 0.717 | 0.311 | 0.311 | 0.587 | 0.007 | 0.858 |
Distribution of Virulence Genes in Antibiotic Resistance Patterns of Escherichia coli Isolates
5. Discussion
As known, E. coli is the cause of 80 - 90% of community-acquired UTIs and 30 - 50% of nosocomial UTIs (27). One of the important factors involved in the pathogenesis of E. coli is the production of biofilms. Biofilm formation in E. coli can contribute to bacterial adhesion and colonization in the host urinary tract. Bacteria cause many infections by forming biofilms, which are difficult to treat because they increase resistance to antibiotics by producing biofilms (28-30). In our study, Congo red agar biofilm formation was observed in 78% of the isolates, which was also studied by Poursina et al. (80%), Katongole et al. (78%), Sudheendra and Basavaraj (71%), Poovendran and Ramanathan (79%), and Neupane et al. (69%) (16, 31-34). Besides, Tajbakhsh et al. (61%) and Niveditha et al. (56%) reported a lower prevalence of biofilm formation, and Ponnusamy et al. reported a 100% prevalence of biofilm formation (5, 35, 36). Differences in biofilm formation can be due to reasons such as the low level of hygiene, differences in geographical areas, study time, increased antibiotic resistance, and differences in the sources of sample isolation.
Examining the effective factors in the formation of bacterial biofilms can help treat infections caused by bacteria (33, 37). Various studies have shown that the bacteria that make up the biofilm protect the bacteria against the penetration of antibiotics due to the structure of the extracellular polymer matrix. In our study, isolates associated with biofilm formation had significant resistance to antibiotics used, such as ampicillin (85%), tetracycline (69%), cotrimoxazole (66%), ceftizoxime (64%), ceftriaxone (53%), aztreonam (61%), nalidixic acid (59%), ciprofloxacin (52%), cefotaxime (50%), and amikacin (0%). The results of our study showed that E. coli isolates with biofilm production ability were associated with increased resistance to various antibiotics, which is consistent with studies conducted in different parts of Iran and the world (5, 38, 39). It seems that the arbitrary use of antibiotics without a doctor's prescription and the availability and the absence of any law prohibiting the use of over-the-counter antibiotics in patients can be important factors in antibiotic resistance in different communities. These findings underscore the need to regulate the use of antimicrobials and institutionalization of antimicrobial stewardship programs in hospitals to limit the spread of resistant microorganisms (40, 41).
Extraintestinal pathogenic E. coli (ExPEC) isolates contain virulence factors such as fimbriae, toxins, iroN acquisition systems, and invasive factors that provide conditions for bacterial pathogenicity. The identification of UPEC virulence genes can be helpful in our understanding of the pathogenicity of the bacterium and minimizing the complications of bacterial infections. There have been many studies on genes involved in E. coli pathogenesis (42).
In this study, the prevalence of viral genes involved in UPEC was investigated by the PCR method. The highest prevalence of virulence genes was related to the fimbriae fimH virulence gene with 93% frequency and iutA virulence gene with 90% frequency, followed by traT (88.9%), ompT (88.2%), PAI (77.8%), aer (62.5%), iha (59.7%), cnf1 (41.7%), hlyA (34.7%) virulence genes, while iroN had the lowest prevalence with a frequency of 32.6%. The results of this study are similar to other previous studies (20, 21, 23, 43-45). Our study results indicated that E. coli strains with a high prevalence of bacterial virulence factors can be major causative agents for UTIs in humans in Yasuj (Iran). Given the prevalence of virulence genes in previous studies, it can be concluded that the variation in virulence genes of E. coli is due to differences in the isolation of UPEC strains in different geographical regions and the difference in the number of samples (9). The relationship between virulence genes and antibiotic resistance is complex. In this study, FimH, iha, aer, PAI, and iutA genes were observed in more-resistant isolates, and a significant relationship was observed between some virulence genes and antibiotics ceftriaxone, cefotaxime, aztreonam, ciprofloxacin, and nalidixic acid, which was consistent with previous studies (46, 47) (Table 6).
In this study, the prevalence of virulence genes in biofilm-forming strains was determined. Our findings were consistent with the results of previous studies (26, 38, 48, 49). It seems that examining the effective factors in the formation of bacterial biofilms can help treat infections caused by bacteria. We found that E. coli isolates capable of forming strong-to-moderate biofilms had a high prevalence of virulence genes, which may indicate the role of virulence factors in the development of biofilm formation. In our study, a significant relationship was observed between the strains of biofilm formation and resistance to ampicillin (P = 0.020) and cotrimoxazole (P = 0.038) antibiotics. In this study, biofilm formation was significantly associated with the cnf1 virulence gene, but no significant relationship was observed with other virulence genes. The results of this study showed that these virulence genes in E. coli strains were not alone in determining the biofilm formation ability, but other factors such as environmental and genetic factors may affect biofilm formation (50). Similar studies were conducted by Naves et al., Tabasi et al., and Katongole et al. (16, 49, 51).
In this study, based on the method proposed by Clermont et al. (19) in 2000, we investigated the phylogenetic analysis of E. coli strains. Using Triplex PCR, E. coli strains can be divided into four groups: (1) B2, (2) D, (3) A, and (4) B1. Based on the results of this study, 73.6, 15.9, 5.5, and 4.86% were in groups B2, D, B1, and A, respectively. Uropathogenic E. coli strains mostly belonged to group B2 and to a lesser extent to group D. In this study, the distribution of virulence genes among the phylogenetic groups of E. coli was investigated. The prevalence of virulence genes belonging to group B2 was higher than that of other phylogenetic groups. The highest frequency of pathogenic genes in group B2 was related to fimH (94%), iutA (92%), ompT (90%), traT (89%), PAI (76%), aer (69%), iha (62%), cnf1 (41%), hlyA (34%), and iroN (31%). A significant correlation was observed between E. coli phylogenetic groups and aer (P = 0.019), iroN (P = 0.042), and ompT (P = 0.032) virulence genes (Table 3). The findings of our study were consistent with other studies. The high prevalence of fimbriae genes, iron acquisition receptors, and toxins in group B2 indicates the high pathogenic potential of these isolates as extraintestinal isolates (52-55).
A limitation of this study is that some of the virulence genes studied were involved in the formation of bacterial biofilms (including gelatinase formation and hemagglutination), and the selected community for the study was from a particular geographic region.
5.1. Conclusions
The results of this study showed that the frequency of virulence genes in the biofilm-forming strains was high. Also, strains that showed biofilm formation ability had higher resistance to antibiotics than strains without biofilm formation ability. Given the clinical importance of these virulence factors in the development and progression of UTIs and the role of biofilm formation in increasing bacterial resistance to antibiotics, the results of this study may help in the management of urinary tract infections and better medical interventions in this geographical area.
