


1. Background
Human T-cell lymphotropic virus type 1 (HTLV-1) is an oncogenic retrovirus (family Retroviridae, subfamily Orthoretrovirinae, genus Deltaretrovirus) (1, 2). Mother-to-child transmission during breastfeeding, sexual transmission, and transmission through contaminated blood are responsible for acquired HTLV-1 infection (3-6). Japan and Iran in Asia and Romania in Europe have a high prevalence of HTLV-1 (7). In addition, the virus is prevalent in African countries (such as South America), Caribbean regions, and immigrant populations settled in North America and Western Europe. Notably, Australia and Melanesia are other reported regions for a prevalence of HTLV-1 (7). HTLV-I-associated myelopathy/tropical spastic paraparesis (HAM/TSP) and adult T-cell leukemia/lymphoma (ATLL) are the main disorders of the virus. However, a growing body of evidence indicates the involvement of HTLV-1 in other human diseases, such as uveitis, polymyositis, arthropathy, and sicca syndrome (8).
ATLL cells affect multiple human tissues, including hematopoietic/lymphoid, skin, spleen, lung, liver, central nervous system, cardiac, and valve tissues, constantly expressing CC chemokine receptor 4, forkhead box P3, and typical markers (1, 9). Cytokines are defensive agents expressed in response to infection, immune responses, and inflammation. Some cytokines have pro-inflammatory functions, whereas others are anti-inflammatory agents (10). In addition, chemokines are molecules mostly known for their ability to trigger the migration of various immune cells (1). The chemokines are able to activate the anticancer activity of leukocytes. A number of studies evaluated the antitumor activity of many chemokines (11). Human T-cell lymphotropic virus type 1 trans-activator x (Tax) and HTLV-1 basic leucine zipper factor (HBZ) viral proteins stimulate cellular transformation and ATLL development by modifying cell proliferation and anti-apoptosis effects in infected CD4+ T cells (12). During ATLL pathogenesis, infiltration of HTLV-1 infected T cells in different tissues is regulated by several cytokines and chemokines (13, 14).
2. Objectives
The current study aimed to investigate the expression profiles of C-C motif chemokine ligand 3 (CCL3), C-C motif chemokine ligand 4 (CCL4), C-X-C motif chemokine ligand 8 (CXCL8) (inflammatory chemokines), interleukin 23 subunit alpha (IL-23A), and interleukin 17 A (IL-17A) (pro-inflammatory cytokines) from blood samples to reach a better understanding of the possible association between inflammatory factors and HTLV-1–associated ATLL development. The investigation included ATLL, asymptomatic carriers (ACs), and normal control groups in Iran.
3. Methods
3.1. Patients and Sample Collection
The current study was performed from May 2021 to August 2022. The ATLL samples were collected from the oncology wards of Imam Khomeini, Shariati, and Imam Hossein hospitals, in Tehran, Iran. The study sample size was determined based on the HTLV-1 prevalence rate. The ATLL diagnosis process was performed according to the World Health Organization diagnosis guidelines. An oncologist initially diagnosed ATLL patients based on clinical symptoms and laboratory parameters. In the next step, blood samples were collected after determining the cancer stage. This group of patients was newly-diagnosed in the early stage of cancer and had been referred to hospital oncology centers due to the clinical manifestation. It should be mentioned that the interval between ATLL diagnosis and measurements was homogenous between all included ATLL patients with the same condition.
Furthermore, the HTLV-1 ACs and normal control samples were collected from blood donors referred to blood transfusion centers in Tehran and Alborz provinces, Iran. About 6 mL of blood sample was isolated in EDTA anti-coagulant sterile tubes. After blood sampling, the samples were immediately transferred to the virology laboratory by maintaining the cold chain conditions to confirm the infection. It should be mentioned that each participant completed a consent form. The ATLL, ACs, and normal control samples were screened by an enzyme-linked immunosorbent assay (ELISA; Dia.Pro, Italy) to detect antibodies against the HTLV-1 gp46-I, gp46-II, and gp21-I antigens. The presence of the viral genome was confirmed by polymerase chain reaction (PCR).
Inclusion criteria in ATLL, ACs, and normal control groups were male and female subjects without coinfection with HIV, hepatitis C virus (HCV), and hepatitis B virus (HBV). The individuals that suffered from other malignancies and genetic syndromes were excluded. In addition, participants with blood disorders, such as hemophilia and thalassemia, were excluded from the study. Participants with an inflammatory disease in the ACs and normal control groups were excluded. The prescription records were considered before admission. In ATLL, ACs, and normal control groups, subjects who received specific chemotherapy were excluded. The samples were randomly collected to prevent the risk of bias.
3.2. RNA Extraction and Complementary DNA Synthesis
The blood samples were used for red blood cell (RBC) lysis buffer and lymphocyte isolation by gradient centrifugation. The total RNA extraction was performed by an RNJia RNA kit (ROJE, Iran) according to the manufacturer's protocol. Quality control (QC) of the extracted RNA was assessed by a NanoDrop spectrophotometer. After the QC process, the extracted RNA was used to synthesize complementary DNA (cDNA). According to the manufacturer's protocol, random hexamer and oligo dT primers were used for cDNA synthesis using an RT-ROSET cDNA synthesis kit (ROJE, Iran). In addition, 1 µg of the synthesized cDNA was kept at -20°C for the semi-quantitative real-time PCR.
3.3. Semi-quantitative Real-time Polymerase Chain Reaction
Real-time PCR was used to determine the expression levels of CCL3, CCL4, CXCL8, IL-23A, and IL-17A messenger RNA (mRNA) using the target-specific primers and SYBR green master mix (Yekta Tajhiz Azma, Iran). Primers were designed using Gene Runner version 5.0.63, and their sequences (SinaClon, Iran) are available in Table 1. The optimum annealing temperature was 30 seconds, and the extension time was 30 seconds at 72°C, repeated in 40 cycles. Rotor-Gene QIAGEN Corbett was applied for the thermocycling procedure. Ribosomal protein lateral stalk subunit P0 (RPLP0) internal control was employed in real-time PCR. The data were processed based on the standard curve to increase relative real-time PCR efficiency.
| Gene | (5´-3') | Melt Temp | Amplicon Size |
|---|---|---|---|
| CCL3 | 169 | ||
| Forward | ACTTGCTGCTGACACGCC | 58.8 | |
| Reverse | CCACTCCTCACTGGGGTCA | 58.9 | |
| CCL4 | 105 | ||
| Forward | TAGCTGCCTTCTGCTCTCCA | 58.1 | |
| Reverse | CCACAAAGTTGCGAGGAAGC | 57 | |
| CXCL8 | 238 | ||
| Forward | GGCAGCCTTCCTGATTTCTGC | 58.9 | |
| Reverse | CACAACCCTCTGCACCCAGTT | 60 | |
| IL-23A | 154 | ||
| Forward | TGAGGGTCACCACTGGGAGA | 60 | |
| Reverse | ACTCAGGGTTGCTGCTCCAT | 59 | |
| IL-17A | 123 | ||
| Forward | CCGCAATGAGGACCCTGAGA | 59.2 | |
| Reverse | TCTTGCTGGATGGGGACAGAG | 58.9 | |
| RPLP0 | 164 | ||
| Forward | GACAAAGTGGGAGCCAGCGA | 60.1 | |
| Reverse | ACACCCTCCAGGAAGCGAGA | 60.5 |
The List of Target-Specific Primers
3.4. Statistical Analysis
The normality of variables, including age, gender, and gene expression, was assessed by the Kolmogorov-Smirnov test, and the spearman in the non-parametric distributions correlation test was used to assess the correlation of quantitative variables. To compare the distribution of inflammatory chemokines and pro-inflammatory cytokines between 3 groups, Kruskal-Wallis and Dunn multiple comparison tests were used. Also, the ordinal multiple logistic regression was used for the association between the expression of the inflammatory factors and ATLL, ACs, and control groups. The GraphPad Prism version 8.0.2.263 was used for data processing. P values less than 0.05 were considered statistically significant.
4. Results
4.1. Demographic Data
The mean age based on the year of the 3 groups was as follows: Normal controls, 59.9 ± 3.1 years; ACs, 47.3 ± 10.24 years; ATLL patients, 53.2 ± 7.32 years. There were no significant differences in the ages of the groups. Furthermore, 10 (100%) of normal controls, 8 (80%) of ACs, and 9 (90%) of ATLL patients were male. Demographic data are shown in Table 2.
| Variables | ATLL (N = 10) | ACs (N = 10) | Normal Controls (N = 10) | P Value |
|---|---|---|---|---|
| Gender | 0.125 | |||
| Male | 9 (90) | 8 (80) | 10 (100) | |
| Female | 1 (10) | 2 (20) | 0 (0) | |
| Mean age (y) | 53.2 ± 7.32 | 47.3 ± 10.24 | 59.9 ± 3.1 | 0.025 |
| Surgery | 7 (70%) | 0 (0) | 0 (0) | 0.000 |
| Hospitalization | 7 (70%) | 0 (0) | 0 (0) | 0.000 |
| Coinfection (HIV, HBV, HCV) | 0 (0) | 0 (0) | 0 (0) | - |
| Ethnic background | - | |||
| Iranian | 10 (100) | 10 (100) | 10 (100) | |
| Other | 0 (0) | 0 (0) | 0 (0) | |
| Tattooing | 6 (60) | 0(0) | 0(0) | 0.000 |
| Background disease (other malignancies, genetic syndrome, hemophilia, thalassemia) | 0 (0) | 0 (0) | 0 (0) | - |
Demographic and Clinical Features of Participants a
4.2. Genes’ Expression Profiles Using the Kruskal-Wallis Test
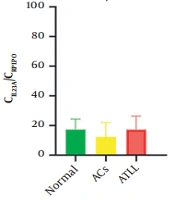
Regarding genes’ expression profiles, a significant difference was found in CCL3 (P = 0.0089), CCL4 (P = 0.0015), CXCL8 (P < 0.0001), and IL-17A (P < 0.0001) expression levels between groups. The mean ± SD expression of CCL3 was as follows: Normal controls, 0.27 ± 0.42; ACs, 0.52 ± 1.31; ATLL, 1.77 ± 2.34. The mean ± SD expression of CCL4 was as follows: Normal controls, 0.04 ± 0.08; ACs, 0.33 ± 0.58; ATLL, 0.53 ± 0.46. The mean ± SD expression of CXCL8 was as follows: Normal controls, 0.01 ± 0.03; ACs, 1.24 ± 1.68; ATLL, 25.36 ± 36.17. However, the mean ± SD expression of IL-17A was 0.02 ± 0.04 in normal controls, 0.67 ± 1.22 in ACs, and 1.80 ± 1.78 in ATLL patients (Table 3 and Figure 1).
| Gene | Normal Controls | ACs | ATLL | P Value |
|---|---|---|---|---|
| CCL3 | 0.27 ± 0.42 | 0.52 ± 1.31 | 1.77 ± 2.34 | 0.0089 |
| CCL4 | 0.04 ± 0.08 | 0.33 ± 0.58 | 0.53 ± 0.46 | 0.0015 |
| CXCL8 | 0.01 ± 0.03 | 1.24 ± 1.68 | 25.36 ± 36.17 | < 0.0001 |
| IL-23A | 0.72 ± 0.76 | 1.03 ± 2.38 | 3.47 ± 7.28 | 0.3263 |
| IL-17A | 0.02 ± 0.04 | 0.67 ± 1.22 | 1.80 ± 1.78 | < 0.0001 |
Cellular Expression Levels in Normal Controls, Asymptomatic Carriers, and Adult T-cell Leukemia/Lymphoma Groups Using the Kruskal-Wallis Test a
 C-C motif chemokine ligand 4; (B) C-X-C motif chemokine ligand 8; (C) interleukin 23 subunit alpha; (D) interleukin 17 A; and (E) in normal controls, asymptomatic carriers, and adult T-cell leukemia/lymphoma individuals.")
The expression levels of C-C motif chemokine ligand 3 (A) C-C motif chemokine ligand 4; (B) C-X-C motif chemokine ligand 8; (C) interleukin 23 subunit alpha; (D) interleukin 17 A; and (E) in normal controls, asymptomatic carriers, and adult T-cell leukemia/lymphoma individuals.
4.3. Genes’ Expression Profiles Using the Dunn Multiple Comparison Test
The Dunn multiple comparison test was used to compare pairwise, and a significant difference was found between ACs vs ATLL patients: CLL3 (P = 0.0123) and normal controls vs ATLL: CCL4 (P = 0.0009) and CXCL8 (P < 0.0001). Notably, IL-17A expression has a significant difference in normal controls vs ATLL (P < 0.0001) and normal controls vs ACs (P = 0.0412; Table 4 and Figure 1).
| Gene | Normal Controls | ACs | ATLL | Summary | P Value |
|---|---|---|---|---|---|
| CCL3 | - | 0.52 ± 1.31 | 1.77 ± 2.34 | * | 0.0123 |
| CCL4 | 0.04 ± 0.08 | - | 0.53 ± 0.46 | *** | 0.0009 |
| CXCL8 | 0.01 ± 0.03 | - | 25.36 ± 36.17 | **** | < 0.0001 |
| IL-17A | 0.02 ± 0.04 | 0.67 ± 1.22 | 1.80 ± 1.78 | **** | < 0.0001 (Normal controls vs ATLL) |
| * | 0.0412 (Normal controls vs ACs) |
Cellular Expression Levels in Normal Controls, Asymptomatic Carriers, and Adult T-cell Leukemia/Lymphoma Groups Using the Dunn Multiple Comparison Test a
4.4. Spearman in Non-parametric Correlation Analysis
A correlation investigation was performed to find possible associations. There was no remarkable correlation between evaluated genes in the ACs group. However, in the ATLL group, significant correlations were seen between CCL3 and IL-8 (0.09).
4.5. Ordinal Multiple Logistic Regression
As shown in Table 5, using ordinal multiple logistic regression, there was a significant association between CXCL8 and ATLL or ACs. Thus, the upregulation of CXCL8 increased the odds ratio (OR) of ATLL or ACs (OR, 2.35; 95% CI, 1.08 - 5.10); other factors, including IL-23A, CCL3, CCL4, and IL-17A, did not have a significant independent effect on ATLL.
| Variables | OR | 95% CI | P Value |
|---|---|---|---|
| CCL3 | 0.70 | 0.30 to 1.65 | 0.426 |
| CCL4 | 1.81 | 0.20 to 16.78 | 0.596 |
| CXCL8 | 2.35 | 1.08 to 5.10 | 0.032 |
| IL-23A | 1.00 | 0.64 to 1.54 | 0.985 |
| IL-17A | 2.47 | 0.70 to 8.67 | 0.159 |
Association Between Expression Levels with Adult T-cell Leukemia/Lymphoma Using Ordinal Multiple Logistic Regression
5. Discussion
Immune system regulators (such as cytokines and chemokines) play crucial roles in HTLV-1-associated ATLL pathogenesis (2). In the current study, we measured the mRNA expression level of inflammatory chemokines and pro-inflammatory cytokines in HTLV-1-associated ATLL patients, HTLV-1 ACs, and normal controls. Following the HBZ and Tax viral proteins’ activity, the HTLV-1–infected T-cells become immortalized. Several cytokines and chemokines induce the infected cells’ proliferation (15, 16). Our results showed that the expression levels of CCL3, CCL4, CXCL8, IL-23A, and IL-17A were upregulated in ACs and specially ATLL patients. CCL3 and CCL4 are inflammatory chemokines because of their chemotactic effects on monocyte and lymphocytes in inflammatory tissues (17, 18). CCL3 can regulate the hematopoietic stem cells’ proliferation in the bone marrow (19).
Several studies have demonstrated that CCL3 involves different types of leukemia pathophysiology (20). During HTLV‐1 infection, T helper type 1 (Th1) is the major lymphocyte that highly expresses the interleukin 6 (IL-6), interferon γ (IFN‐γ), tumor necrosis factor α (TNF‐α), CCL3, and CCL4 (21). HTLV-1 induces the production of different chemokines, such as CXCL10, CXCL8, CCL2, CCL3, CCL4, CCL5, and CCL225, in vitro and infect the patient’s cells (22). Our study proved the upregulation of CCL3 and CLL4 in the ACs and ATLL groups. However, the expression rate was significantly higher in ATLL patients than in ACs. High levels of CCL3 and CCL4 expression have been documented in tumor-infiltrating lymphocytes (23). Human T-cell lymphotropic virus type 1 Tax protein enriches the surface of CCL3 and CCL4 in ATLL lymphocytes (23, 24). Upregulation of CCL3 and CCL4 chemokines induces ATLL tissue infiltration through integrin-dependent adhesion to the endothelium (1, 23).
IL-8 or CXCL8 is a CXC-type chemokine with a chemoattractant effect. C-X-C motif chemokine ligand 8 binds to CXC motif chemokine receptors 1 and 2 on malignant cells (25, 26). Leukemic cells interact via CXC motif chemokine ligand 8 and cell-matrix interactions, contributing to leukemogenic development (27). The CXCL8 expression rate was investigated in the T cells of ATLL patients. HTLV-1 Tax transactivates the CXCL8 in collaboration with nuclear factor-κB (NF-κB) in HTLV-1-contaminated cells (28). CXCL8 has a potential role in HTLV-1-associated ATLL pathogenesis, and its expression increased in ATLL cells (28, 29). In the current study, CXCL8 mRNA expression significantly increased in the ACs and ATLL groups. High expression levels of CXCL8 in ATLL patients could be related to inflammation. Meanwhile, neutrophils are the major origins of CXCL8 and CCL4, which have similar expression patterns in infected and healthy cases (30). IL-23 is a pro-inflammatory mediator induced by macrophages, monocytes, and dendritic cells as antigen-presenting cells (31). In our study, IL-23A was upregulated in ATLL patients. However, this upregulation was not significant. A recent study reported that ascorbic acid upregulates IL-23R, a critical gene in Th17 differentiation, and supporting therapeutic use for ATLL. In addition, IFN-β significantly modified the IL-23R expression during ATLL treatment (32).
IL-17A is a member of the IL-17 family, a class of proteins with a conserved C-terminus, which has a crucial function in host defense against different microbial pathogens and tissue inflammation (33). The HTLV-1 Tax could upregulate IL-17. The expression of Tax and IL-17 in infected lymphocytes (34) could facilitate the production of additional inflammatory chemokines (35). The activation of IL-17 pathways in HTLV-1 infection depends on Tax activity, interferon regulatory factor 4, and cyclic adenosine monophosphate (AMP) response element-binding protein/activating transcription factor (CREB/ATF) (36). Possible anti-leukemic and anti-proliferative roles of the IL-17 family were evaluated in ATLL patients (32). IL-17C is the only member of the IL-17 family with a significant anti-proliferative role in the immunotherapeutic approach (32). In our study, expression levels of IL-17A mRNA were investigated. Our results showed a significant increase in IL-17A mRNA levels in ATLL patients. This finding is inconsistent with the results of Subramanian et al. (32), who reported that IL-17A did not express in ATLL-like cells. Our results are also inconsistent with the results of Kagdi et al. (37), who reported most cytokines’ expression in non-leukemic cells. Regarding HTLV-1 infection treatment, resveratrol blocks NF-κB and downregulates the IL-17 level (34).
5.1. Conclusions
A significant overexpression level of inflammatory cytokines and chemokines mRNAs in HTLV-1–associated ATLL were compared to ACs and normal control groups. This finding could reveal new insight into the follow-up of these factors in ATLL patients and the use of anti-inflammatory therapeutic procedures in ATLL patients. The limitation of the current study is its approach, which evaluated mRNA expression levels. Thus, further studies are needed on protein evaluation.
