


1. Background
With the first reports of an epidemic of pneumonia in China and the identification of a novel beta coronavirus, Severe Acute Respiratory Syndrome Coronavirus 2 (SARS-CoV-2), as the cause of Coronavirus Disease 2019 (COVID-19), many studies have been conducted on the interaction between this virus and the human immune system (1). Epidemiological and clinical studies indicate that infected individuals progress through four symptomatic stages: asymptomatic, mild, moderate, and severe. The last two stages require hospitalization in a specialized ward (2). Immune cell defects, especially in lymphocytes and neutrophils, correlate with the pro-inflammatory cytokine storm associated with disease severity (3).
The main subtypes of T lymphocytes include T-helper type 1 (Th1), T-helper type 2 (Th2), and T-helper type 17 (Th17) (4). Cytokines and transcription factors play crucial roles in the development of T-helper cell lineages. For instance, Th2 cell development requires interleukin (IL)-4, IL-5, and the transcription factor GATA-3 (GATA-binding protein-3). Additionally, Th17 cell development relies on IL-6, IL-21, and IL-23, along with retinoic acid-related orphan receptor (ROR)-γt and signal transducer and activator of transcription 3 (STAT3). Conversely, T-bet is a Th1-specific transcription factor essential for CD8 and NKT cell function (5). Th1 responses and the clearance of SARS-CoV-2 require a combination of IL-12 and interferon-gamma (IFN-γ) cytokines. Together with macrophages, B cells, NK cells, and CD8+ T cells mediate the immune response to infection (5, 6). However, Th17 responses may also contribute to lung injury and mortality in COVID-19 by stimulating Th2 responses and suppressing Treg cells (7). Moreover, the number of peripheral blood CD8+ T cells decreases in COVID-19 patients, which may facilitate greater viral replication and faster spread (8).
2. Objectives
In the current study, we evaluated the frequency of T cell subtypes and the levels of related serum cytokines in moderate and severe COVID-19 patients.
3. Methods
3.1. Inclusion and Exclusion Criteria
All patients were confirmed as COVID-19 positive for the SARS-CoV-2 virus at the time of admission using real-time reverse transcriptase polymerase chain reaction (RT-PCR) based on nasal and pharyngeal swabs (NPS), following the world health organization (WHO) guidelines (9). Moderate and severe COVID-19 patients were categorized based on national guidelines (10). This study enrolled 46 COVID-19 patients (30 severe and 16 moderate) and 13 healthy controls (HCs) of similar age and sex between August and December 2022 in Tehran, Iran. None of the participants had received COVID-19 vaccines. Exclusion criteria included the presence of hematological diseases, such as chronic myeloid leukemia (CML) or chronic lymphocytic leukemia (CLL), individuals undergoing blood transfusions, patients with immunodeficiency, and individuals who had received the vaccine.
3.2. Data Collection
Upon admission to the hospital, COVID-19 patients underwent hematological and biochemical blood tests, including a complete blood count (CBC) and serum biochemical parameter evaluation. Three milliliters of whole blood were collected in tubes containing ethylenediaminetetraacetic acid (EDTA) as an anticoagulant for the assessment of immune cell phenotypes using flow cytometry (FACS-Calibure, BD Biosciences, San Diego, CA, USA). An additional 2 mL of whole blood was collected in tubes without anticoagulants for serum cytokine determination.
3.3. Isolation of Peripheral Blood Mononuclear Cells (PBMCs) and Flow Cytometry
Following the acquisition of informed consent, 3 mL of whole blood was collected from each participant using tubes containing ethylene-diamine-tetra-acetic acid (EDTA) as an anticoagulant. Subsequently, the collected blood samples underwent the separation of PBMCs based on their density through centrifugation over lymphoprep (Ficoll-Paque, BAG Health Care GmbH, Germany, Cat No: 70125) (11), with a specific density of 1.076 g/mL, for the analysis of T cell subtypes. An additional 2 mL of whole blood was harvested in tubes without anticoagulants to determine serum levels of IL-5, IL-6, IL-2, and IFN-γ by ELISA (R&D Systems, Minneapolis, MN, USA). Clinical history, laboratory analyses, previous diseases, and comorbidities were reviewed from medical records.
Surface and intracellular markers of T cell subsets (Th1, Th2, Th17, cytotoxic T lymphocyte (CTL)) were evaluated among isolated PBMC cells as previously described (12, 13). For surface staining, after cell counting, 5x10⁵ cells were seeded into FACS staining buffer (PBS 1x, Sodium azide 0.01%, and BSA 1%) with antibodies for 30 min at 4°C. For intracellular staining, cells (1 × 10⁶) were incubated with 1x fixation and permeabilization solution (BD Biosciences, San Diego, USA) for 15 min at 4°C. Subsequently, the cells were washed with cold PBS 1X, and intracellular staining was performed by adding the relevant antibody for 30 min at 4°C. Ten thousand events were captured using FACS Calibur (BD Biosciences) and analyzed using FlowJo Software version 10 (BD Biosciences, San Diego, USA).
The concentrations of serum IL-2, IL-5, IL-6, and IFN-γ were measured using an enzyme-linked immunosorbent assay (ELISA) kit (R&D Systems, Minneapolis, MN, US) following the manufacturer’s instructions. The IL-2 Quantikine ELISA Kit had a sensitivity of 7 pg/mL and specificity for Natural recombinant human IL-2, with an assay range of 31.2 - 2 000 pg/mL. The IL-5 Quantikine ELISA Kit had a sensitivity of 1.08 pg/mL and specificity for Natural recombinant human IL-5, with an assay range of 3.9 - 250 pg/mL. The Human IL-6 Quantikine ELISA Kit had a sensitivity of 0.7 pg/mL and specificity for Natural recombinant human IL-6, with an assay range of 3.1 - 300 pg/mL. The Human IFN-γ Quantikine ELISA Kit had a sensitivity of 5.69 pg/mL and specificity for Natural recombinant human IFN-γ, with an assay range of 15.6 - 1,000 pg/mL.
3.4. Data Analysis
Data with a normal distribution were presented as mean ± standard deviation, while data with a non-normal distribution were expressed as median. To compare the two groups, either a T-test or Mann-Whitney U test was employed, depending on the data distribution, for comparisons involving more than two groups, a Kruskal-Wallis test with post-test analysis was conducted. The correlation between variables was assessed using a correlation matrix test. Receiver operation characteristic (ROC) curves were utilized to assess the ability of each variable to differentiate between patients and the HC group. The cut-off value for the diagnostic parameters and the area under the ROC curve (AUC) were determined based on the maximum Jordan index. A P-value < 0.05 was considered statistically significant for all tests. GraphPad Prism software (version 8.0.2) processed and analyzed all the data.
4. Results
4.1. Demographic Information of Patients with COVID-19 and Healthy Control Subjects
The mean age of patients across the study groups showed limited variation, with no significant differences observed between the groups. Patients with severe disease had an average age of 54.2 ± 14 years, those in the moderate group had an average age of 44.6 ± 12 years, and HCs had an average age of 39 ± 11 years.
4.2. Clinical Characteristics of COVID-19 Patients
Comorbidities, including diabetes, hypertension, and thyroid disease, were present in all severe cases and in 50% (8/16) of moderate cases (Table 1). Patients with severe disease exhibited a significantly higher incidence of fatigue, fever, and shortness of breath compared to those with moderate disease (Table 1). Additionally, 30% (12/30) of severe disease patients experienced fungal and bacterial infections, including Candida spp, Staphylococcus spp, and Pseudomonas, whereas HC and patients with moderate disease had no such infections (0/13 (0%) and 0/16 (0%), respectively). Blood analysis of severe patients revealed significant lymphopenia (P-value < 0.001) compared to moderate patients and significant eosinophilia (P-value < 0.01) compared to HC (Table 1). Patients with comorbidities exhibited a lower frequency of blood lymphocytes (P-value < 0.001) (Table 2). Furthermore, severe patients had significantly higher levels of hemoglobin A1C (A1C), cholesterol (Chol), triglycerides (TG), low-density lipoprotein (LDL), Ferritin, Lactate Dehydrogenase (LDH), Prothrombin time (PT), and C-reactive protein (CRP), as well as D-Dimer (P-value < 0.01). In contrast, albumin (ALB) and phosphorus (P) levels were significantly lower in severe patients compared to the moderate group (P-value < 0.01) (Table 3).
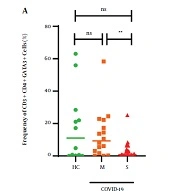
The gating strategy for determining the population frequencies of T cells, specifically CD4+T-bet+ cells, CD4+GATA3+ cells, CD4+RORγt+ cells, and CD8+T-bet+ cells representing Th1 cells, Th2 cells, Th17 cells, and CTLs, is illustrated in Figure 1. The median frequency of CD4+T-bet+ cells in the moderate group (2.3%) was higher than in the HC group (0.17%) and severe patients (0.47%), but this difference was not statistically significant (P > 0.05). The median frequency of CD4+GATA-3+ cells in patients with severe disease was significantly lower compared to the levels observed in the moderate COVID-19 and HC groups (0.69%, P-value < 0.05% and 9.3%, P-value > 0.05), respectively (Table 4 and Figure 2A).
| Variables | Healthy Controls | Moderate Group | P-Value of Moderate Group vs. Healthy Controls | Severe Group | P-Value of Healthy Controls vs. Severe Group |
|---|---|---|---|---|---|
| Diabetes | 2 (5) | 2 (12) | NS | 12 (40) | < 0.05 |
| Hypertension | 0(0) | 4 (25) | < 0.05 | 20 (66) | < 0.01 |
| Thyroid disease | 4 (10) | 4 (26) | NS | 8 (26) | NS |
| Fungi infection | 0 (0) | 0 | NS | 8 (26) | < 0.01 |
| Bacterial infection | 0 (0) | 0 | NS | 4 (13) | < 0.01 |
| Fever > 38.5°C | 0 (0) | 0 (0) | NS | 30 (100) | < 0.001 |
| Fatigue | 0 (0) | 8 (50) | < 0.05 | 27 (90) | < 0.05 |
| Cough | 0 (0) | 10 (~ 62) | < 0.05 | 28 (93) | NS |
| Shortness of breath | 0 (0) | 4 (26) | < 0.05 | 15 (50) | < 0.01 |
| Lymphopenia | 0 (0) | 5(32) | < 0.01 | 30 (100) | < 0.001 |
| Thrombocytopenia | 0 (0) | 3 (19) | NS | 12 (40) | < 0.05 |
| Neutrophilia | 0 (0) | 3 (19) | NS | 22 (75) | < 0.001 |
| Absolute count of white blood cells, mean × 109/L | 8.8 ± 1.03 | 8.2 ± 3 | NS | 8.9 ± 4 | NS |
| Neutrophil counts | 60 | 76 | NS | 87 | NS |
| Lymphocyte counts | 44 ± 4 | 22.12 ± 10 | < 0.05 | 12.2 ± 9 | < 0.05 |
| Eosinophil counts | 1 ± 0.2 | 1.3 ± 0.1 | NS | 1.9 ± 0.08 | < 0.01 |
| Variables | Patients without Comorbities | Patients with Comorbities | P-Value of Moderate Group vs. Severe Group |
|---|---|---|---|
| Number of patients | 23 (50) | 23 (50) | < 0.05 |
| Absolute count of white blood cells, mean × 109/L | 6.8 ± 0.6 | 4.38 ± 0.5 | < 0.05 |
| Lymphocyte counts, % | 32 ± 3 | 8.4 ± 1 | < 0.001 |
| Variables | Healthy Controls | Moderate Group | P-Value of Healthy Controls vs. Moderate Group | Severe Group | P-Value of Healthy Controls vs. Severe Group | P-Value of Moderate Group vs. Severe Group |
|---|---|---|---|---|---|---|
| A1C, % | 6.1 ± 0.9 | 7.1 ± 0.5 | < 0.05 | 9.65 ± 0.8 | < 0.01 | < 0.05 |
| ALB, g/dL | 4 ± 0.2 | 3.45 ± 0.27 | NS | 3.21 ± 0.34 | < 0.05 | < 0.05 |
| AST, U/L | 36 ± 5 | 43 ± 8.1 | NS | 64 ± 14.2 | < 0.05 | NS |
| Chol, mg/dL | 155 ± 23 | 173 ± 17 | NS | 238 ± 28 | < 0.05 | < 0.05 |
| CRP, mg/L | 4 ± 4.6 | 18 ± 6 | < 0.05 | 57 ± 10 | < 0.01 | < 0.01 |
| CPK, U/L | 129 ± 33 | 196 ± 18 | < 0.05 | 229 ± 18 | < 0.05 | NS |
| D-DIMER, mg/L | 120 ± 16 | 168 ± 20 | < 0.05 | 263 ± 35.8 | < 0.01 | < 0.01 |
| Ferritin, mg/L | 124 ± 35 | 190 ± 29 | < 0.05 | 290 ± 39 | < 0.05 | < 0.05 |
| HG, g/L | 133 ± 7 | 119 ± 3.2 | NS | 105 ± 7.4 | < 0.05 | NS |
| K, g/dL | 3.7 ± 0.3 | 4.1 ± 0.26 | < 0.05 | 4.6 ± 0.32 | < 0.05 | NS |
| LDH, U/L | 284 ± 59 | 363 ± 24 | NS | 539 ± 39 | < 0.05 | < 0.05 |
| LDL, mg/dL | 120 ± 23 | 140 ± 13 | NS | 196 ± 22 | < 0.05 | < 0.05 |
| MLR, % | 0.2 ± 0.03 | 0.3 ± 0.06 | NS | 0.36 ± 0.13 | < 0.05 | NS |
| NLR, % | 1.58 ± 0.3 | 1.68 ± 0.42 | NS | 2.93 ± 1.5 | < 0.05 | NS |
| O2 sat, % | 95 ± 5 | 79 ± 11 | NS | 58 ± 16 | < 0.05 | < 0.05 |
| P, g/dL | 3.5 ± 0.8 | 3.26 ± 0.43 | NS | 2.28 ± 0.32 | < 0.05 | < 0.05 |
| PLR, % | 113 ± 20 | 146 ± 26 | NS | 173 ± 45 | < 0.05 | NS |
| PT, s | 12.5 ± 0.5 | 13.2 ± 1.4 | NS | 22 ± 3.21 | < 0.05 | < 0.01 |
| TG, mg/dL | 163 ± 30 | 185 ± 11 | NS | 270 ± 33 | < 0.05 | < 0.05 |
Mean Serum Biochemical Values of Different Variables in Healthy Controls and COVID-19 Patients a

Flow cytometry analysis results. Lymphocytes were gated based on side and forward scatter, followed by the counting of CD4, CD8, Tbet, Gata3, RORgt, and other cell types, including CD4+T-bet+ cells, CD4+GATA3+ cells, CD4+RORgt+ cells, and CD8+T-bet+ cells.
| Variables | Healthy Controls (n = 13) | Moderate Group (n = 16) | P-Value of Healthy Controls vs. Moderate Group | Severe Group (n = 30) | P-Value Healthy Controls vs. Severe Group | P-Value of Moderate vs. Severe Cases | P-Value of MFI Healthy Controls & Moderate | P-Value of MFI Healthy Controls vs. Severe Group | P-Value of MFI Moderate and Severe Groups |
|---|---|---|---|---|---|---|---|---|---|
| CD4+Tbet+ | 0.17 (0 - 60) | 2.3 (0.01 - 37.8) | NS | 0.47 (0 - 26.5) | NS | NS | NS | NS | NS |
| CD4+GATA3+ | 11 (0.01 - 63) | 9.3 (0.07 - 58.3) | NS | 0.69 (0 - 25.2) | NS | < 0.01 | NS | NS | < 0.05 |
| CD4+ROR-γt+ | 18.4 (0.11 - 59.9) | 13.2 (0.4 - 43) | NS | 8.5 (0.4 - 30.7) | NS | NS | NS | NS | NS |
| CD8+Tbet+ | 4.8 (0 - 36.5) | 4.5 (0.09 - 16) | NS | 0.14 (0 - 4.4) | < 0.05 | < 0.001 | NS | < 0.05 | < 0.01 |
Frequencies of CD4+Tbet+, CD4+GATA3+, CD4+ROR-γt+, and CD8+T-bet+ T cells in the Healthy Control, Moderate, and Severe COVID-19 Cases
 cells and CD8+Tbet+ (B) cells in whole blood of COVID-19 patients. Values are presented as the median and 5 - 95% percentile, and comparisons were made between the healthy control and moderate and severe groups using the Mann-Whitney U test: HC (n = 13), moderate (n = 16), and severe (n = 30). * P < 0.05, ** P < 0.01, *** P < 0.001, and **** P < 0.0001. NS, non-significant.")
Frequencies of CD4+GATA3+ (A) cells and CD8+Tbet+ (B) cells in whole blood of COVID-19 patients. Values are presented as the median and 5 - 95% percentile, and comparisons were made between the healthy control and moderate and severe groups using the Mann-Whitney U test: HC (n = 13), moderate (n = 16), and severe (n = 30). * P < 0.05, ** P < 0.01, *** P < 0.001, and **** P < 0.0001. NS, non-significant.
The median frequency of CD4+ROR-γt+ cells in the moderate and severe groups was 13.2% and 8.5%, respectively, which was lower than in the HC group (P > 0.05, graph not shown). The median frequency of CD8+T-bet+ cells in the severe group was 0.14%, significantly lower than in the other groups (P < 0.01, Table 4 and Figure 2B).
In this severe COVID-19 patient cohort, we assessed the distribution of T cell subtypes by determining the optimal cut-off points for sensitivity and specificity using ROC curve analysis. The area under the curve (AUC) is a measure of the accuracy of diagnostic tests. The closer the ROC curve is to the upper-left corner of the diagram, where sensitivity equals 1, and the false-positive rate equals 0 (specificity equals 1), the better the test's accuracy. An ideal ROC curve has an AUC of 1.0. A guide for classifying the accuracy of a diagnostic test based on AUC values is as follows: an AUC between 0.9 and 1.0 indicates excellent discrimination ability, an AUC greater than 0.7 is considered good, and an AUC between 0.6 and 0.7 is deemed sufficient for test accuracy (14).
None of the T cell subsets significantly correlated significantly with progressive COVID-19 disease (Figure 3A). For CD4+Tbet+ cells, the calculated cutoff value was 0.58% (Figure 3), resulting in a sensitivity of 69% (CI: 54 to 81%) and specificity of 66.6% (CI: 39 to 86%). The optimal cutoff value for CD4+GATA3+ cells was 0.62%, and ROC curve analysis indicated a sensitivity of 63% (CI: 48 to 75%) and specificity of 58% (CI: 32 to 80%) when compared to the HC group (Figure 3A).
For CD4+Rorgt+ cells, the cutoff value was calculated to be 0.62% (Figure 3), resulting in a sensitivity of 57% (CI: 42 to 70%) and specificity of 69.6% (CI: 42 to 87%). As for CD8+ Tbet+ cells, the cutoff value was determined as 0.6%. ROC curve analysis indicated a sensitivity of 81.8% (CI: 68 to 90%) and specificity of 53.8% (CI: 29 to 76%) (Figure 3A). When combining CD4+Rorgt+ cells (AUC: 0.62) with Th2 (AUC: 0.62) in ROC analysis, it exhibited the highest sensitivity and specificity for identifying group differences (Figure 3A). No statistical difference was found with other combinations of cells (data not shown).
Furthermore, when comparing severe patient cases to moderate patient cases, the best cut-off value for CD8+Tbet+ cells was determined (AUC = 0.88%) with a Likelihood ratio of 3.3. At this cut-off value, ROC curve analysis yielded a sensitivity of 82.14% (CI: 64.14 to 92.2%) and a specificity of 75% (CI: 50.5 to 89.9%) (Figure 3B). For Th2 cells, the cutoff value was calculated at 2.93% (Figure 3B), resulting in a sensitivity of 73.3% (CI: 55.7 to 88.81%) and specificity of 75% (CI: 50.8 to 82.2%). The optimal cutoff value for CD4+Rorgt+ cells was 2.33%, and ROC curve analysis showed a sensitivity of 62.7% (CI: 44 to 77%) and specificity of 73.3% (CI: 48 to 89%) when compared to moderate patients (Figure 3B). For CD4+Tbet+ cells, the cutoff value was determined as 1.67%. ROC curve calculation revealed a sensitivity of 73.8% (CI: 53.5 to 86.4%) and specificity of 56% (CI: 33.9 to 76.11%) (Figure 3B). The combination of CD4+Gata3+ cells (AUC 0.78) and CTL (AUC 0.8) in ROC analysis also demonstrated the highest sensitivity and specificity for identifying group differences.
 analysis for healthy controls vs. COVID-19 Patients; B, ROC analysis for moderate vs. severe patients. To assess the diagnostic effectiveness of the measured parameters in predicting mortality, we compared sensitivities and specificities at the optimal cut-off values determined through ROC analysis between healthy controls and patients. The figure shows ROC curves of immune indices to discriminate between healthy controls and COVID-19 patients, showing the accuracy of lymphocytes, CD4+Tbet, CD4+GATA3+, CD4+RORgt+, and CD8+Tbet+ cells in predicting various outcomes.")
A, Receiver operator characteristic (ROC) analysis for healthy controls vs. COVID-19 Patients; B, ROC analysis for moderate vs. severe patients. To assess the diagnostic effectiveness of the measured parameters in predicting mortality, we compared sensitivities and specificities at the optimal cut-off values determined through ROC analysis between healthy controls and patients. The figure shows ROC curves of immune indices to discriminate between healthy controls and COVID-19 patients, showing the accuracy of lymphocytes, CD4+Tbet, CD4+GATA3+, CD4+RORgt+, and CD8+Tbet+ cells in predicting various outcomes.
Serum cytokine levels, including IL-2, IFN-g, IL-6, and IL-5, were assessed in the studied groups. Severe COVID-19 patients exhibited significantly lower serum levels of IFN-g and IL-2 and higher serum levels of IL-5 compared to the HC group (Table 5 and Figure 4, both P < 0.05). Additionally, in severe patients compared to moderate patients, there was a significantly lower level of serum IL-2 and a higher level of serum IL-6 (Table 5 and Figure 4, both P < 0.05).
| Cytokine, Pg/mL | Healthy Controls (n = 13) | Moderate Group (n = 16) | P value Healthy Controls vs. Moderate Group | Severe Group (n = 30) | P-Value Healthy Controls vs. Severe Cases | P-Value of Moderate Group vs. Severe Group |
|---|---|---|---|---|---|---|
| Interleukin -2 | 17.6 (14 - 21) | 11.3 (6 - 18) | < 0.001 | 8.3 (7 - 13.4) | < 0.001 | < 0.05 |
| Interleukin -5 | 5 (3 - 7) | 5.8 (0.2 -9.1) | NS | 7.33 (1.1 - 9) | < 0.05 | NS |
| Interferon-gamma (IFN-γ) | 7.4 (3 - 10) | 4 (1.4 - 14) | NS | 3.75 (1.3 - 8.2) | < 0.001 | NS |
| Interleukin -6 | 14.2 (9 - 19) | 71.6 (27 -85) | < 0.001 | 164.8 (4 - 717) | < 0.01 | NS |
Serum Cytokine Concentrations a
 and the moderate (n = 16) and severe (n = 30) patients were performed by the Mann-Whitney U test. *P < 0.05, ** P < 0.01, *** P < 0.001, and **** P < 0.0001. NS, non-significant.")
Cytokine levels in moderate and severe COVID-19 patients. Serum cytokine levels were assessed in the harvested serum of participants and analyzed by the ELISA method. A, IL-2 levels decreased in severe patients compared to healthy controls; B, IL-5 release significantly increased between healthy controls and the severe group; C, IFN-γ Levels significantly decreased between healthy controls and severe patients; D, IL-6 levels significantly increased between healthy controls and patients. Values are presented as the median and 5% - 95% percentile, and comparisons made between healthy controls (n = 13) and the moderate (n = 16) and severe (n = 30) patients were performed by the Mann-Whitney U test. *P < 0.05, ** P < 0.01, *** P < 0.001, and **** P < 0.0001. NS, non-significant.
5. Discussion
In this pilot study, we investigated the frequencies of T cell subsets and the related cytokine concentrations in both moderate and severe COVID-19 patients. Various mechanisms that may lead to the development of lymphopenia in COVID-19 patients have been documented in several studies. However, the exact causes of this phenomenon are not yet fully understood, although some reports suggest that it may be due to the direct infection of lymphocytes or the inhibition of bone marrow by the antiviral response. From a molecular immunology perspective, dysfunctional activation of dendritic cells and the presence of cytokines, such as IL-6, which act as negative regulators of proliferation, may also contribute to lymphopenia. Interestingly, a reverse correlation between neutrophil and lymphocyte counts has been observed in COVID-19 patients, suggesting that factors associated with the exacerbation of innate responses may trigger lymphopenia (15).
Our investigation revealed that the frequency of CD4+GATA3+ cells was significantly decreased in both hospitalized patient groups compared to the HC. Th2 cells play a major role in the induction and persistence of respiratory diseases. Interleukin 5 is one of the cytokines produced by T-helper cells, ILCs, and B-cells. IL5 has a major role in targeting eosinophils and their precursors (16).
In this pilot study, we investigated the frequencies of T cell subsets and the related cytokine concentrations in moderate and severe COVID-19 patients. Coronavirus infections in humans exhibit weak adaptive immune responses (17), which may be due to an insufficient T cell response for interacting with B cells and inducing antibodies (18). The dysregulation of T cells can be caused by various factors, such as the release of granulocytes like neutrophils and myeloid cells (19). Additionally, a positive correlation between neutrophils and acute-phase proteins (APPs) has been found in active viral infections. The production of APPs, such as ferritin and CRP, stimulates both pro and anti-coagulative pathways, leading to the induction of apoptosis in lymphocytes (20).
Although the number of T-helper 2 cells has decreased in hospitalized patients, the concentration of IL-5 has somewhat increased with the severity of the disease. Other sources of secretion of this interleukin may be involved. Moreover, increased levels of cytokines, such as IL-5, which can inhibit the inflammatory Th1 cells and leukocytes (21), were observed. In line with this, Huang et al.'s study showed that the serum level of IL-5 was increased in hospitalized COVID-19 patients (22).
To our knowledge, this is the first report that demonstrates an increased frequency of CD4+T-bet+ T cells in moderate COVID-19 patients, indicating that a longer duration of infection may exhaust T cells and reduce their numbers in severe patients. According to our data, we observed low frequencies of CD4+Tbet+ and CD4+RORgt+ T cells in the blood of ICU hospitalized patients. Th1 cells play a crucial role in combating intracellular pathogens, primarily secreting IFNγ and IL2. IFNγ is essential for activating macrophages to enhance their phagocytic activity, while Th17 cells are necessary to stimulate an immune response against extracellular bacteria and fungi (16). Moreover, the frequencies of blood CD4+ and CD8+ T cells were significantly reduced in ICU severe COVID-19 patients (23). This suggests a shift of cells from the systemic circulation to other organs, such as the respiratory system (24). ROC curve analysis for CTL (CD8+T-bet+) subtype in the current study shows a significant correlation with the severity of COVID-19. We observed a positive association between CD8+T-bet+ cells (AUC=0.8) and the severity of COVID-19. In line with this, earlier data has shown a strong link between CD8+ T cells and the severity of COVID-19 (25).
Cytokines, such as IL-6, IP-10, IL-4, and IL-13, may play important roles in the pathogenesis of COVID-19 (26-28). Additionally, there is a documented correlation between blood IL-5 and IL-6 levels with the severity of COVID-19 (29). Elevated IL-5 may indicate activation of type 2 immunity, which is commonly observed during inflammatory responses and fibrosis (30). IFN-γ, a type II IFN produced by natural killer (NK) cells and T lymphocytes, is crucial in immunological responses for antiviral defense (31). IFN-γ reduces virus replication and activates CTL-killing activity (32). However, persistently high levels of IFN-γ can increase tissue injury and organ failure (33). Like our study, several studies have observed distinct immunological dysfunction in moderate and severe disease, with reduced expression of IFN-γ by CD4+ T, CD8+ T, and NK cells (34). In contrast, some studies have reported increased concentrations of IFN-γ in COVID-19 patients compared to healthy controls (23).
Various cytokines present inside and around cells play a critical role in differentiating T helper cells into various subtypes. IFN-γ, for instance, plays a crucial role in shaping TH1 development and preventing TH2 differentiation, while IL-4 and IL-5 are essential for promoting TH2 proliferation and suppressing TH1 expansion. This delicate interplay between TH1 and TH2 cells influences disease outcomes by establishing a balance between them. This balance directly impacts the development of disorders and our susceptibility to diseases. In our study, we observed increased levels of IL-5 and IL-6, along with decreased levels of IFN-γ (TH1/TH2), which are responsible for reducing cell-mediated immunity and promoting the production of serum antibodies in COVID-19 patients. This suggests that their immune response may lean towards antibody-mediated effects rather than cell-mediated effects. Consequently, the decrease in lymphocyte counts observed in our study could indicate an imbalance in the TH1/TH2 ratio and an increase in B cell growth. The activation of IL-4 and IL-5-producing CD4+ T cells and the suppression of IFN-γ-producing CD4+ T cells by IL-6 may contribute to this imbalance.
On the other hand, TH1, mediated by IFN-γ, plays a role in specific defense mechanisms against antigens at the epithelial surface, which is associated with various inflammatory airway conditions. Studies have shown that IFN-γ also regulates the effectiveness of antigen presentation. Another reason for these differences in cytokine concentration may be related to the length of time the patients were hospitalized and the timing of sample collection, as observed in other chronic viral diseases where prolonged disease duration can lead to T cell exhaustion. However, to establish the validity of these signatures and genetic disparities, it is necessary to conduct a more extensive examination using a larger sample size. IL-2 is an essential cytokine for the proliferation and activation of T cells (35). However, in our study, we found a significant decrease in serum IL-2 in severe COVID-19 patients, which may suggest that the decreased frequency of T cells could result from insufficient IL-2 signaling (35).
Our study reveals that in severe patients, increased cytokines such as IL-5 and IL-6 indicate the dysregulation of the immune system. The type and levels of cytokines changed based on the time of analysis and the severity of the disease. However, several limitations were present in the current study, including a small number of patients due to a lack of funds and the arbitrary use of drugs by patients, leading to the exclusion of many patients from the study. Additionally, due to COVID-19-related public and hospital restrictions, we could not obtain the blood lymphocyte status of all patients after their release from the hospital. This study observed abnormalities in ALB, AST, CRP, and LDH levels in COVID-19 patients, in line with six previous studies (36).
5.1. Conclusions
In conclusion, we cannot make definitive conclusions due to the small sample size and limitations in equipment and financial resources in Iran. However, our study suggests that in moderate patients, the frequency of CD4+Tbet+ T cells increased among the investigated T cell subtypes. Conversely, with the severity of the disease, the blood frequency of these cells decreased. Accumulation of T lymphocytes typically leads to progressive inflammation of infected organs, and SARS-CoV-2 can infect lung epithelial cells and mobilize cytotoxic T cells in the lungs. While T cells contribute significantly to virus control in the lungs during early infection stages, persistent T cell cytotoxicity may also contribute to organ damage. Our data may suggest that as the disease severity increases, factors such as apoptosis or exhaustion reduce the frequency of T cell subtypes in the blood. Thus, the reduced frequency of CTL cells in the blood may correspond to the severity of COVID-19 disease, as observed in hepatitis and HIV infections (37).
