1. Background
Urinary Tract Infections (UTIs) are the most common infectious disease affecting both inpatients and outpatients at all ages (1). Uropathogenic Escherichia coli (UPEC) is responsible for more than 80% of UTIs (2). Escherichia coli isolates fall in four phylogenetic groups (A, B1, B2 and D); UPEC isolates belong mainly to group B2 and less frequently to group D (3). Multidrug resistance (MDR) to antibiotics is defined as resistance to three or more antibiotics from different classes (4). The high prevalence of the MDR phenotype has increased global public health concerns (5). The worldwide reported increase in resistance of E. coli to broad-spectrum antimicrobial agents represents a major threat (2), especially in Egypt, where there is a high prevalence of MDR phenotype among UPEC (6, 7).
Among the common bacterial antibiotic resistance mechanisms is the efflux of antibiotics outside the bacterial cell (8). Efflux pump systems are classified into five families: the ATP binding cassette (ABC) superfamily, the major facilitator superfamily (MFS), the Multidrug and toxic-compound extrusion (MATE) family, the small multidrug resistance (SMR) family and the resistance nodulation division (RND) family (9). The AcrAB-TolC pump that belongs to the RND family is the main efflux pump in E. coli clinical isolates (10). This pump is composed of an inner membrane transporter AcrB, periplasmic membrane fusion protein AcrA, and an outer membrane channel TolC (11).
Biofilm is the irreversible attachment of the cell with a surface, by an enclosed, attached polysaccharide matrix (12). Uropathogenic E. coli is one of the major causes of recurrent and persistent UTIs due to biofilm formation (13). The first step in biofilm formation is the production of curli protein that promotes the adhesion of bacterial cells to the solid surface (14). There is a reported correlation between biofilm formation and increase in resistance to antibiotics (15). Higher resistance to antibiotics is reported in bacteria enclosed in biofilms rather than in planktonic cells. The resistance mechanisms in biofilms involve the slow penetration of antibiotics through polysaccharide matrix of the biofilm; resistance gene transfer within the biofilm, which is higher than in planktonic cells; the higher expression of antibiotics’ efflux pumps in biofilms; the presence of persister cells that are not mutants, but resist the antibiotic; the slow growth rate and nutrient limitation that decreases antibiotic susceptibility (12, 16).
2. Objectives
The aim of the present study was to detect the prevalence of MDR phenotype, the ability for in-vitro biofilm formation, the detection of AcrAB-TolC pump main genes, and efflux-mediated resistance among UPEC clinical isolates from Egypt.
3. Methods
3.1. Bacterial Strains and Phylogenetic Grouping
The study was performed on a total number of 228 UTI clinical isolates from inpatients and outpatients. One hundred and 66 isolates were collected from the Mansoura university hospital (Dakhalia governorate), and 62 isolates were collected from Misr University for Science and Technology (MUST) hospital (Giza governorate) during the period between January 2014 to December 2015. All experiments in this study were conducted with approval of the ethical committee of Cairo University, Cairo, Egypt.
Identification of the isolates was done by Gram-staining, isolation on MacConkey agar (Oxoid, UK), and Eosin methylene blue (Oxoid, UK) (17). Genomic DNA was extracted from all tested isolates by the boiling lysis method and 1 µL of the extract was used in all PCR reactions (18). The molecular identification of E. coli was performed by the PCR amplification of uspA gene, in a final reaction volume of 20 µL, using primers (Macrogen, Korea) listed in Table 1, at a concentration of 0.5 µM, and My Taq™ Red Mix (Bioline, UK) (19). Multiplex PCR for detecting gadA, chuA, yjaA, and TSPE4.C2 DNA fragment was used to determine the phylogenetic group of each UPEC isolate, in a final reaction volume of 20 µL, using primers (Macrogen, Korea) listed in Table 1 at a concentration of 1 µM each, and My Taq™ Red Mix (Bioline, UK) (20). Escherichia coli ATCC 25922 was used as positive control in both PCR reactions.
| Target Gene | Primer | Primer Sequence (5' - 3') | Product Size, bp | Ta, °C | Reference |
|---|---|---|---|---|---|
| uspA | uspA-F | ccgatacgctgccaatcagt | 884 | 52 | (19) |
| uspA-R | acgcagaccgtaggccagat | ||||
| gadA | gadA-F | gatgaaatggcgttggcgcaag | 373 | 53 | (20) |
| gadA-R | ggcggaagtcccagacgatatcc | ||||
| chuA | chuA-F | atgatcatcgcggcgtgctg | 281 | ||
| chuA-R | aaacgcgctcgcgcctaat | ||||
| yjaA | yjaA-F | tgttcgcgatcttgaaagcaaacgt | 216 | ||
| yjaA-R | acctgtgacaaaccgccctca | ||||
| TspE4.C2 | tspE4.C2-F | gcgggtgagacagaaacgcg | 152 | ||
| tspE4.C2-R | ttgtcgtgagttgcgaacccg | ||||
| acrA | acrA-F | ggtcgttctgatgctctca | 1078 | 52 | (18) |
| acrA-R | ggcttgctggttattatcag | ||||
| acrB | acrB-F | cgtctaacagtgactccacgg | 2730 | 52 | |
| acrB-R | ttcaatcagacctttaccttc | ||||
| tolC | tolC-F | atgcaaatgaagaaa | 100 | 49 | (21) |
| tolC-R | ttaatgacggaacggatt |
Abbreviation: Ta, PCR annealing temperature.
3.2. Antibiotic Susceptibility Test
The antibiotic susceptibility of the UPEC isolates was determined by the Kirby-Bauer disk diffusion method, according to the clinical and laboratory standards institute (CLSI) guidelines, using the following antibiotics; amikacin (30 µg), amoxicillin/clavulanic acid (30 µg), ampicillin (10 µg), ampicillin/sulbactam (10/10 µg), cefixime (5 µg), cefotaxime (30 µg), ceftazidime (30 µg), cefuroxime (30 µg), ciprofloxacin (5 µg), CO-trimoxazole (25 µg), gentamicin (10 µg), levofloxacin (5 µg), nalidixic acid (30 µg), nitrofurantion (300 µg) and norfloxacin (10 µg), all of which were supplied by Himedia (India), and aztreonam (30 µg), imipenem (10 µg), meropenem (10 µg), piperacillin/tazobactam (100/10 µg), tetracycline (30 µg), which were supplied by Oxoid (UK). The E. coli strain ATCC 25922 was the reference strain (22). The MDR phenotype is defined as non-susceptibility to at least one agent in three or more of the antimicrobial categories used in treatment, and accordingly, UPEC isolates were classified to MDR and non-MDR (4).
3.3. Phenotypic Detection of Efflux Pump-Mediated Resistance
Efflux pump-mediated resistance in UPEC clinical isolates was tested by the microplate-based assay, using an efflux pump inhibitor, Chlorpromazine (CPZ) (23). The minimum inhibitory concentration (MIC) of CPZ was determined for all tested isolates using the microdilution broth method (24). The sub-MIC value of CPZ was used along with the chosen antibiotics, according to the UPEC isolates resistance patterns, in the microplate-based assay (23).
3.4. Detection of the Presence of AcrAB-TolC Main Efflux Genes
The PCR detection of acrA, acrB, and tolC genes in all UPEC clinical isolates was performed, in a final reaction volume of 20 µL, using primers (Macrogen, Korea) listed in Table 1 at a concentration of 0.5 µM, and My Taq™ Red Mix (Bioline, UK) (18, 21).
3.5. Detection of In-Vitro Biofilm Formation and the Phenotypic Detection of Curli Production
In-vitro biofilm formation by UPEC clinical isolates was assayed using the microtiter plate assay method in a 96-well polystyrene flat-bottomed microtiter plate (Greiner Bio-one, Stuttgart, Germany) (25). The biofilm was stained using 0.2% crystal violet (Winlab, UK). The absorbance was measured at 595nm using the Enzyme Linked Immunosorbent (ELISA) reader (BioTek®, MQX 200, USA) and the degree of biofilm formation was estimated (26). The presence of curli fibers was determined by streaking isolates on Luria-Bertani agar plates (L.B.) without salt (Difco Laboratories, U.S.A) containing 40 mg/L Congo red dye (Aldrich Chemical Co. Ltd. England), followed by incubation at 30°C for 48 hours; the appearance of red, dry, and rough colonies indicated a positive result (27).
3.6. Statistical Analysis
The data was statistically analyzed using the statistical program for social science (SPSS) version 22. P values were calculated using Chi-square test. P values of < 0.05 were considered statistically significant.
4. Results
4.1. Molecular Identification and Phylogenetic Grouping of UPEC Clinical Isolates
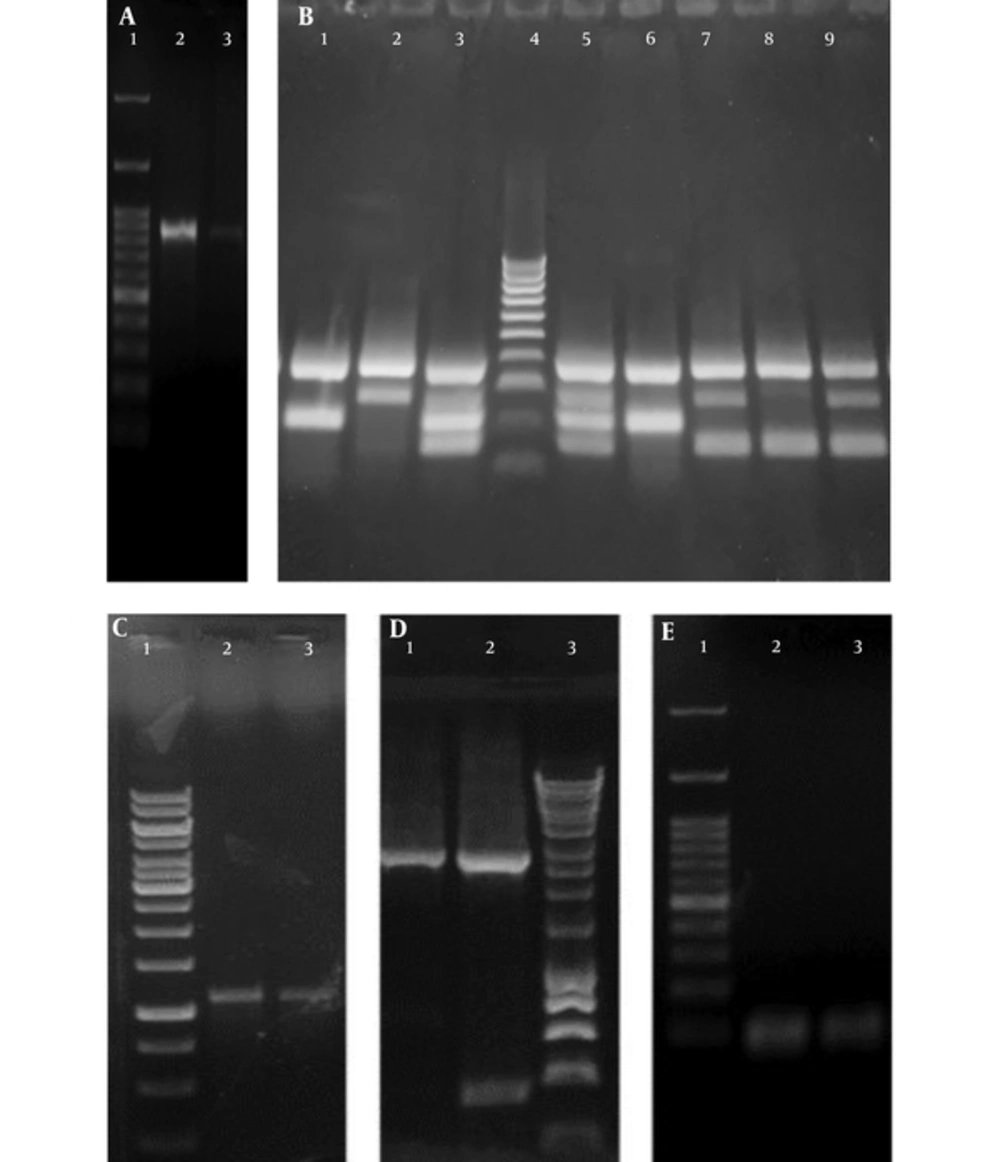
Two hundred and twenty eight UTI isolates were included in the study; 175 isolates were presumptively identified as E. coli by conventional culture methods, and confirmed by the PCR amplification of uspA (76.75%; 175/228), as shown in Figure 1. The phylogenetic grouping of the UPEC isolates by multiplex PCR, as shown in Figure 1, revealed that 64.57% (113/175), 18.85% (33/175), 10.85% (19/175), and 5.71% (10/175) of the isolates belonged to phylogenetic groups B2, D, A, and B1, respectively. The distribution of the phylogenetic groups differed slightly in UPEC isolates from the two governorates. In the Dakhalia governorate, 66.9% (83/124), 17.7% (22/124), 12.9% (16/124), and 2.4% (3/124) of UPEC isolates belonged to B2, D, A, and B1 phylogenetic groups, respectively. On the other hand, in the Giza governorate, 58.8% (30/51), 21.5% (11/51), 13.7% (7/51), and 5.8% (3/51) of UPEC isolates belonged to B2, D, B1, and A phylogenetic group, respectively.
A, Agarose gel of the Polymerase Chain Reaction amplification product of uspA where Lane 1: One Mark 100 DNA Ladder (100 bp, 200 bp, 300 bp, 400 bp, 500 bp, 600 bp, 700 bp, 800 bp, 900 bp, 1000 bp, 1500 bp, 3000 bp) (GeneDireX, USA) Lane 2, 3: uspA band of the exact size of 884 bp in E. coli ATCC 25922 and a UPEC isolate, respectively; B, Agarose gel of the phylogenetic multiplex Polymerase Chain Reaction amplification products where: Lane 1, 6: Phylogenetic group A showing specific bands of gadA (373 bp) and yjaA (216 bp). Lane 2: Phylogenetic group D showing specific bands of gadA (373 bp) and chuA (281 bp). Lane 3, 5: Phylogenetic group B2 showing specific bands of gadA (373 bp), chuA (281 bp) and yjaA (216 bp) and DNA fragment TspE4.C2 (152 bp). Lane 4: HyperLadder™ 100bp (100 bp, 200 bp, 300 bp, 400 bp, 500 bp, 600 bp, 700 bp, 800 bp, 900 bp, 1013bp) (Bioline, UK). Lane 7, 9: Phylogenetic group D showing specific bands of gadA (373 bp), chuA (281 bp) and DNA fragment TspE4.C2 (152 bp). Lane 8: Phylogenetic group B1 of E. coli ATCC 25922 showing specific bands of gadA (373 bp) and DNA fragment TspE4.C2 (152 bp); C, Agarose gel of the Polymerase Chain Reaction amplification product of acrA where: Lane 1: GeneRuler 1 kb DNA Ladder (250 bp, 500 bp, 750 bp, 1000 bp, 1500 bp, 2000 bp, 2500 bp, 3000 bp, 3500 bp, 4000 bp, 5000 bp, 6000 bp, 8000 bp, 10000 bp). Lane 2 - 3: acrA band of the exact size of 1078 bp. D, Agarose gel of the Polymerase Chain Reaction amplification product of acrB where: Lane 1 - 2: acrB band of the exact size of 2730 bp. Lane 3: HyperLadder™ 1 Kb (200 bp, 400 bp, 600 bp, 1000 bp, 1500 bp, 2000 bp, 2500 bp, 3000 bp, 4000 bp, 5000 bp, 6000 bp, 8000 bp,10037bp) (Bioline, UK); E, Agarose gel of the Polymerase Chain Reaction amplification product of tolC where: Lane 1: One Mark 100 DNA Ladder (100 bp, 200 bp, 300 bp, 400 bp, 500 bp, 600 bp, 700 bp, 800 bp, 900 bp, 1000 bp, 1500 bp, 3000 bp) (GeneDireX, USA). Lane 2 - 3: tolC PCR band of the exact size of 100 bp.
4.2. Antibiotic Susceptibility of UPEC Clinical Isolates
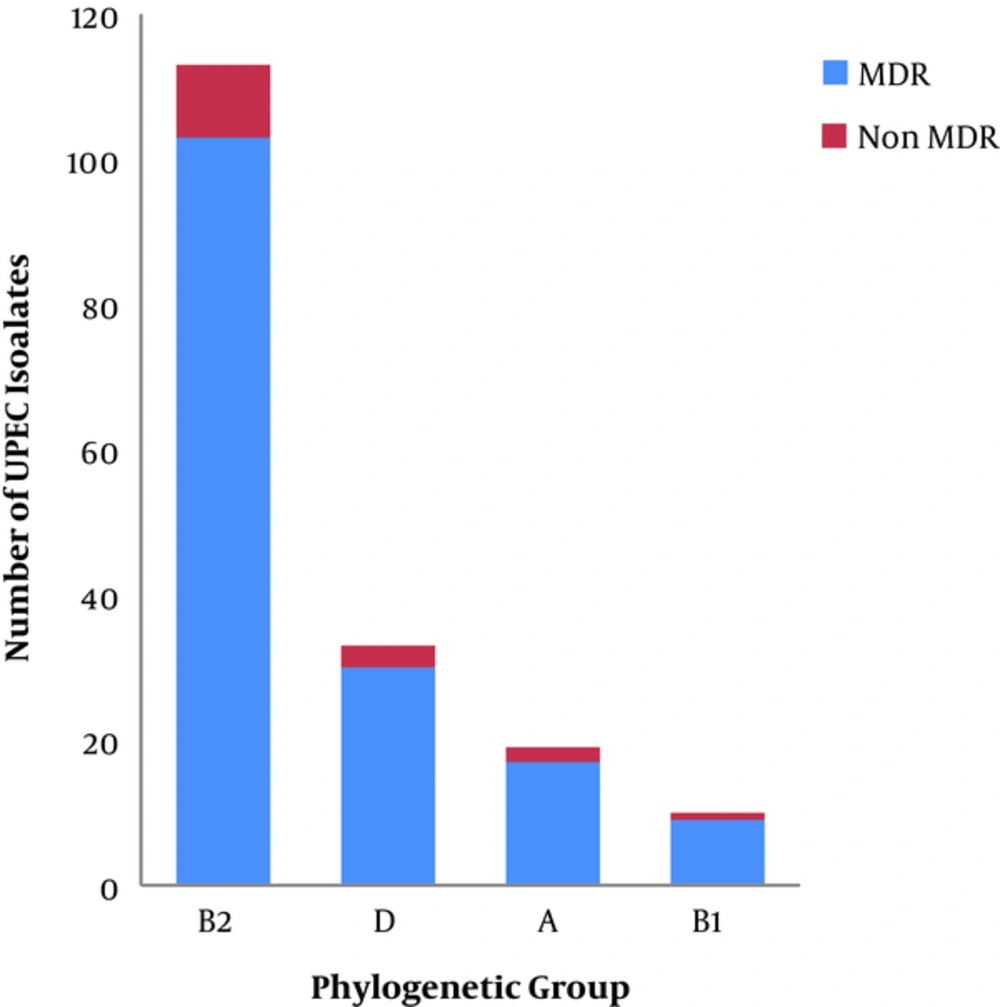
The MDR phenotype was detected in 90.85% (159/175) of the tested isolates. The incidence of MDR phenotype differed in the two governorates; 96.77% (120/124) of the UPEC isolates’ from Dakahlia governorate were MDR, while only 76.47% (39/51) of the isolates from Giza governorate were MDR. The phylogenetic grouping of the MDR isolates revealed that 64.77% (103/159), 18.86% (30/159), 10.69% (17/159), and 5.66% (9/15) of isolates belonged to phylogenetic groups B2, D, A and B1, respectively, as shown in Figure 2. The phylogenetic grouping of the non-MDR isolates revealed that 62.5% (10/16), 18.75% (3/16), 12.5% (2/16), and 6.25% (1/16) of isolates belonged to the phylogenetic groups B2, D, A, and B1, respectively, as shown in Figure 2. The number of resistant UPEC isolates to each of the tested antibiotics among different phylogenetic groups is recorded in Table 2.
| Antibiotics | B2 | D | A | B1 | Total No of Resistant Isolates |
|---|---|---|---|---|---|
| Amikacin | 14 | 0 | 0 | 1 | 15 |
| Gentamicin | 53 | 17 | 7 | 5 | 82 |
| Imipenem | 27 | 7 | 7 | 5 | 46 |
| Meropenem | 53 | 12 | 8 | 6 | 79 |
| Cefuroxime | 103 | 30 | 16 | 9 | 158 |
| Cefixime | 80 | 27 | 15 | 8 | 130 |
| Cefotaxim | 78 | 22 | 15 | 9 | 124 |
| Ceftazidime | 75 | 24 | 14 | 8 | 121 |
| Co-Trimoxazole | 82 | 23 | 12 | 7 | 124 |
| Ciprofloxacin | 71 | 22 | 7 | 5 | 105 |
| Norfloxacin | 71 | 22 | 7 | 5 | 105 |
| Levofloxacin | 69 | 19 | 9 | 5 | 102 |
| Nalidixic acid | 81 | 23 | 15 | 8 | 127 |
| Nitrofurantoin | 40 | 12 | 8 | 2 | 62 |
| Ampicillin | 104 | 29 | 17 | 10 | 160 |
| Amoxicillin/Clavulanic acid | 94 | 29 | 16 | 9 | 148 |
| Ampicillin/Sulbactam | 83 | 28 | 14 | 8 | 133 |
| Piperacillin/Tazobactam | 57 | 25 | 12 | 4 | 98 |
| Aztreonam | 70 | 21 | 14 | 7 | 112 |
| Tetracycline | 79 | 24 | 13 | 9 | 125 |
4.3. Phenotypic Detection of Efflux Pump-Mediated Resistance
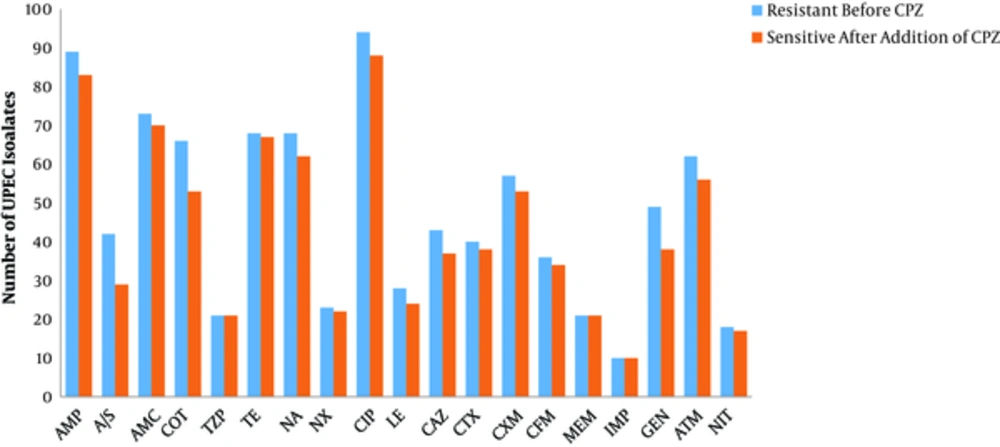
The change in the susceptibility of the UPEC isolates to each of the tested antibiotics in the presence of an EPI (CPZ) is shown in Figure 3. Efflux pump-mediated resistance was detected in 92% (161/175) of UPEC isolates, and 98.7% (157/159) of MDR isolates. Efflux pump-mediated resistance to more than one antibiotic, in a single isolate, was recorded in 95% (153/161) of efflux pump containing isolates; all of which were MDR UPEC.
Change in the antibiotic resistance of Uropathogenic Escherichia coli in the presence of an efflux pump inhibitor CPZ where: Ampicillin (AMP), Ampicillin/Sulbactam (A/S), Amoxicillin/Clavulanic acid (AMC), Co-Trimoxazole (COT), Piperacillin/Tazobactam (TZP), Tetracycline (TE), Nalidixic Acid (NA), Norfloxacin (NX), Ciprofloxacin (CIP), Levofloxacin (LE), Ceftazidime (CAZ), Cefotaxime (CTX), Cefuroxime (CXM), Cefixime (CFM), Meropenem (MEM), Imipenem (IMP), Gentamicin (GEN), Aztreonam (ATM), and Nitrofurantoin (NIT)
4.4. Polymerase Chain Reaction Detection of AcrAB-TolC Efflux Pump Main Genes
Agarose gel of the PCR amplification products of the efflux pump main genes is shown in Figure 1. The three tested genes (acrA, acrB, and tolC) were concomitantly detected in 74.28% (130/175) of the UPEC isolates, in 74.84% (119/159) of MDR isolates, and in 68.75% (11/16) of non-MDR isolates. Missing acrA was detected in 8% (14/175) and 8.17% (13/159) of UPEC isolates and MDR isolates, respectively. However, the absence of acrB was detected in 10.85% (19/175) and 1.25% (2/159) of UPEC isolates and MDR isolates, respectively. The absence of acrAB, acrA-tolC, and acrB-tolC genes was detected in 5.71% (10/175), 0.57% (1/175), and 0.57% (1/175) of UPEC isolates, respectively. Missing of either acrAB or acrA-tolC was recorded in 5.66% (9/159) and 0.62% (1/159) of MDR isolates, respectively. The bacterial susceptibility to tetracycline increased significantly with the absence of two of the pump genes (P = 0.003).
4.5. Detection of In-Vitro Biofilm Formation and Curli Production
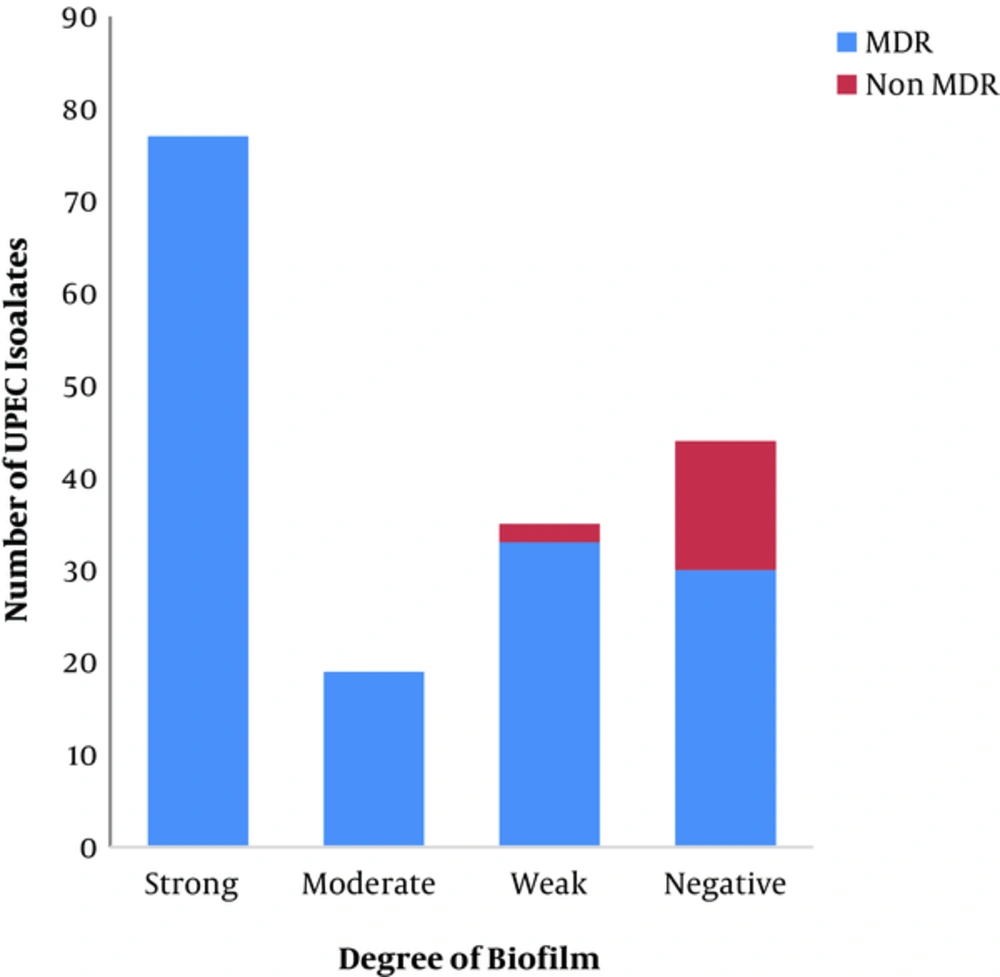
The degree of biofilm formation was measured in all UPEC isolates; 44% (77/175), 10.8% (19/175), 21.7% (38/175), and 23.42% (41/175) of which were strong, moderate, weak, and negative biofilm producers, respectively, as shown in Figure 4. The MDR UPEC clinical isolates were strong, moderate, weak, and negative biofilm producers at a percentage of 48.42% (77/159), 11.94% (19/159), 20.75% (33/159), and 18.86% (30/159), respectively, as shown in Figure 4. There was a significant correlation between biofilm formation and multidrug resistance (P = 0.00). Curli production was detected in 45.71% (80/175) of UPEC isolates, 98.75% of which were MDR.
5. Discussion
Urinary Tract Infections represent a major health threat due to the wide spread of antibiotic resistance and the associated high recurrence rate (28). In the current study, the phylogenetic grouping of tested UPEC revealed that 64.57%, 18.85%, 10.85%, and 5.71% of the isolates belonged to the phylogenetic group B2, D, A, and B1, respectively. Similar phylogenetic grouping studies in Barcelona and Iran showed comparable results, with high predominance of phylogenetic groups B2 and D in UPEC isolates (29, 30).
This research revealed a high incidence of MDR phenotype (90.85%) among UPEC isolates. The percentage of the MDR phenotype differed in isolates from the 2 governorates, being higher in Mansura hospital (Dakhalia governorate, rural, 96.77%) than in MUST hospital (Giza governorate, urban, 76.47%). Other studies in Egypt, reported a high incidence of MDR phenotype among UPEC; where it was recorded in 95%, 84%, and 47.9% of tested UPEC isolates in Cairo, Dakhalia, and Minia governorates, respectively (6, 7, 31). Other studies, from developing countries, also reported a high incidence of antibiotic resistance among UPEC; where the MDR phenotype was detected among 78%, 32.2% and 92.9%, of UPEC isolates from Tehran, Libya, and Bangladesh, respectively (32-34). In the current study, 64.8%, 18.9%, 10.7%, and 5.7% of the MDR UPEC isolates belonged to phylogenetic groups B2, D, A, and B1, respectively; this is in contrast to a study from Korea where: 73%, 23%, and 3.2% of MDR UPEC belonged to phylogenetic groups B2, D, and A, respectively (1).
Multidrug efflux pumps play an important role in resistance to different antibiotic classes (35, 36). The current study detected the co-presence of two efflux pump genes, acrA and acrB in 74.28% of tested UPEC clinical isolates, and the presence of tolC in 98.85% of UPEC isolates. This is in contrast to studies from Iran that reported the co-presence of acrA-B in 95.9% of E. coli isolates (32), and the presence of tolC in 69.4% of E. coli isolates (37). A significant correlation between the presence of tolC and the MDR phenotype (P = 0.044) was detected in the present study. This is because TolC functions independently of AcrA and AcrB, thus it can contribute to intrinsic resistance with or without AcrA-B (38). In the current study, the bacterial susceptibility to tetracycline increased significantly with the absence of two of the pump genes (P = 0.003); this is in agreement with a previous study by Okusu et al. (1996), who reported that deletion of acrAB resulted in hypersensitivity to tetracycline, nalidixic acid, ampicillin, chloramphenicol, and rifampin (39). Efflux pump-mediated resistance was predominant among UPEC isolates from Egypt (92%); it contributes to the MDR phenotype in the tested UPEC isolates, where efflux pump-mediated resistance to more than one antibiotic was recorded in 96.22% of MDR UPEC isolates. This is in accordance with previous studies from Alexandria (Egypt) and Japan that showed the major contribution of efflux pumps in E. coli (35, 36).
Several studies have previously reported that most UPEC clinical isolates with relapsed infection were in-vitro biofilm-producers (16). In the present study, in-vitro biofilm production was recorded in 76.5% of UPEC isolates; this is in contrast to other studies that showed different percentages of biofilm production among UPEC with 63.6%, 60.15%, and 51.9 % recorded in Egypt, India, and Nepal, respectively (15, 40, 41). Curli production was detected in 45.7% of the tested UPEC clinical isolates; a similar study from Sweden reported the detection of curli production among 54% of UPEC (42). A significant correlation was found between biofilm production and MDR phenotype among UPEC in the current study. In this study, 81.13% of MDR UPEC isolates were biofilm-producers; while 100% of MDR UPEC isolates in India were biofilm-producers (15). Previous studies indicated a strong correlation between biofilm production and resistance to multiple antibiotics (15, 40, 43).
6. Conclusions
The misuse of antibiotics leads to the wide spread of MDR phenotype among UPEC isolates in Egypt. The significant correlation between biofilm production and MDR phenotype will lead to relapse of infection. The prevalence of efflux pump-mediated resistance to more than one antibiotic, as a prominent mechanism of resistance in Egypt, necessitates the application of new treatment strategies to inhibit efflux pumps.
