


1. Background
Globally, antimicrobial resistance (AMR) remains a serious challenge to public health in the current century (1). Resistance to antimicrobials has escalated into a worldwide pandemic, presenting a menace to human health and food production (2). Aminoglycosides, fluoroquinolones, and β-lactams, particularly cephalosporins, carbapenems, β-lactam antibiotics, and β-lactamase inhibitor combinations, are broad-spectrum antimicrobials used to treat infections caused by Gram-negative bacteria (GNB) (3). Aminoglycosides play an essential role in clinical settings and serve as a treatment option for severe and life-threatening infections caused by GNB, especially in hospitals (4). Escherichia coli is a prevalent facultative anaerobic and often harmless microbe in the digestive tract of humans and animals. This medically important bacterium causes various significant disorders (5). Numerous monitoring programs utilize E. coli because it is ubiquitous in food-producing animals, a marker of fecal contamination, and simple to cultivate. It can also easily develop resistance mechanisms to combat agents active against GNB (6).
Aminoglycosides, powerful bactericidal agents, can hinder bacterial protein synthesis by binding to the 30S ribosomal subunit. These agents act synergistically and are mostly employed in combination with either a glycopeptide or a β-lactam to treat E. coli urinary tract infections (7). There are reports of resistance to aminoglycosides, most worryingly in relation to resistance to other antibiotic classes (8). In GNB, resistance to aminoglycosides mainly arises from the production of aminoglycoside modifying enzymes (AMEs) or alteration in the ribosome by acquired 16S rRNA methyltransferases (RMTases). In E. coli, the most common resistance mechanism is AME production (9, 10). Aminoglycoside modifying enzymes, based on their catalytic reaction, are classified into three categories: Aminoglycoside N-acetyltransferases (AAC), aminoglycoside O-phosphotransferases (APH), and aminoglycoside O-nucleotidyltransferases (ANT) (11).
Biofilms, collections of microbial cells, are irreversibly connected to a surface and surrounded by a matrix of materials, primarily polysaccharides. These structures offer a survival strategy to bacteria by facilitating efficient use of available nutrients and preventing access to antimicrobials, antibodies, and white blood cells (12). Biofilms also harbor multiple antibiotic-inactivating enzymes, such as β-lactamases, creating islands of AMR (13). A number of infections caused by E. coli are associated with biofilm formation, often leading to an inability to eradicate the infection due to its inherent resistance to high doses of antibiotics. E. coli ’s ability to form biofilms is a significant virulence feature (14).
2. Objectives
The aim of this study was to evaluate antimicrobial susceptibility, aminoglycoside resistance genes, and biofilm formation in E. coli isolates collected from hospitalized patients in educational hospitals in Ahvaz, Khuzestan, Iran.
3. Methods
3.1. Bacterial Isolates
This descriptive cross-sectional study was conducted on 70 clinical isolates of E. coli obtained using phenotypic methods. The bacterial isolates were collected from various clinical specimens in Ahvaz teaching hospitals affiliated with Ahvaz Jundishapur University of Medical Sciences. Patients signed informed consent forms before the initiation of this research project. The study was carried out in accordance with the Helsinki declaration.
3.2. Antibiotic Susceptibility Test
The AMR testing was performed using the disk diffusion technique on Mueller-Hinton agar plates (Merck, Germany), as recommended by CLSI in 2021 (15). The antibiotics tested included amikacin (AMK: 30 μg), gentamicin (GEN: 10 μg), tobramycin (TOB: 10 μg), piperacillin-tazobactam (PTZ: 110 μg), imipenem (IMI: 10 μg), meropenem (MER: 10 μg), ertapenem (ERT: 10 μg), cefazolin (CZ: 30 μg), cefoxitin (FOX: 30 μg), cefotaxime (CTX: 30 μg), ceftazidime (CAZ: 30 μg), ceftriaxone (CRO: 30 μg), cefoperazone (CFP: 75 μg), ciprofloxacin (CIP: 5 μg), azithromycin (AZM: 15 μg), ampicillin-sulbactam (AMP/SL: 20 μg), and tigecycline (TGC: 15 μg) (MAST Diagnostics). E. coli ATCC 25922 was used as a quality control strain.
3.3. Measurement of Biofilm Density
The ability of isolates to form biofilm was assessed using the microtiter plate (MTP) technique. The isolates were classified into four categories based on previously described criteria (16): No biofilm (A ≤ Ac), weak biofilm (Ac < A ≤ 2Ac), moderate biofilm (2Ac < A ≤ 4Ac), and strong biofilm (A > 4Ac) producers. The optical density value was measured at 570 nm. The PAO1 strain of Pseudomonas aeruginosa was used as a positive control for the biofilm assay. All samples were tested three times.
3.4. Biofilm Elimination Tests
The MTP technique was utilized to test the ability of AMK and GEN to remove biofilms, as previously described (17). After biofilm formation for 48 hours, the medium was discarded, and the wells were washed with PBS to remove non-attached bacteria. Subsequently, the plates were filled with 100 μL of MHB containing 2% glucose and 100 μL of antibiotics at concentrations ranging from 0.25 to 512 μg/mL. After incubation at 37°C for 24 hours, the plates were treated according to the biofilm formation assay described above. The minimal biofilm eradication concentration (MBEC) was defined as the lowest concentration of antibiotics leading to a 100% decrease in the metabolic activity of preformed biofilms. The experiment was carried out in triplicate and repeated three times.
3.5. DNA Extraction and Polymerase Chain Reaction
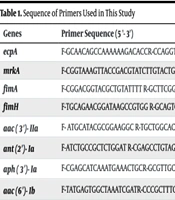
Total DNA was extracted from bacterial isolates using the boiling technique (18). Table 1 lists the specific oligonucleotide primers used to identify AME genes (aac(3′)-IIa, ant(2′′)-Ia, aph(3’)-Ia, and aac(6')-Ib) and biofilm formation genes (fimA, fimH, mrkA, and ecpA). The quality and quantity of the DNA were assessed using a Nanodrop spectrophotometer (Nanodrop One; Thermo Scientific, Wilmington, USA). DNA samples with a minimum concentration of 50 µg/mL were kept at -20°C until use. The reaction mixture was prepared as follows: 12.5 μL of 2 × Master Mix (Ampliqon, Denmark), 1 μL of each forward and reverse primer, 2 μL of template DNA, and sterile distilled water up to a final volume of 25 μL. The reactions were carried out in the C1000 Bio-Rad Thermal Cycler (Bio-Rad Laboratories, Inc., USA). The following thermal program was used to amplify the fragments: Initial denaturation at 94°C for 5 min, followed by 32 cycles (denaturation at 95°C for 45 s, annealing at 52 - 58°C for 45 s, extension at 72°C for 60 s), and a final extension at 72°C for 7 min. The PCR products were separated on a 1.5% agarose gel stained with Safe Stain (Sinaclon, Tehran, Iran).
| Genes | Primer Sequence (5 '- 3') | Product Size (bp) | References |
|---|---|---|---|
| ecpA | F-GCAACAGCCAAAAAAGACACCR-CCAGGTCGCGTCGAACT | 477 | (19) |
| mrkA | F-CGGTAAAGTTACCGACGTATCTTGTACTG R-GCTGTTAACCACACCGGTGGTAAC | 498 | (19) |
| fimA | F-CGGACGGTACGCTGTATTTT R-GCTTCGGCGTTGTCTTTATC | 500 | (19) |
| fimH | F-TGCAGAACGGATAAGCCGTGG R-GCAGTCACCTGCCCTCCGGTA | 508 | (20) |
| aac(3′)-IIa | F- ATGCATACGCGGAAGGC R-TGCTGGCACGATCGGAG | 822 | (21) |
| ant (2′)-Ia | F-ATCTGCCGCTCTGGAT R-CGAGCCTGTAGGACT | 404 | (21) |
| aph(3′)-Ia | F-CGAGCATCAAATGAAACTGCR-GCGTTGCCAATGATGTTACAG | 623 | (21) |
| aac(6′)-Ib | F-TATGAGTGGCTAAATCGATR-CCCGCTTTCTCGTAGCA | 395 | (21) |
Sequence of Primers Used in This Study
3.6. Statistical Analysis
Descriptive data were analyzed using Microsoft Excel and SPSS version 22 statistical software (IBM Corporation, Armonk, NY, USA). Fisher’s exact test was employed to determine significance, with a P-value < 0.05 considered statistically significant. The results are presented as descriptive statistics in terms of relative frequency.
4. Results
4.1. Bacterial Characterization
Between October 2020 and March 2021, a total of 70 E. coli clinical isolates were obtained from various clinical specimens, the distribution of which is shown in Table 2. These isolates were recovered from 46 (65.7%) male and 24 (34.2%) female hospitalized patients, with a mean age of 39.5 years (ranging from 11 to 68 years). Escherichia coli was mostly isolated from urine [n = 39 (15 females and 24 males); 55.7%], tracheal tube (n = 10; 14.2%), and sputum [n = 8 (5 males and 3 females)]. The remaining specimens were collected from peritoneal aspirate (n = 2; 2.8%), wound (n = 4; 5.7%), and tonsil (n = 7; 10%).
4.2. Antimicrobial Susceptibility Testing
Antibiotic resistance analysis showed that among 70 E. coli isolates from clinical specimens, simultaneous resistance to GEN, AMK, and TOB was observed in 28.5% of isolates, making it the most common antibiotic resistance pattern among the studied isolates (Table 3). Among aminoglycoside antibiotics, E. coli isolates showed the highest and lowest resistance rates to TOB (n = 36; 51.4%) and GEN (n = 17; 24.2%), respectively. The E. coli isolates also displayed different levels of resistance to the following antibiotics: AMK (n = 27; 38.5%), TGC (n = 20; 28.5%), PTZ (n = 31; 44.2%), IMI (n = 55; 78.5%), MER (n = 70; 100%), ERT (n = 42; 60%), CZ (n = 42; 60%), FOX (n = 40; 57.1%), CTX (n = 70; 100%), CAZ (n = 65; 92.8%), CRO (n = 70; 100%), CFP (n = 70; 100%), CIP (n = 20; 28.5%), AZM (n = 5; 7.1%), ampicillin-sulbactam (n = 35; 50%), and clindamycin (n = 15; 21.4%).
4.3. Biofilm Formation Assay
According to our results, 50 (71.4%) of the isolates were biofilm producers. Twenty-one (21/70; 30%) of the isolates were strong biofilm producers, while the remaining isolates were considered moderate (29/70; 41.4%) and weak (0/70; 0%) biofilm formers. Although the prevalence of strong biofilm producers was higher among the extensively drug-resistant (XDR) phenotype compared to the multiple drug-resistant (MDR) group (76.1% in XDR vs. 23.8% in MDR), there was no significant relationship between the resistance phenotype and the strength of biofilm formation (p = 0.59). Additionally, 50% of non-biofilm producer isolates exhibited the MDR phenotype and were recovered from urine (50%) samples. E. coli strains isolated from urine and tracheal tubes from young adults (under 60 years old) were stronger biofilm formers. Biofilm producer strains were significantly more prevalent among aminoglycoside non-susceptible isolates (Table 3). Notably, only 7.1% (5/70) of non-biofilm producer isolates were resistant to aminoglycosides.
4.4. Ability of AMK and GEN in Biofilm Eradication
To investigate the ability of GEN and AMK in eradicating biofilms, we determined the MBEC. After treating biofilms with different concentrations of AMK and GEN, we counted living bacteria in all tested isolates. Table 4 illustrates the ability of these antibiotics to disperse preformed biofilms in E. coli isolates. GEN and AMK eradicated the preformed biofilms with MBEC values ranging from 64 μg/mL to 1024 μg/mL (MBEC50 = 512 μg/mL and MBEC90 = 1024 μg/mL) and from 512 μg/mL to 2048 μg/mL (MBEC50 and MBEC90 = 2048 μg/mL), respectively.
| Isolate Number | Ward | Sample | Patient’s Gender | Age | Biofilm | MBEC | Resistotype | Presence of AME Genes | |
|---|---|---|---|---|---|---|---|---|---|
| Gentamicin | Amikacin | ||||||||
| E1 | ICU | Sputum | Female | 40 | Non | 512 | 512 | MDR | aac (3')-IIa |
| E2 | ICU | Sputum | Female | 31 | Moderate | 512 | 1024 | MDR | FimA |
| E3 | ICU | Sputum | Male | 45 | Strong | 1024 | 2048 | XDR | FimA |
| E4 | ICU | Tracheal tube | Female | 26 | Moderate | 1024 | 1024 | MDR | ecpA, FimA, ant (2")-Ia |
| E5 | Surgery | Peritoneal aspirate | Female | 52 | Moderate | 1024 | 1024 | MDR | ecpA, FimA, FimH, ant (2")-Ia, aph(3’)-Ia, |
| E6 | Men | Urine | Male | 41 | Non | 64 | 512 | XDR | ecpA, |
| E7 | Men | Urine | Male | 37 | Moderate | 128 | 1024 | MDR | ecpA |
| E8 | Burn | Wound | Female | 67 | Strong | 512 | 2048 | MDR | FimA |
| E9 | Burn | Wound | Male | 38 | Non | 128 | 512 | MDR | ant (2")-Ia |
| E10 | ENT | Tonsil | Male | 35 | Strong | 1024 | 2048 | MDR | ecpA, ant (2")-Ia |
| E11 | ENT | Tonsil | Male | 41 | Moderate | 512 | 1024 | MDR | ecpA |
| E12 | ENT | Tonsil | Male | 29 | Non | 512 | 1024 | MDR | ecpA, FimA, aac (6')-Ib |
| E13 | Men | Urine | Male | 38 | Strong | 1024 | 2048 | XDR | ecpA |
| E14 | Surgery | Sputum | Female | 42 | Strong | 1024 | 2048 | XDR | FimA |
| E15 | ICU | Sputum | Male | 50 | Non | 512 | 1024 | MDR | ecpA, aac (3')-IIa, ant (2")-Ia, aph (3')-Ia |
| E16 | internal medicine | Urine | Female | 48 | Moderate | 512 | 2048 | MDR | ecpA, FimA, ant (2")-Ia |
| E17 | Men | Urine | Male | 43 | Moderate | 512 | 2048 | XDR | ecpA, FimA, FimH, aac (3')-IIa |
| E18 | Women | Urine | Female | 20 | Moderate | 512 | 2048 | MDR | ecpA, ant (2")-Ia, aph (3')-Ia |
| E19 | ICU | tracheal tube | Male | 68 | Non | 128 | 1024 | MDR | ecpA |
| E20 | Men | Urine | Male | 35 | Moderate | 1024 | 2048 | MDR | ecpA, aac (3')-IIa, ant (2")-Ia |
| E21 | internal medicine | Urine | Female | 32 | Strong | 1024 | 2048 | MDR | ecpA, FimA, aph (3')-Ia |
| E22 | Women | Urine | Female | 41 | Moderate | 512 | 2048 | XDR | ecpA, ant (2")-Ia |
| E23 | Women | Urine | Female | 27 | Moderate | 512 | 2048 | XDR | aac (3')-IIa, ant (2")-Ia |
| E24 | Men | Urine | Male | 42 | Non | 512 | 512 | XDR | ecpA, ant (2")-Ia |
| E25 | Surgery | Tonsil | Male | 51 | Non | 512 | 1024 | XDR | ecpA |
| E26 | Urology | Urine | Female | 34 | Non | 512 | 1024 | XDR | FimA |
| E27 | Urology | Urine | Female | 22 | Strong | 512 | 2048 | XDR | ecpA, FimA, aac (3')-IIa, ant (2")-Ia , |
| E28 | Urology | Urine | Female | 40 | Strong | 512 | 2048 | XDR | ecpA, ant (2")-Ia, aph (3')-Ia |
| E29 | ICU | Sputum | Male | 31 | Strong | 512 | 2048 | XDR | FimA, FimH, aph (3')-Ia, aac (6')-Ib |
| E30 | Men | Urine | Male | 45 | Non | 1024 | 512 | MDR | ecpA |
| E31 | Urology | Urine | Female | 26 | Moderate | 64 | 512 | XDR | aac (3')-IIa |
| E32 | internal medicine | Urine | Male | 45 | Moderate | 512 | 2048 | MDR | ecpA, ant (2")-Ia |
| E33 | internal medicine | Urine | Male | 26 | Moderate | 512 | 2048 | MDR | ecpA, ant (2")-Ia |
| E34 | ICU | Tracheal tube | Male | 52 | Non | 128 | 512 | MDR | ecpA, ant (2")-Ia |
| E35 | Men | Urine | Male | 41 | Moderate | 1024 | 2048 | XDR | ecpA, FimA, FimH, ant (2")-Ia, aac(6')-Ib |
| E36 | women | Sputum | Male | 37 | Strong | 1024 | 2048 | XDR | ecpA |
| E37 | urology | Urine | Male | 67 | Moderate | 1024 | 2048 | MDR | ecpA, aac(3’)-IIa, ant(2”)-Ia |
| E38 | surgery | Sputum | Male | 38 | Moderate | 1024 | 2048 | MDR | ecpA |
| E39 | internal medicine | Urine | Male | 35 | Non | 512 | 1024 | XDR | ecpA, FimA |
| E40 | infectious diseases | Urine | Female | 41 | Moderate | 1024 | 2048 | XDR | ecpA, ant (2")-Ia |
| E41 | infectious diseases | Urine | Female | 29 | Strong | 1024 | 2048 | XDR | - |
| E42 | urology | Urine | Female | 38 | Non | 512 | 512 | XDR | - |
| E43 | Women | Urine | Female | 42 | Strong | 1024 | 2048 | XDR | - |
| E44 | Women | Urine | Female | 50 | Moderate | 1024 | 2048 | XDR | ecpA, ant (2")-Ia |
| E45 | men | Urine | Male | 48 | Non | 128 | 512 | XDR | aac (3')-IIa, ant (2")-Ia |
| E46 | internal medicine | Urine | Female | 38 | Strong | 512 | 2048 | XDR | ecpA, ant (2")-Ia |
| E47 | Men | Urine | Male | 43 | Strong | 512 | 2048 | XDR | ecpA |
| E48 | Men | Urine | Male | 42 | Non | 1024 | 512 | XDR | ecpA, ant (2")-Ia |
| E49 | men | Urine | Male | 36 | Moderate | 64 | 2048 | XDR | aac(3’)-IIa, ant (2")-Ia |
| E50 | pediatrics | Urine | Male | 13 | Moderate | 512 | 2048 | XDR | ecpA, ant (2")-Ia |
| E51 | pediatrics | Urine | male | 11 | Moderate | 1024 | 2048 | XDR | ecpA |
| E52 | ICU | Urine | male | 56 | Strong | 512 | 2048 | XDR | ecpA, ant (2")-Ia |
| E53 | ICU | Urine | Male | 74 | Moderate | 1024 | 1024 | XDR | aac(3’)-IIa, ant(2”)-Ia |
| E54 | ICU | Tracheal tube | Female | 40 | Moderate | 1024 | 2048 | XDR | ecpA, ant (2")-Ia |
| E55 | surgery | Tracheal tube | male | 31 | Strong | 1024 | 2048 | XDR | ecpA, FimA, FimH, ant (2")-Ia, aph(3’)-Ia, aac(6')-Ib |
| E56 | men | Urine | Male | 45 | Moderate | 128 | 1024 | XDR | ecpA, FimA |
| E57 | men | Urine | Male | 26 | Non | 128 | 512 | XDR | ecpA |
| E58 | burn | Wound | Female | 52 | Strong | 1024 | 1024 | XDR | - |
| E59 | burn | Wound | Female | 41 | Non | 512 | 1024 | - | ecpA, ant (2")-Ia |
| E60 | ENT | Tonsil | Male | 37 | Strong | 1024 | 2048 | MDR | ecpA, ant (2")-Ia |
| E61 | men | Tonsil | Male | 67 | Strong | 1024 | 2048 | XDR | ecpA, ant (2")-Ia |
| E62 | ENT | Tonsil | Female | 13 | Moderate | 1024 | 2048 | MDR | ecpA, FimA, FimH, ant (2")-Ia, aac (6')-Ib |
| E63 | men | Urine | Male | 29 | Non | 1024 | 512 | MDR | ecpA |
| E64 | men | Urine | male | 42 | Moderate | 1024 | 2048 | XDR | ecpA, aac (3')-IIa, ant (2")-Ia |
| E65 | Surgery | Peritoneal aspirate | male | 51 | Non | 128 | 512 | MDR | ecpA, ant 2")-Ia |
| E66 | Male | Tracheal tube | Male | 34 | Moderate | 1024 | 1024 | MDR | aac (3')-IIa, ant(2”)-Ia |
| E67 | Male | Tracheal tube | Male | 40 | Strong | 64 | 2048 | MDR | ecpA, ant (2")-Ia |
| E68 | Male | Tracheal tube | Male | 31 | Non | 512 | 512 | XDR | ecpA, FimA, ant (2")-Ia, aph (3')-Ia |
| E69 | Male | Tracheal tube | Male | 45 | Moderate | 1024 | 2048 | MDR | ecpA, ant (2")-Ia |
| E70 | Male | Tracheal tube | Male | 23 | Strong | 1024 | 1024 | XDR | ecpA, ant (2")-Ia |
Demographic Data, Prevalence of Fimbrial and Aminoglycoside Modifying Enzymes Genes, and Biofilm Production in Escherichia coli Isolates
The data indicated that antibiotic-resistant isolates in the planktonic form did not show increased resistance to antibiotics when grown in the biofilm state. However, stronger biofilm formers exhibited a dramatic increase in resistance to antibiotics when grown in biofilms, compared to moderate and weak biofilm formers. The MBECs of GEN and AMK against strong to moderate biofilm formers were ≥ 512 μg/mL and ≥ 1024 μg/mL, respectively, while against weak to non-biofilm formers, the GEN MBEC was ≤ 512 μg/mL and the AMK MBEC was ≤ 1024 μg/mL.
4.5. Distribution of Aminoglycoside Modifying Enzymes and Biofilm-Related Genes in Escherichia coli
Among the 36 isolates that were resistant to at least one of the aminoglycoside antibiotics, 13/36 (36.1%) isolates had AME-related genes either alone or in various combinations. The presence of these genes was not confirmed in the remaining aminoglycoside non-susceptible isolates (23/36; 63%) by PCR and sequencing. Of the 47 positive isolates for at least one of the AME genes, 23 isolates carried one gene encoding AMEs, 8 isolates carried two genes, and 1 isolate carried three genes. Overall, 15 different combination patterns were determined in the mentioned isolates (Tables 4 and 5).
| AMEs and RMTase Genes | No. (%) |
|---|---|
| fimA | 5 (7.1) |
| ecpA | 13 (18.5) |
| ant (2″)-Ia + ecpA | 19 (27.1) |
| ant (2″)-Ia | 1 (1.4) |
| aph (3′)-Ia | 2 (2.8) |
| ant (2″)-Ia + ecpA + fimA | 1 (1.4) |
| aac (6')-Ib + aph(3′)-Ia | 1 (1.4) |
| ant (2″)-Ia + aac(6')-Ib | 3 (4.2) |
| ant (2″)-Ia + aph(3′)-Ia | 4 (5.7) |
| aph (3′)-Ia + ant (2″)-Ia +aac(6')-Ib | 1 (1.4) |
The Distribution of Aminoglycoside Modifying Enzymes and Biofilm Formation Genes in Escherichia coli
The prevalence of genes encoding AMEs among the aminoglycoside non-susceptible E. coli isolates was as follows: ant(2”)-Ia (n = 36; 51.4%), aac(3’)-IIa (n = 10; 14.2%), aac(6')-Ib (n = 5; 7.1%), and aph(3’)-Ia (n = 8; 11.4%). Our findings revealed that the most frequent AME-related genes were ant (2")-Ia and aph(3’)-Ia, followed by aac(3’)-IIa. As depicted in Table 5, ant (2")-Ia was found to coexist with aac(3’)-IIa (n = 9; 12.8%), aph(3’)-Ia (n = 4; 5.7%), and aac(6')-Ib (n = 3; 4.2%). These coexistences were the most common combinations in TOB and GEN non-susceptible isolates.
In the current study, the prevalence of genes involved in biofilm formation and virulence (ecpA, fimA, and fimH) was detected in all biofilm-producing E. coli isolates, whereas mrkA was not found in any isolates. EcpA and fimA were also identified in 75% (15/20) and 20% (4/20) of non-biofilm-producing isolates, respectively. Most isolates harboring AME genes were also positive for biofilm-related genes, including ecpA and fimA. Table 4 lists all the isolates analyzed, along with their origin, genotype(s), and phenotype(s).
5. Discussion
Escherichia coli remains one of the significant causes of hospital-acquired infections, leading to infections in the urinary tract, surgical wounds, the circulatory system, and pneumonia (22). Aminoglycosides are important drugs in treating E. coli infections; however, resistance to these drugs has recently increased in ESBL-producing E. coli (22). Various reasons have been attributed to the emergence of resistance against aminoglycosides, the most important of which entail chromosomal mutation and the acquisition of mobile genetic elements with resistance genes (22). Aminoglycoside modifying enzymes -producing genes are found on plasmids carrying ESBL (22). This study aimed to identify aminoglycoside resistance and biofilm formation genes in E. coli, and the results confirmed the prevalence of biofilm-producing isolates among XDR isolates. Resistance to aminoglycosides in different regions of Iran exhibits diverse patterns, ranging from 0.00% to 77.27% (23). In our study, the lowest and highest antibiotic resistance among aminoglycosides was related to GEN and TOB, with prevalence rates of 24.2% and 51.4%, respectively. Sometimes, doctors fail to conduct necessary tests to confirm bacterial infections, leading to the unnecessary prescription of antibiotics and contributing to the increased incidence of antibiotic resistance (23).
The prevalence of resistance genes varies between countries. In a study conducted by Ojdana and his colleagues in Poland in 2018, the prevalence of aac(6′)-Ib and ant(2″)-Ia genes was reported as 59.2% and 4.6%, respectively. Among the isolated isolates, 79.5% were resistant to aminoglycosides. Additionally, the highest resistance was observed in TOB (70.5%), GEN (59%), netilmicin (43.2%), and AMK (11.4%) (19). In the study by Abo-State et al. in Egypt, the most common aminoglycoside resistance genes were reported in the following order: aac(3′)-IIa (40%), aac(6′)-Ib (30%), aph(3′)-Ia (23.3%), ant(2″)-Ia (20%), aph(3′) (13.3%), and aac(3′)-Ib (6.6%). They identified AMK as the most effective antibiotic against E. coli (24). In Iran, the prevalence of resistance genes has been reported differently (23). In the present study, ant (2″)-Ia was the most prevalent among the isolated isolates.
In a study conducted in the southwestern region of Iran on the prevalence of virulence genes in biofilm-forming E. coli, Boroumand and his colleagues found iutA, FimH (93%), ompT, PAI, and TraT genes to be strong biofilm-producing strains. In addition, among the isolated strains, 19.4%, 23.8%, and 56.3% were strong, medium, and weak producers, respectively (25). In another study by Tajbakhsh et al., in Iran, 87% of the strains were resistant to GEN, and 70% were resistant to AMK. Moreover, the prevalence of biofilm producers among the isolated isolates was 61.53%, among which 18.75% were strong, 25% were intermediate, and 56.25% were weak producers. Similarly, the prevalence of the FimH gene was 93.33%, and biofilm production showed a significant relationship with the presence of the virulence genes FimH, pap, sfa, and afa (26). Katongole et al. explored that biofilm-producing E. coli is associated with the MDR phenotype in such a way that 78% of biofilm-producing E. coli were MDR and 87% were resistant to GEN. The prevalence of the fim gene was 53.5%, which was the most common virulence factor among biofilm-producing strains (13).
In Karigoudar et al.'s study, 94.2% of biofilm producers were resistant to GEN, and a significant link was found between biofilm production and antibiotic resistance (27). Apart from the aforementioned investigations confirming the relationship between biofilm production and the presence of antibiotic resistance in E. coli isolates, Behzadi and associates did not find any significant connection between biofilm production and resistance to several antibiotics (28). In a systematic review and meta-analysis conducted in 2020, the incidence rate of biofilm in uropathogenic E. coli was 84.6%. The rate of strong producers was 24.8%, while those of medium and weak producers were 26.1% and 44.6%, respectively. In addition, there was a significant relationship between biofilm production and the presence of virulence genes and the occurrence of antibiotic resistance (29).
In our study, FimH, FimA, and ecp genes were present in all biofilm-producing strains. Altogether, biofilm-producing strains show higher antibiotic resistance compared to non-producing strains (30). The persistence of urinary infections in patients is related to the presence of biofilm-producing strains, as these strains tend to have a higher prevalence of antibiotic resistance (26). Enhanced knowledge of detecting biofilms in E. coli contributes to more effective management of infections caused by this bacterium. Furthermore, by identifying biofilms and antibiotic sensitivity patterns, it is feasible to choose the most effective antibiotic treatment (27).
5.1. Conclusions
In 2014, the World Health Organization (WHO) introduced E. coli as a major concern in causing hospital- and community-acquired infections (31). However, a 2015 report from the Eastern Mediterranean Regional Office of WHO demonstrated that none of the participating countries had a national action plan to combat antibiotic resistance, which could serve as a priority and indicator for control measures (23). The present study reported a high prevalence of antibiotic resistance, particularly varying rates among aminoglycosides. Considering that aminoglycosides are effective drugs in the treatment of E. coli infections, preventing resistance against these antibiotics is important. Studies found a high prevalence of resistance genes in the isolated strains, along with virulence factors related to binding factors in all strains.
Various factors inhibit the establishment of an effective program to combat antibiotic resistance in Iran and the Eastern Mediterranean countries. In Iran, many antibiotics can easily be purchased from pharmacies without a prescription. People in the Eastern Mediterranean region often use antibiotics to treat febrile illnesses and obtain them without a prescription. Moreover, low-quality and counterfeit antimicrobial drugs are abundantly found in these areas (23).
