1. Background
The COVID-19 pandemic has impacted over 770 million people and resulted in approximately 7 million deaths (1). Although COVID-19 is no longer considered a Public Health Emergency of International Concern, the entire world should reflect on the lessons learned and be prepared for the next public health emergency (2). Predicting the disease course and improving patient prognosis are important for COVID-19 patients, as those with severe COVID-19 experience worse outcomes, including high in-hospital mortality, exacerbation of underlying conditions, reactivation of latent pathogens, and long-term post-acute sequelae of severe acute respiratory syndrome coronavirus 2 (SARS-CoV-2) infection. Therefore, identifying high-risk patients is crucial for facilitating better clinical management (3). Although there are models predicting COVID-19 severity (4-6), it is necessary to develop generalizable severity stratification models for different high-risk groups (such as those with chronic lung diseases, chronic liver diseases, immunodeficiencies, etc.) to guide more personalized treatment plans. This would provide a valuable reference for clinical management during the next pandemic.
Globally, approximately 296 million people are infected with Hepatitis B virus (HBV) (7). Hepatitis B has consistently been the leading cause of morbidity and mortality in mainland China, with the reported number of cases ranking first among all notifiable infectious diseases (8, 9). Individuals who have been previously infected with HBV will have positive HBV core antibody (anti-HBc) in their serum, even if the HBV surface antigen (HBsAg) becomes negative after infection. Patients with positive anti-HBc remain at risk of HBV reactivation or acute liver failure when receiving immunosuppressive therapy (10). Since immunotherapy is one of the treatment regimens for severe COVID-19 patients, it is necessary to develop personalized disease severity prediction models for individuals with positive anti-HBc who are also infected with COVID-19. This would help assess the risk of severe illness in COVID-19 patients with positive anti-HBc and assist in formulating appropriate treatment plans and preventive measures against HBV reactivation.
2. Objectives
In this study, we conducted a retrospective analysis of patients with COVID-19 who were positive for anti-HBc, negative for HBsAg and HBV e-antigen (HBeAg), and were admitted to our hospital from December 2022 to May 2023. The aim was to provide data-supported clinical management plans for patients with COVID-19 and positive anti-HBc to improve the prognosis of this population.
3. Methods
3.1. Study Design
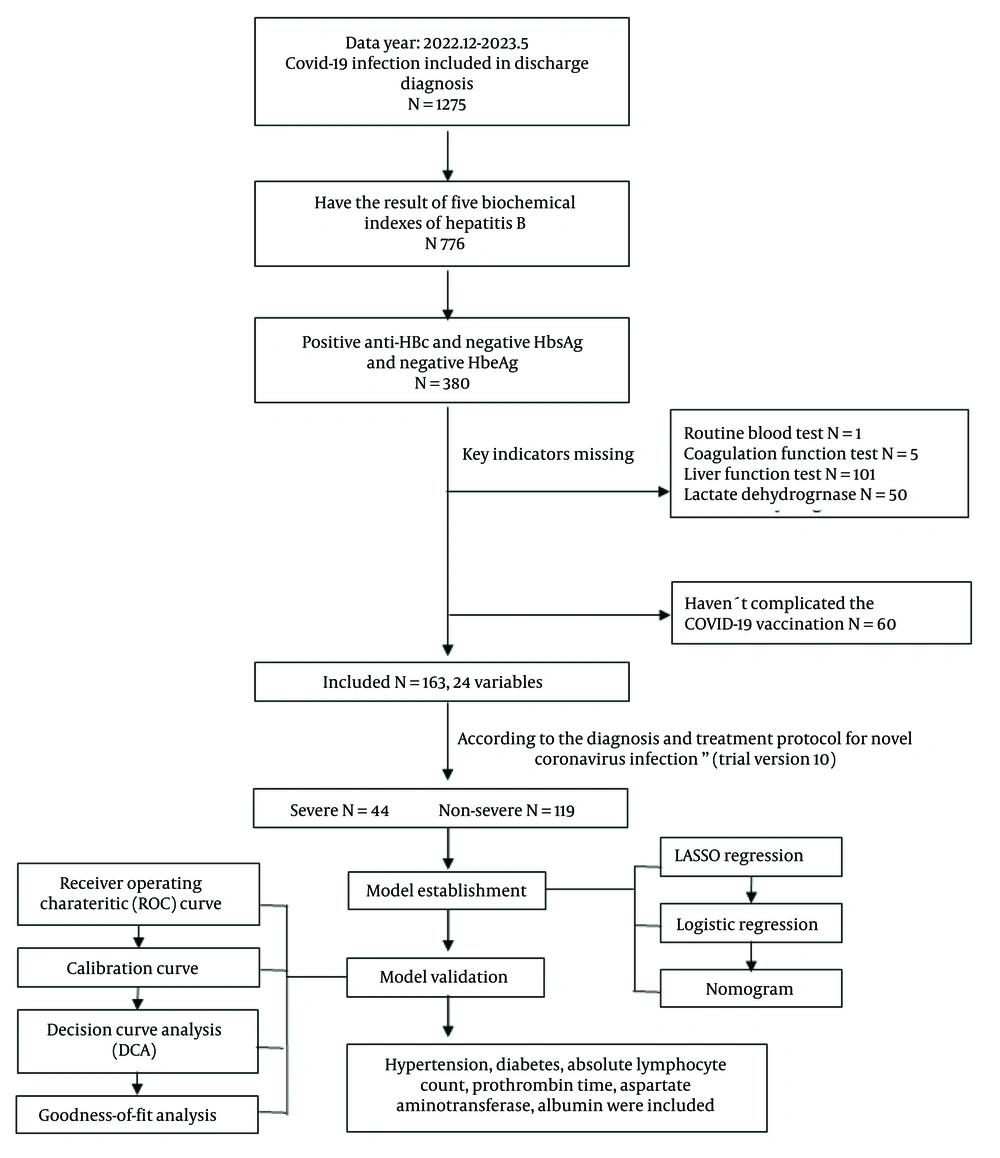
This study is a single-center, retrospective analysis focusing on patients with COVID-19 who were anti-HBc positive, and negative for HBsAg and HBeAg, admitted to Peking University Third Hospital from December 2022 to May 2023. By analyzing patients' routine blood tests, liver function, coagulation parameters, lactate dehydrogenase levels, and underlying diseases, we aimed to determine the risk factors for severe pneumonia and construct a predictive model. The flowchart outlining the study is presented in Figure 1.
3.2. Case Selection
We enrolled a total of 1,275 cases diagnosed with "novel coronavirus infection" from January 2022 to May 2023, and ultimately selected 163 cases based on the inclusion and exclusion criteria.
Inclusion criteria: Patients who met the diagnostic and classification criteria for novel coronavirus infection outlined in the "Diagnosis and Treatment Protocol for COVID-19" (trial version 10) (11), jointly issued by the General Office of the National Health Commission and the Comprehensive Department of the National Administration of Traditional Chinese Medicine on January 5, 2023; Patients diagnosed with "novel coronavirus infection" at the time of discharge; Patients who had received the COVID-19 vaccination; patients aged over 18 years. For patients with multiple test results during hospitalization, we selected the test result closest to the first day of hospitalization for analysis. For patients without test results during hospitalization, we selected the outpatient test result taken within 3 days closest to the first day of hospitalization for analysis.
Exclusion criteria: Pregnant patients were excluded. The diagnostic criteria for severe COVID-19 (11) are as follows: An adult meets any of the following criteria, with no explanation other than COVID-19 infection: (1) presents with dyspnea, with a respiratory rate ≥ 30 breaths/min; (2) resting state Oxygen saturation ≤ 93% when breathing room air; (3) arterial oxygen partial pressure (PaO2)/fraction of inspired oxygen (FiO2) ≤ 300 mmHg (1 mmHg = 0.133 kPa). For high-altitude areas (above 1000 meters), PaO2/FiO2 should be corrected using the formula: PaO2/FiO2 × [760/atmospheric pressure (mmHg)]; (4) progressive worsening of clinical symptoms, with lung imaging showing a clear progression of the lesion by more than 50% within 24 - 48 hours.
3.3. Data Collection
The following test parameters were selected: Medical history (cardiovascular disease, renal disease, hypertension, diabetes), demographic characteristics (age, gender), white blood cell (WBC) count, red blood cell (RBC) count, absolute lymphocyte count (ALC), absolute neutrophil count (ANC), absolute eosinophil count (AEC), absolute basophil count (ABC), absolute monocyte count (AMC), prothrombin time (PT), activated partial thromboplastin time (APTT), alanine aminotransferase (ALT), aspartate aminotransferase (AST), total bilirubin (T.Bil), alkaline phosphatase (ALP), total protein (TP), albumin (ALB), gamma-glutamyl transferase (γ.GT), globulin (GLB), and lactate dehydrogenase (LDH). The study also included the anti-HBc and HBsAg test results for each patient from 1 year prior to admission up to the time of discharge.
The acquisition of other experimental data was based on the following principles: For patients with multiple test results during hospitalization, we selected the test result closest to the first day of hospitalization for analysis. For patients without any test results during hospitalization, we selected the outpatient test result from within 3 days closest to the first day of hospitalization for analysis. The study was conducted retrospectively using hospital data.
3.4. Statistical Analysis
Data analysis, model building, and evaluation were performed using R version 4.2.1. Continuous variables that followed a normal distribution were expressed as mean ± standard deviation, while non-normally distributed continuous variables were expressed as median (interquartile range), and categorical variables were expressed as frequencies and percentages. The compare groups package was used to perform baseline analysis, with P < 0.05 considered statistically significant. The glmnet package was employed to perform Lasso binary logistic regression, and the minimum criterion with one standard error was used to select non-zero coefficients (12-14). The factors selected by Lasso binary logistic regression were included in a multivariable Logit regression model, with the glm package used for multivariable logistic regression analysis. The minimum Akaike information criterion (AIC) was utilized for model factor selection (15, 16).
The pROC, ggROC, and fbroc packages were used to perform discrimination analysis, drawing receiver operating characteristic (ROC) curves and calculating areas under the curve (AUC). The AUC was used to evaluate the discriminative power of the model. Calibration was performed using the val.prob function and calibrate from the rms package. The Hosmer-Lemeshow (HL) test was performed using the ResourceSelection package. The calibration curve, along with the HL test, was used to compare the observed probabilities and predicted probabilities. Decision curve analysis (DCA) and cross-validated DCA were performed using the rmda package, and DCA was used to evaluate clinical utility. The nomogram was created using the rms package, and the nomogram was used to present the research results.
4. Results
4.1. Statistical Analysis of Study Data
Based on the inclusion and exclusion criteria of the study, a total of 163 patients were included: Forty-four patients with severe COVID-19 pneumonia and 119 patients with non-severe pneumonia. The demographic and clinical characteristics of patients with severe and non-severe pneumonia are shown in Table 1. A total of 24 variables were included in the statistical analysis, and significant differences (P ≤ 0.05) were found between the two groups of patients in experimental parameters such as hypertension, WBC count, ALC, ANC, AEC, PT, AST, TP, ALB, and LDH.
| Characteristics | All; (N = 166) | Non-severe; (N = 119) | Severe; (N = 44) | P-Value |
|---|---|---|---|---|
| Cardiovascular disease | 0.353 | |||
| No | 118 (72.4) | 89 (74.8) | 29 (65.9) | |
| Yes | 45 (27.6) | 30 (25.2) | 15 (34.1) | |
| Renal disease | 0.290 | |||
| No | 153 (93.9) | 110 (92.4) | 43 (97.7) | |
| Yes | 10 (6.13) | 9 (7.56) | 1 (2.27) | |
| Hypertension | 0.046 | |||
| No | 63 (38.7) | 52 (43.7) | 11 (25.0) | |
| Yes | 100 (61.3) | 67 (56.3) | 33 (75.0) | |
| Diabetes | 0.127 | |||
| No | 99 (60.7) | 77 (64.7) | 22 (50.0) | |
| Yes | 64 (39.3) | 42 (35.3) | 22 (50.0) | |
| Gender | 0.473 | |||
| Male | 102 (62.6) | 72 (60.5) | 30 (68.2) | |
| Female | 61 (37.4) | 47 (39.5) | 14 (31.8) | |
| Age (y) | 78.0 [69.0; 85.0] | 77.0 [69.0; 84.5] | 82.0 [71.8; 87.0] | 0.117 |
| WBC count (× 109/L) | 7.53 [5.15; 9.71] | 6.88 [5.01; 9.04] | 8.27 [5.94; 10.6] | 0.046 |
| RBC count (× 1012/L) | 4.02 (0.74) | 4.04 (0.74) | 3.98 (0.75) | 0.642 |
| ALC (× 109/L) | 0.92 [0.64; 1.21] | 0.95 [0.71; 1.26] | 0.66 [0.34; 1.02] | < 0.001 |
| ANC (× 109/L) | 5.92 [3.67;7.92] | 5.24 [3.46;7.31] | 6.94 [5.46;9.20] | 0.002 |
| AEC (× 109/L) | 0.02 [0.00; 0.08] | 0.02 [0.01; 0.09] | 0.00 [0.00; 0.03] | 0.001 |
| ABC (× 109/L) | 0.01 [0.01; 0.02] | 0.01 [0.01; 0.02] | 0.01 [0.00; 0.02] | 0.288 |
| AMC (× 109/L) | 0.46 [0.31; 0.60] | 0.47 [0.32; 0.61] | 0.42 [0.29; 0.52] | 0.170 |
| PT(s) | 12.0 [11.2; 12.8] | 11.7 [11.0; 12.6] | 12.1 [11.8; 13.1] | 0.015 |
| APTT (s) | 30.5 [27.8; 33.6] | 30.3 [28.0; 33.6] | 31.0 [26.8; 33.0] | 0.707 |
| ALT (U/L) | 20.0 [14.9; 30.5] | 20.0 [14.7; 30.5] | 21.5 [15.0; 31.0] | 0.599 |
| AST (U/L) | 27.0 [20.0; 39.0] | 27.0 [20.0; 35.5] | 33.0 [23.8; 53.2] | 0.020 |
| T.Bil (μmol/L) | 9.80 [7.55; 13.8] | 9.80 [7.50; 13.9] | 9.60 [7.75; 13.3] | 0.914 |
| ALP (U/L) | 73.0 [60.0; 92.0] | 72.0 [60.5; 97.0] | 76.4 [59.0; 89.0] | 0.952 |
| TP (g/L) | 60.2 [56.6; 67.0] | 61.8 [57.7; 67.8] | 57.6 [53.9; 60.7] | < 0.001 |
| ALB (g/L) | 32.5 (4.93) | 33.3 (4.96) | 30.3 (4.13) | < 0.001 |
| γ.GT (U/L) | 29.0 [19.0; 43.5] | 27.0 [19.0; 43.5] | 32.0 [20.5; 43.2] | 0.619 |
| GLB (g/L) | 29.0 [25.0; 31.0] | 29.0 [26.0; 32.0] | 28.2 [24.0; 30.9] | 0.151 |
| LDH (U/L) | 273 [229; 382] | 258 [218; 324] | 326 [274; 468] | < 0.001 |
Differences in Demographic and Clinical Characteristics of Patients with Severe and Non-Severe COVID-19 Combined with Positive Anti-HBc and Negative HBsAg and HBeAg a
4.2. Construction of Predictive Model
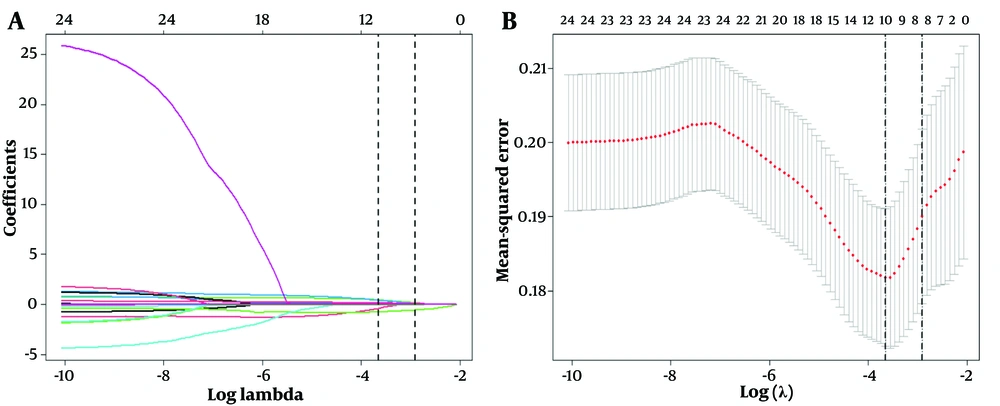
Lasso binary logistic regression was used for feature selection. Selecting a threshold of 1 standard error allows for choosing the smallest number of feature variables while still maintaining the model's predictive performance, thereby achieving model simplicity and interpretability. All factors were included in the Lasso binary logistic regression for screening, and eight non-zero coefficients were selected using a minimum of one standard error, including hypertension, diabetes, ALC, ANC, PT, AST, TP, and ALB (Figure 2).
Feature selection using LASSO binary logistic regression model with ten-fold cross-validation. A, a coefficient profile plot of the logarithmic (Lambda) sequence, displaying the Log (Lambda) values of 24 features in the LASSO model; B, a ten-fold cross-validation curve of the LASSO model. Using the minimum criterion (left dotted line) and the minimum criterion with one standard error (right dotted line) a vertical dotted line was drawn at the optimal value. The minimum criterion with one standard error was used to select 8 non-zero coefficients. LASSO is the abbreviation for Least Absolute Shrinkage and Selection Operator.
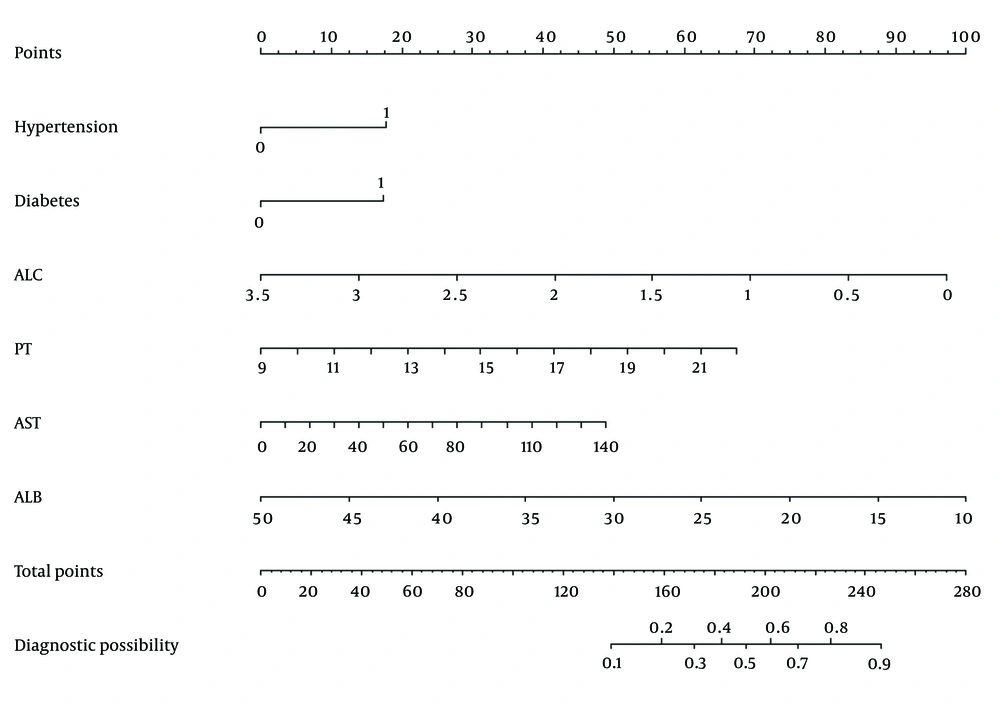
Multiple-factor backward logistic regression was used to construct a predictive model for patients with COVID-19 who were positive for anti-HBc and negative for HBsAg and HBeAg. The eight LASSO-selected factors were incorporated into a multivariable regression model. Using the minimum AIC, six factors were selected to construct the final model. Hypertension, diabetes, ALC, PT, AST, and ALB were finally included in the model (Table 2). A nomogram of the predictive model was plotted (Figure 3), and the total score of each patient was calculated based on the corresponding scores of different risk factors. Finally, the risk of a patient developing severe COVID-19 was determined based on the total score.
| Characteristics | B | SE | OR | CI | Z | P |
|---|---|---|---|---|---|---|
| Intercept | -0.711 | 2.068 | 0.491 | 0.491 (0.008 - 27.46) | -0.344 | 0.731 |
| Hypertension | 0.728 | 0.441 | 2.071 | 2.071 (0.891 - 5.084) | 1.652 | 0.099 |
| Diabetes | 0.714 | 0.419 | 2.041 | 2.041 (0.902 - 4.703) | 1.703 | 0.089 |
| ALC | -1.140 | 0.543 | 0.320 | 0.320 (0.105 - 0.886) | -2.097 | 0.036 |
| PT | 0.213 | 0.107 | 1.238 | 1.238 (1.018 - 1.559) | 1.996 | 0.046 |
| AST | 0.014 | 0.008 | 1.014 | 1.014 (0.998 - 1.032) | 1.712 | 0.087 |
| ALB | -0.103 | 0.045 | 0.902 | 0.902 (0.823 - 0.985) | -2.275 | 0.023 |
Multivariable Backward Logistic Regression Analysis of Patients with Severe and Non-severe COVID-19 Testing Positive for Anti-HBc and Negative for HBsAg and HBeAg
4.3. Analysis and Validation of the Constructed Model
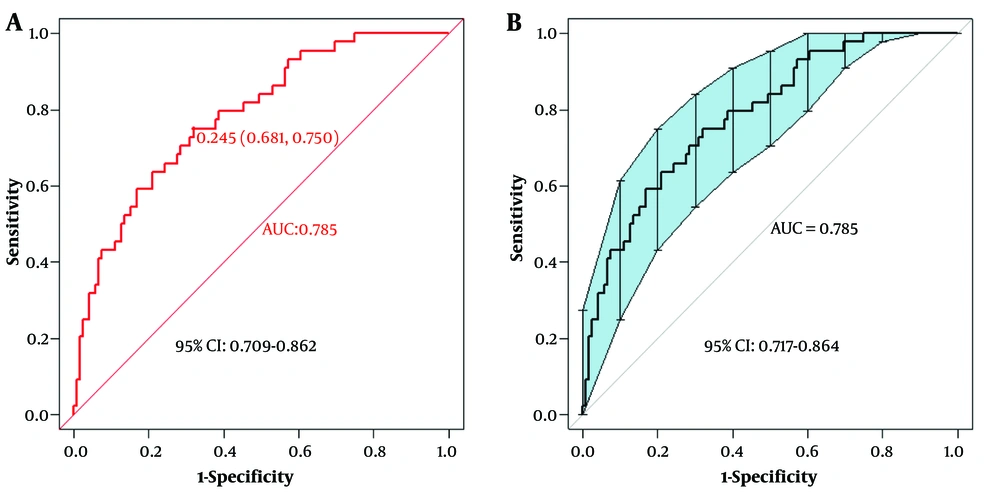
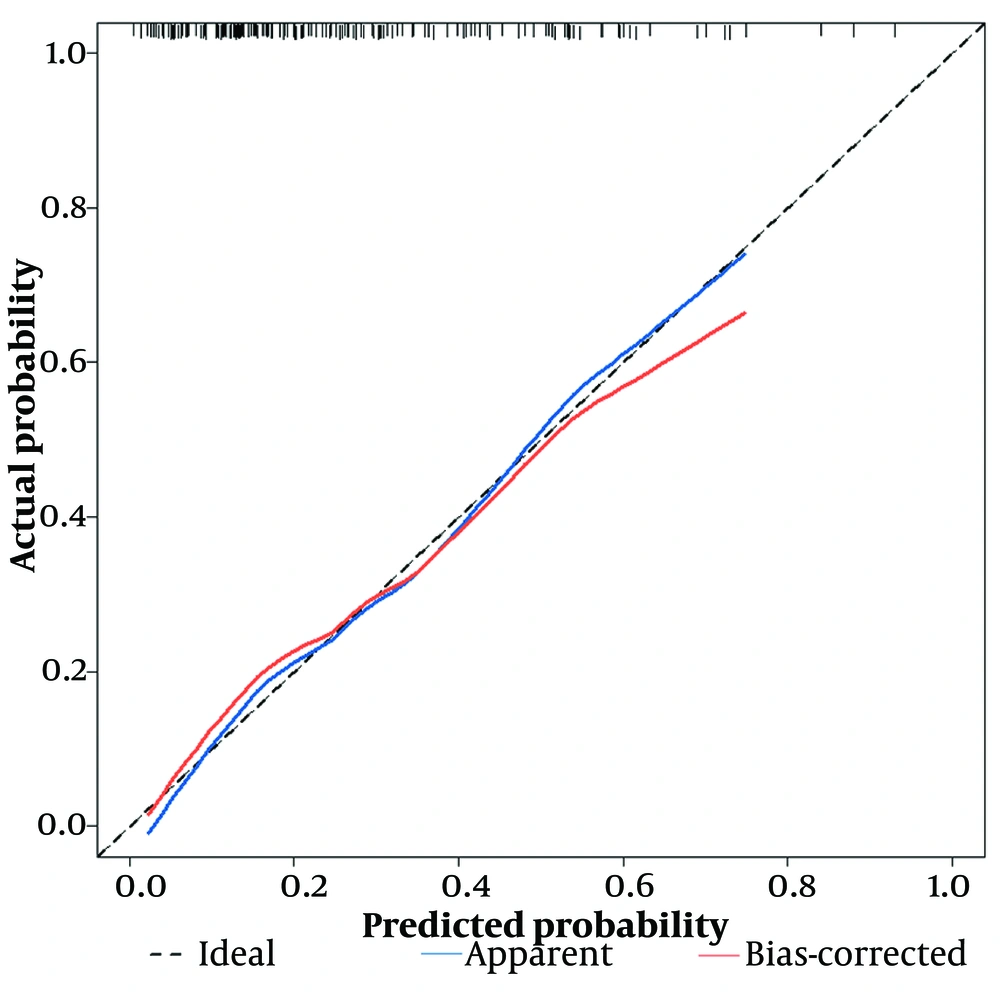
First, using the ROC curve, we assessed the model's ability to predict whether a patient will develop severe COVID-19 infection. The AUC of the predictive model was plotted, with the AUC of the model being 0.785 (95% CI: 0.709 - 0.862), and the AUC obtained from the 500-Bootstrap method for internal validation was 0.785 (95% CI: 0.717 - 0.864), indicating that the model has good discrimination (Figure 4). We evaluated and visualized the disparity between the model’s predicted values and actual values. The goodness of fit was assessed using the calibration curve, and the calibrated curve, based on the results of the 500-Bootstrap method for internal validation, was consistent with both the original and the ideal calibration curves (Figure 5).
The areas under the curve (AUC) values of the predictive model and the AUC value of the internal validation using the bootstrap method. A, the AUC value of the predictive model was 0.785, with a 95% confidence interval of (0.709 - 0.862); B, the AUC value of the model validated internally via 500-bootstrap method was 0.785, with a 95% confidence interval of (0.717 - 0.864).
The calibration curve of the predictive model, which was internally validated by the bootstrap sampling method. The black dashed line represents the ideal calibration curve, the blue solid line represents the original calibration curve, and the red solid line represents the calibration curve using 500-bootstrap method.
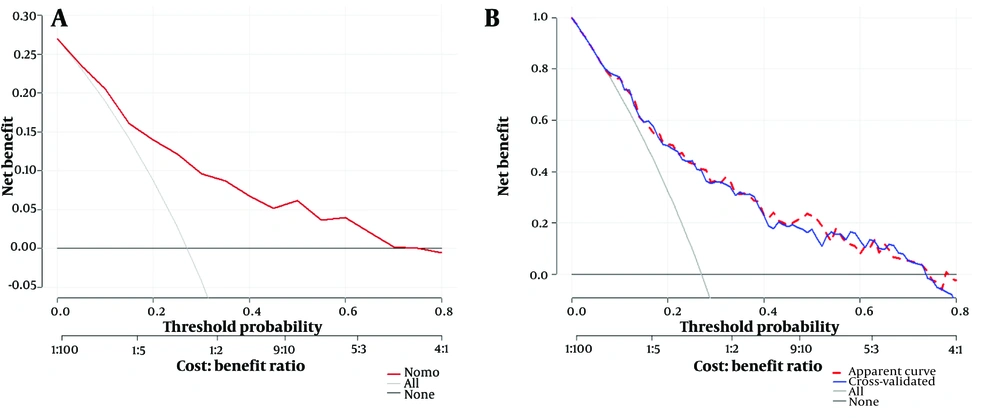
The horizontal axis represents predicted values, while the vertical axis represents actual values. The black dashed line represents the ideal calibration curve, the blue solid line labeled “Apparent” represents the fit between the model’s predicted values and actual values, and the red solid line labeled “Bias-corrected” indicates the fit between the model’s predicted values and actual values after calibration. The shape of the curve suggests good consistency between the model's predicted values and actual values. The calibration curve was further tested using the HL test, and the P-value was 0.868 (P > 0.05), indicating a high goodness of fit. The clinical applicability of the predictive model was evaluated via DCA (Figure 6).
The decision-curve analysis (DCA) and the 5-fold cross-validated DCA of the predictive model. A, the DCA of the predictive model using the 500-bootstrap method. The red line represents the diagnostic curve, the light solid line represents the overall positives, and the dark solid line represents the overall negatives; B, a five-fold cross-validation of the DCA. The red dashed line represents the DCA of the predictive model; the blue solid line is the DCA of cross-validation; the light solid line indicates overall positives, and the dark solid line represents overall negatives.
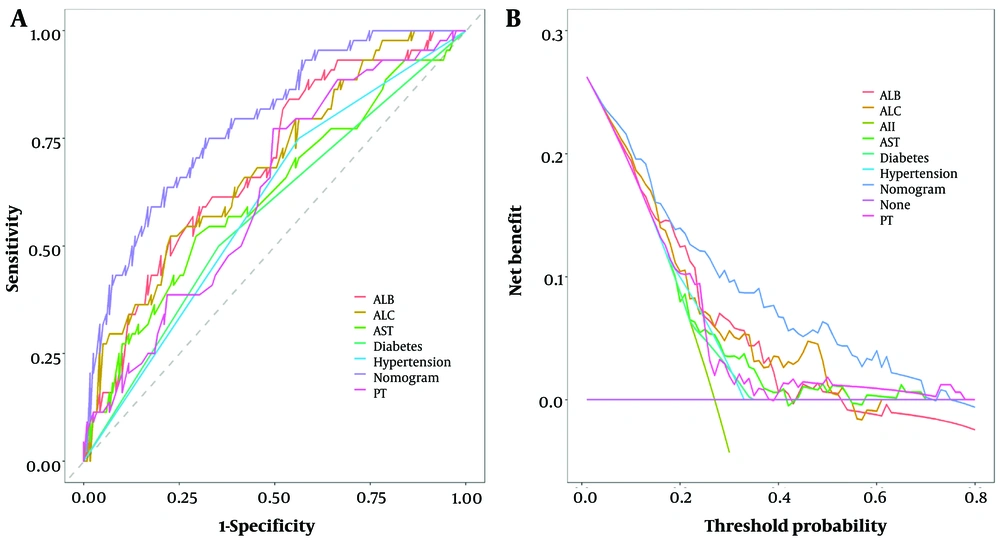
When the threshold probability ranged between 5% and 75%, the net benefit was enhanced using this diagnostic curve. The DCA was also validated via 5-fold cross-validation, showing a high degree of consistency with the predictive model, indicating high model performance. Finally, a rationality analysis of the predictive model (Figure 7) showed that the AUC of the predictive model was higher than that of any single predictive factor. The constructed model demonstrated superior performance in predicting whether a patient will develop severe COVID-19 infection compared to a single factor alone. Additionally, the DCA of the predictive model was higher than that of a single factor. The results demonstrated that, within the model’s threshold probability range, it provides a better net benefit to the clinic compared to a single-factor model.
5. Discussion
This study developed a personalized nomogram for predicting COVID-19 infection in patients testing positive for anti-HBc and negative for HBsAg and HBeAg antibodies. We carried out internal validation of the model. We identified six easily assessable variables, including hypertension, diabetes, ALC, PT, AST, and ALB, which can be used for clinical prediction of the risk of COVID-19 in patients testing positive for anti-HBc and negative for HBsAg and HBeAg developing into severe pneumonia. The model demonstrated good discrimination, calibration, and clinical applicability in predicting progression to severe pneumonia. In addition, the DCA showed that the model can be used to make significant clinical decisions across a wide range of probability thresholds.
According to the European Association for the Study of the Liver (EASL), HBV infection can progress in five stages that are not necessarily consecutive. In some patients, an HBsAg-negative phase may occur, known as "occult HBV infection," which is defined as the absence of serum HBsAg but the presence of anti-HBc, with or without anti-HBs, and with or without detectable serum HBV DNA. However, patients in this stage may have covalently closed circular DNA (cccDNA) in their liver. These patients may experience reactivation of HBV infection if they receive immunosuppressive therapy (17).
The American Gastroenterological Association (AGA) Institute has published guidelines for the prevention and management of HBV reactivation during immunosuppressive therapy. According to the dosage and duration of immunosuppressive medication use, the risk of HBV reactivation is classified into high, moderate, and low levels. For moderate-risk patients, the AGA suggests that antiviral HBV treatment should be continued for 6 months after discontinuation of immunosuppressive therapy. For low-risk patients, the AGA recommends against routinely using prophylactic anti-HBV treatment but advises monitoring HBV DNA levels during immunosuppressive therapy to detect HBV reactivation and identify liver function abnormalities as early as possible (18). However, due to the strain the pandemic has placed on the healthcare system, it cannot be ensured that low-risk patients will receive proper follow-up care after discharge, especially elderly patients returning to long-term care facilities. Moderate-risk patients who do not receive prophylactic treatment are at risk of HBV reactivation. Table 1 shows that the majority of admitted COVID-19 patients are elderly males, which is also a risk factor for HBV reactivation (19). Severe acute respiratory syndrome coronavirus 2 infection can cause significant lymphocyte depletion, increasing the likelihood of HBV reactivation (20). Therefore, evaluating the risk factors for severe COVID-19 in these patients can help develop a reasonable immunotherapy plan, as well as HBV prophylaxis and monitoring regimens, which can improve the prognosis of patients with anti-HBc positivity concurrent with COVID-19 infection. At the same time, this reminds clinicians to pay more attention to patients with positive anti-HBc.
Therefore, the management of anti-HBc-positive patients should be strengthened to reduce the impact of HBV on liver function. Abnormal liver function is a risk factor for mortality in patients with COVID-19 (21). The results of univariate analysis showed that AST levels were elevated in severe COVID-19 cases compared to non-severe cases (P ≤ 0.05), and TP and ALB levels were decreased in severe patients compared to non-severe cases (P ≤ 0.05), which is consistent with the results of other studies (21, 22). This suggests that further quantitative testing of anti-HBc-positive patients for Hepatitis B core antibody is necessary to determine whether the patient has occult Hepatitis B. Some studies have suggested that the use of angiotensin-converting enzyme inhibitors may increase the risk of severe COVID-19. Our model identified hypertension and diabetes as risk factors for severe COVID-19, which is consistent with the results of other studies (23, 24). This suggests that alternative treatment options, such as calcium channel blockers, may be considered for these patients (25). A decrease in ALC is a high-risk factor for severe COVID-19, which is consistent with other research findings (26, 27).
The diagnosis and treatment plan for novel coronavirus infection (10th edition, trial implementation), jointly issued by the General Office of the National Health Commission and the Comprehensive Department of the National Administration of Traditional Chinese Medicine on January 5, 2023, pointed out that a decrease in lymphocyte count is an early warning sign of severe/critical COVID-19. Thrombocytopenia, moderately prolonged PT, and elevated D-dimer are coagulation abnormalities associated with COVID-19 infection. This may be due to elevated von Willebrand factor levels in patients with COVID-19, leading to a deficiency of the von Willebrand factor-cleaving protease ADAMTS13 (A disintegrin and metalloproteinase with thrombospondin motifs 13), resulting in platelet aggregation and microthrombus formation, followed by activation of the fibrinolysis system and elevation of D-dimer levels (28). This study also evaluated factors such as occupation, education level, marital status, and alcohol consumption, and found that alcohol consumption increased the risk of severe COVID-19 by 3.52-fold (29). In the future, we may include additional parameters and data to construct a more comprehensive model for clinical prediction and conduct multicenter studies to externally validate the model for improved predictive accuracy.
5.1. Conclusions
Our model, constructed using routine clinical laboratory tests, achieved an AUC of 0.785 and demonstrated good calibration, clinical applicability, and rationality. The nomogram we developed using only six variables achieved high accuracy, facilitating rapid clinical detection of patient risk factors and the development of individualized treatment plans. However, this study has limitations. It is a retrospective single-center analysis, and the sample selection only included patients from our hospital, resulting in a small sample size. In future studies, it would be beneficial to design multicenter experiments to further validate the aforementioned research findings. In the subsequent multicenter study, external validation of the model results can be conducted using data from other hospitals. This will help to reduce the model's bias and enhance its generalizability.
