


1. Background
Human T-cell lymphotropic virus type 1 (HTLV-1) is a member of the retrovirus family, which was first diagnosed in patients suffering from cutaneous T-cell lymphomas (1, 2). This virus has infected the human population for more than 20,000 years. This retrovirus can be transmitted through sex, from mother to child, and through blood transfusion. The virus involves lymphocytes, affects multiple organs through lymphocytes’ movement, and causes various clinical manifestations (3). The Middle East is known today as an endemic region for HTLV-1 (4, 5). Although most patients with HTLV-1 infection have no clinical symptoms, the prevalence of severe diseases like adult T-cell leukemia/lymphoma (ATLL) and HTLV-1-associated myelopathy/tropical spastic paraparesis (HAM/TSP) is not remarkable, but their prognosis is poor. The mortality rate of ATLL patients is high because their treatment is very difficult. Therefore, a better understanding of HTLV-1 pathogenesis can lead to finding new ways for treatment (6, 7).
Bioinformatics is an interdisciplinary science that connects biological data with techniques for storing, distributing, and analyzing information to reinforce various fields of scientific experiments, such as biomedicine. Bioinformatics is fortified by high-throughput data-production investigations, such as the assessment of gene expression patterns and genomic sequence determinations (8, 9). Although the mechanisms of HTLV-1 are not yet fully understood, it has been assumed that various immunological responses, different interactions between the patient's body and the virus, and clearly the virus itself, are responsible for pathogenesis (10, 11). Evaluation of genetic background, cytokines, and pathways of HTLV-1 helps us to find better ways for diagnosis and treatment of this virus.
2. Objectives
To prevent and manage the consequences of this oncogenic virus, we should clearly understand the molecular pathways and interactions between the HTLV-1 virus and human cells. Since few studies evaluate the exact role of miRNAs and their targets in HTLV-1, this study aimed to run a high-throughput miRNA expression dataset to identify the key miRNAs and their target genes in HTLV-1 pathogenesis and find signaling pathways through which HTLV-1 affects the human body.
3. Methods
3.1. MicroRNA Expression Microarray Dataset and Different Expressions Analysis
The miRNA sample of CD4 T cells, including individual platforms with Accession number GSE31629, GPL 7731, was derived from the Gene Expression Omnibus (12) database. The dataset contains 62 separate samples of 40 ATLL patients and 22 healthy humans. Different expressions (DEMs) were identified between datasets. The first 48 miRNAs with higher expression variance values were selected. The DEMs were selected based on Benjamini-Hochberg FDR-adjusted P-values < 0.05.
3.2. Initial Pathway Analysis
DIANA-mirPath V3 was used to conduct the initial pathway analysis. The TarBase database V.7 and microT-CDS database V5 were used for pathway prediction. Heatmap plots from DIANA were generated using the pheatmap package in R 3.6.3. The common miRNA from heatmap results was obtained using a Venn diagram. A P-value < 0.05 was considered significant.
3.3. Predicting Genes Targeted by miRNAs and Constructing the Protein-Protein Interaction (PPI) Network
The miRDB online tool was used to find miRNA target genes. miRNA gene targets were sorted based on target rank. The target score for selected miRNA targets was obtained. The first gene symbols with target scores of 80 - 100 were selected. To form protein-protein interactions, the STRING database was used. The PPI network of chosen DEM target genes was created using Cytoscape-v3.8.0. The subnetwork was built in accordance with the first 267 proteins with higher degree values and betweenness. Nine modularities were obtained.
3.4. Functional Gene Enrichment and Proposal of Signaling Pathway
To perform gene analysis, the ENRICHR online tool was used. Genes related to the desired signaling pathway were selected based on enrichment results. The KEGG database was used to define cellular pathways and interactions among proteins.
3.5. Study Population and Sample Collection
This study was conducted on thirty participants [10 ATLL, 10 asymptomatic carriers (ACs), and 10 healthy individuals]. The ATLL patients were admitted to Shariati Hospital, Tehran, and Tehran province, Iran. The data for ACs and healthy participants were gathered from the Tehran Blood Transfusion Center. The inclusion criteria for healthy participants were no previous medication, no other diseases, no acute infection, no genetic disorders, and no history of vaccination during the last six months. The inclusion and exclusion criteria for ACs were similar to those for healthy participants, plus a positive PCR or ELISA test for HTLV-1. The ATLL patients were diagnosed based on the latest version of World Health Organization criteria and oncologist opinion. The healthy participants were chosen with negative ELISA and PCR tests and no clinical manifestations. They also must not have symptoms of acute infection and a history of vaccination during the last six months. Informed consent was obtained for experimentation with human subjects/samples.
3.6. RNA Extraction and cDNA Synthesis
Whole blood samples from 10 ATLL patients, 10 ACs, and 10 healthy individuals were acquired. Peripheral blood mononuclear cells (PBMCs) were isolated from EDTA-treated blood samples using a Ficoll density gradient. mRNAs were extracted from PBMCs using RNJia PB (ROJE Company). cDNAs were synthesized using random primers and reverse transcriptase based on RT-ROSET manufacturer guidelines (ROJE Company). To evaluate the accuracy of RNA extraction, RPLP0 gene amplification was used, confirming the accuracy of both cDNA synthesis and RNA extraction.
3.7. Oligonucleotide Designing and Real-time PCR
A real-time PCR assay was performed to calculate RPLP0, transforming growth factor-beta 1 (TGF-β1), TGF-BR1, and TGF-BR2 in both carrier and healthy groups, along with ATLL patients, using specific primers by Real-Time PCR in a Q 6000 Rotor-Gene machine (Qiagen, Germany). Table 1 displays the nucleotide sequence of primers. RPLP0 was relatively measured from 5-point standard curves. To calculate the normalized value of each gene expression, the Expression Index was used. The Expression Index is defined as the ratio of the relative copy number of the mRNA of interest to the relative mRNA copy number of the reference gene.
| Targeted Genes | Sequence (5 |
|---|---|
| TGF-β | |
| Forward | GCCGACTACTACGCCAAGGA |
| Reverse | GAGCAACACGGGTTCAGGTAC |
| TGF-βR1 | |
| Forward | GCAGAGCTGTGAAGCCTTGAG |
| Reverse | GCCTTCCTGTTGACTGAGTTGC |
| TGF-Βr2 | |
| Forward | AGGGCATCCAGATGGTGTGTGA |
| Reverse | GCTCCAGCTCACTGAAGCGTTC |
| HBZ | |
| Forward | ACGTCGCCCGGAGAAAACA |
| Reverse | CTCCACCTCGCCTTCCAACT |
| LTR | |
| Forward | GGCTCGCATCTCCCCTTCAC |
| Reverse | GAGCAAGCAGGGTCAGGCAA |
The Nucleotide Sequences of the Specific Primers and Probes for Transforming Growth Factor-Beta, TGF-βR1, TGF-βR2, HBZ, and LTR
3.8. Statistical Analysis
The experimental results are statistically presented as the mean ± SD. Data analysis was carried out using Prism-GraphPad software. The Kolmogorov-Smirnov test was conducted to evaluate the normality of the variable distributions. The Kruskal-Wallis test was used to compare the data between the groups and to assess the correlation of the parameters. P-values lower than 0.05 were considered statistically significant.
4. Results
4.1. Different Expressions Analysis
Fifty miRNAs were finally selected, and the heatmap plot of their expression based on variances of expression was obtained. Ultimately, 49 DEMs with an absolute value of logFC greater than 2.5 were determined (Box 1).
| miRNA ID |
|---|
| hsa-miR-146b-5p |
| hsa-miR-451 |
| hsa-miR-151-5p |
| hsa-let-7b |
| hsa-let-7c |
| hsa-miR-29c |
| hsa-miR-26a |
| hsa-miR-342-3p |
| hsa-miR-181a |
| hsa-miR-29a |
| hsa-miR-28-5p |
| hsa-let-7g |
| hsa-miR-92a |
| hsa-miR-199a-3p |
| hsa-miR-342-5p |
| hsa-miR-30b |
| hsa-miR-221 |
| hsa-miR-320a-5p |
| hsa-miR-361-5p |
| hsa-miR-423-5p |
| hsa-miR-20a |
| hsa-miR-17 |
| hsa-miR-10A |
| hsa-miR-125B |
| hsa-miR-212 |
| hsa-miR-140-3p |
| hsa-miR-20b |
| hsa-let-7a |
| hsa-miR-186 |
| hsa-miR-148b |
| hsa-miR-361-3p |
| hsa-miR-150 |
| hsa-miR-26b |
| hsa-miR-101 |
| hsa-miR-103 |
| hsa-miR-30d |
| hsa-miR-30c |
| hsa-miR-24 |
| hsa-miR-27a |
| hsa-miR-374a |
| hsa-let-7f |
| hsa-miR-19b |
| hsa-miR-494 |
| hsa-miR-324-3p |
| hsa-miR-23b |
| hsa-miR-98 |
| hsa-miR-142-3P |
| hsa-miR-210 |
| hsa-miR-99A |
List of Differentially Expressed miRNAs with logFC Greater than 2.5
4.2. Initial Pathway Analysis
To identify biologically significant miRNAs, the relationship between DEMs and biological pathways was explored. The data were analyzed in DIANA based on TarBase and microTCDS. The heatmap results were obtained, and mir-20a-5p was found to be related to all desired pathways. The target genes of mir-20a-5p, along with their scores and target ranks, were calculated, and 685 genes with target scores of 80 - 100 were selected using ENRICHR. The combined score of each signaling pathway was calculated and presented in Table 2. Desired signaling pathways were chosen using both Heatmaps and ENRICHR.
| Term | Combined Score |
|---|---|
| Axon guidance | 78.98587 |
| MAPK signaling pathway | 41.74268 |
| Circadian rhythm | 117.4687 |
| Endocytosis | 26.76269 |
| Autophagy | 26.86101 |
| TGF-beta signaling pathway | 29.91466 |
| RNA degradation | 16.61342 |
| Cholesterol metabolism | 19.22018 |
| Gastric acid secretion | 2.09712 |
The Combined Score of Each Signaling Pathway
4.3. Construction of the PPI Network and Extraction of the PPI Sub-network
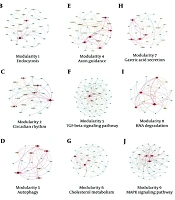
The protein-protein interaction network was used to demonstrate the strong relationships between DEMs. This network contains 266 nodes and 1134 edges (Appendix 1 in Supplementary File). The size of the nodes represents the degree of each node, and the color of each node indicates the level of expression of each protein. Based on Cytoscape results, the sub-networks were obtained. Nine modularities were identified: Modularity 1 is the endocytosis pathway, modularity 2 is the circadian rhythm pathway, modularity 3 is the autophagy pathway, modularity 4 is the axon guidance pathway, modularity 5 is the transforming growth factor-beta (TGF-β) pathway, modularity 6 is cholesterol metabolism, modularity 7 is the gastric acid secretion pathway, modularity 8 is the RNA degeneration pathway, and modularity 9 is the MAPK signaling pathway (Figure 1A - J).
 in human T-cell lymphotropic virus type 1 (HTLV-1) infected cases; B, modularity 1: Endocytosis; C, modularity 2: Circadian rhythm pathway; D, modularity 3: Autophagy pathway; E, modularity 4: Axon guidance pathway; F, modularity 5: Transforming growth factor-beta (TGF-β) pathway; G, modularity 6: Cholesterol metabolism; H, modularity 7: Gastric acid secretion pathway; I, modularity 8: RNA degeneration pathway; J, modularity 9: MAPK signaling pathway.")
A, Protein-protein interaction network of different expressions (DEMs) in human T-cell lymphotropic virus type 1 (HTLV-1) infected cases; B, modularity 1: Endocytosis; C, modularity 2: Circadian rhythm pathway; D, modularity 3: Autophagy pathway; E, modularity 4: Axon guidance pathway; F, modularity 5: Transforming growth factor-beta (TGF-β) pathway; G, modularity 6: Cholesterol metabolism; H, modularity 7: Gastric acid secretion pathway; I, modularity 8: RNA degeneration pathway; J, modularity 9: MAPK signaling pathway.
4.4. Functional Gene Enrichment and Proposal of Signaling Network
Mir-20a-5p targets the TGF-β signaling pathway. The TGF-β signaling pathway was identified by both heatmap plots and ENRICHR. According to enrichment results, genes and proteins related to the TGF-β signaling pathway were determined. SMAD4, BMPR2, RBL1, ZFYVE9, BAMBI, MAPK1, RGMB, E2F5, SMAD5, RGMA, and TGFBR2 are the genes involved in the TGF-β enriched signaling pathway.
4.5. Descriptive Analysis of Patients
The study evaluated host-microbe interactions using gene expression measurements in 10 healthy participants, 10 ACs, and 10 ATLL patients. The mean age in the ATLL group was 53.4 ± 12.98, in the ACs was 53.9 ± 6.641, and in the healthy group was 57.2 ± 2.936. There was no significant relationship between groups according to age (P = 0.43). In the ATLL group, 20% were females and 80% were males, while in both the ACs and healthy groups, all participants were males. Therefore, there were significant differences in gender between groups (P < 0.05) (Table 3).
| Variables | Normal | ACs | ATLL | P-Value |
|---|---|---|---|---|
| Age | 57.2 ± 2.936 | 53.9 ± 6.641 | 53.4 ± 12.98 | 0.43 |
| Gender | 0.05 | |||
| Female | 0 | 0 | 2 (20) | |
| Male | 10 (100) | 10 (100) | 8 (80) |
Demographic Characteristics (Gender and Age of Adult T-Cell Leukemia/Lymphoma Patients, ACs and Healthy Donors) a
4.6. Expression Level of Transforming Growth Factor-Beta 1 Among Healthy, Asymptomatic Carriers, and Adult T-Cell Leukemia/Lymphoma
The expression level of TGF-β1 in ATLL patients was lower than in the ACs and healthy group, but it was not clinically significant (P = 0.5092). Additionally, the expression level of TGF-β1 was higher in healthy participants compared to ACs (Figure 2A).
 among healthy, asymptomatic carriers (ACs) and adult T-cell leukemia/lymphoma (ATLL); B, expression level of TGFBR1 among healthy, ACs and ATLL; C, expression level of TGFBR2 among healthy, ACs and ATLL")
A, Expression level of transforming growth factor-beta 1 (TGF-β1) among healthy, asymptomatic carriers (ACs) and adult T-cell leukemia/lymphoma (ATLL); B, expression level of TGFBR1 among healthy, ACs and ATLL; C, expression level of TGFBR2 among healthy, ACs and ATLL
4.7. Expression Level of TGFBR1 Among Healthy, Asymptomatic Carriers, and Adult T-Cell Leukemia/Lymphoma
The expression level of TGFBR1 in ATLL patients was higher than in the ACs and healthy group, and this difference was clinically significant (P = 0.0011). Additionally, the expression level of TGFBR1 was higher in ACs compared to healthy participants (Figure 2B).
4.8. Expression Level of TGFBR2 Among Healthy, Asymptomatic Carriers, and Adult T-Cell Leukemia/Lymphoma
The expression level of TGFBR2 in ATLL patients and ACs was lower than in the healthy group, and this difference was clinically significant (P = 0.0436). Furthermore, the expression level of TGFBR2 was lower in ACs compared to healthy participants (Figure 2C).
5. Discussion
One of the most important results of our study was the role of TGFBR1 in ATLL. The TGFBR1 gene commands the synthesis of TGF-β receptor type 1 protein. The function of this receptor is to transmit signals from the cell surface into the cell via the signal transduction process (13, 14). Since TGFBR1 prevents cells from growing and dividing too rapidly, it can function as a tumor suppressor (15). We found that TGFBR1 gene expression is significantly higher in ATLL patients than in ACs and healthy donors. However, contrary to our results, some studies have demonstrated that decreased TGFBR1 signaling may contribute to cancer progression (16, 17). We hypothesize that TGFBR1 expression increases to defend against cancer cells but cannot overcome them, resulting in higher gene expression than in healthy donors. Another possible explanation is the difference in the type of cancer.
The TGFBR2 gene encodes TGF-β receptor type 2, which is part of the serine/threonine protein kinase family. TGFBR2 is a transmembrane protein receptor with a protein kinase domain that forms a heterodimeric complex with another receptor protein and links TGF-beta. This receptor/ligand complex regulates cell proliferation through protein phosphorylation (18, 19). Mutations in this gene are associated with various diseases, including the development of different types of tumors (20). We found that the expression level of TGFBR2 in ATLL patients and ACs was significantly lower than in healthy donors. Our results suggest that TGFBR2 acts as a tumor suppressor. Consistent with our study, several studies have shown that a decrease in TGFBR2 expression level is associated with higher grades of cancer (21-23). We can conclude that in the early stages of cancer, TGFBR2 acts as a tumor suppressor.
One of the vital signaling networks is the transforming growth factor TGF‐β signaling pathway, which plays an essential role in cell proliferation, inflammation, apoptosis, angiogenesis, and tumor genesis (24). Although the level of TGF-β is nearly the same in ATLL patients and healthy humans (25), in vitro studies show that in ATLL patients, the expression of TGF-β mRNA and secretion of TGF-β is higher than in healthy humans (26-28). While TGF-β usually inhibits cell proliferation (29), it has no inhibitory effect on the proliferation of T-cells infected with HTLV-1 (30).
Transforming growth factor-beta (TGFβ) is a pleiotropic multifunctional cytokine secreted from epithelial cells and fibroblasts (31, 32). When TGF-β family ligands bind to the active TGFβ type II serine/threonine kinase receptor (TβRII), they recruit the type I receptor (TβRI) and form a stable oligomeric receptor complex. The formation of this complex causes the type II receptor to phosphorylate the type I receptor. This phosphorylation activates the type I receptor-kinase through structural changes. SMAD2/3 phosphorylation results in binding to SMAD4 and the creation of a signaling complex, which translocates to the nucleus to induce downstream changes in gene expression through the canonical signaling pathway.
After nuclear translocation, to regulate gene expression, the SMAD complex binds to other transcription factors or chromatin-remodeling proteins. Transforming growth factor-beta 1 also functions through a plethora of noncanonical SMAD-independent pathways, including the mitogen-activated protein (MAP) kinase pathway, which signals via extracellular signal–regulated kinase 1/2 or TGF-β–activated kinase 1 (TAK1) (33, 34). Several studies have demonstrated that TGF-β is deregulated in cancers and plays an essential role in tumor initiation and progression. In the early stage of tumors, TGF-β acts as a tumor suppressor through its antiproliferative effects, while in the later stages, it acts as a tumor promoter, aiding tumor metastasis through an autocrine TGF-β loop (35, 36).
Among the three TGF-β isoforms, TGF-β1 is the most essential, controlling differentiation, hemostasis, and the development of other immune cells. Transforming growth factor-beta 1 is a potent inhibitor of cell proliferation in most endothelial, epithelial, and hematopoietic cells, such as T lymphocytes. Transforming growth factor-beta 1 suppresses tumor cells in their early stages. However, tumor cells develop mechanisms to escape the inhibitory effects of TGF-β1. Some mutations occur in TGF-β receptors, for example, downstream in TGFBR1 and TGFBR2, SMAD2, and SMAD4, which occur in metastatic colon cancer and pancreatic cancer (37).
Kim et al. found that in ATL cells, TGF-β is overproduced, and the main isoform secreted by these cells is TGF-β1. Cytokines such as IL-10 and TGF-β suppress the immune system in ATLL patients. Although the TGF-β level in the serum of ATLL patients is not significantly higher than in healthy people, in vitro studies of ATLL cell culture and long-term ATLL T-cell lines have proven that ATLL cells express TGF-β mRNA and secrete TGF-β cytokines. Although TGF-β is a well-known cell proliferation inhibitor, it cannot prevent the spontaneous proliferation of HTLV-1-infected T cells. Kim et al. found that the expression of TGF-β1 in leukemic cells of ATLL patients and HTLV-1-infected T-cells is high (28).
Following our study, Javle et al. found that the TGF-β signaling pathway plays an important role in pancreatic cancer. They demonstrated that the TGF-β1 plasma level was high in pancreatic cancer; however, the expression level of TGFBR2 and SMAD4 was not related to pancreatic cancer (38). Hadi et al. showed that TGFBR1 and TGFBR2 have crucial roles in chronic lymphocytic leukemia (CLL), and five deregulated miRNAs, including mir-574, mir-499, mir-125b, mir-106a, and mir-9, are involved in CLL pathogenesis (39).
Mir-20a-5p is a component of the mir-17-92 cluster, which is associated with many kinds of cancers. Overexpression or downregulation of miR-20a-5p participates in downstream signaling pathways, such as PI3K-Akt, MAPK, and TGF-β signaling pathways. Controlling incessant proliferation signals, evading growth inhibition, activating invasion and metastasis, enabling limitless replication, promoting angiogenesis, resisting cellular death, and avoiding immune destruction are mechanisms of miR-20a-5p (12). Wei Huang et al. have demonstrated that deregulated miRNAs are one of the vital causes of cancers, making them biomarkers for cancer diagnosis and prognosis (40).
In this study, we identified the TGF-β signaling pathway as the most important signaling pathway in ATLL pathogenesis. Mohadeseh Valizadeh et al. demonstrated that downregulation in the TGF-β signaling pathway is associated with sulfur mustard (SM) skin lesions. They showed that TGF-β, TGFBR2, and their functional miRNAs, including mir-20a and mir-21a, contribute to SM lesions (41). Zhang et al. determined that mir-20a is an independent prognostic and therapeutic factor for colorectal cancer (42). In this study, we also demonstrated that SMAD4, BMPR2, RBL1, ZFYVE9, BAMBI, MAPK1, RGMB, E2F5, SMAD5, RGMA, and TGFBR2 genes are involved in the TGF-β signaling pathway. TGF-beta family members, which include TGF-betas, bone morphogenetic proteins (BMPs), and activins, are structurally related secreted cytokines with a broad spectrum of cellular functions (43, 44).
5.1. Conclusions
In this study, which resulted from the bioinformatic analysis of high-throughput microarray data, it was determined that TGFBR1 has a more active role than TGFBR2 and even TGF-beta itself. Additionally, Mir-20a-5p and the genes SMAD4, BMPR2, RBL1, ZFYVE9, BAMBI, MAPK1, RGMB, E2F5, SMAD5, RGMA, and TGFBR2 were identified as main genes in the TGF-beta signaling pathway. More studies are needed to further clarify the role of TGFBR1.
