


1. Background
Coronavirus disease 2019 (COVID-19) is a viral disease caused by severe acute respiratory syndrome coronavirus 2 (SARS-CoV-2). The COVID-19 has resulted in more than 6 million deaths worldwide. After the initial cases were reported in Wuhan, Hubei province, China, in late December 2019, SARS-CoV-2 rapidly spread globally, prompting the World Health Organization (WHO) to declare a pandemic on March 11, 2020 (1). The SARS-CoV-2 variant and genomic surveillance data have been monitored by the centers for disease control and prevention (CDC) (2). The Alpha (B.1.1.7) variant was the first variant of concern, identified in the United Kingdom (UK) in late December 2020. The Beta variant (B.1.351) was first reported in South Africa in December 2020. The Delta variant (B.1.617.2) emerged in India in December 2020, and the Omicron variant (B.1.1.529) was identified in South Africa in November 2021 (3, 4).
The significant role of certain hematological parameters during the disease course has been recognized. Platelet, lymphocyte (LYM), hemoglobin, eosinophil (EOS), and basophil counts, along with increased neutrophil (NEU) counts and NEU-to-LYM and platelet-to-LYM ratios, have been associated with COVID-19 (5). Peripheral blood-derived biomarkers of inflammation, such as white blood cell (WBC) count, NEU-to-lymphocyte ratio (NLR), platelet-to-lymphocyte ratio (PLR), and serum C-reactive protein (CRP) levels, have been investigated as independent predictors of the prognosis of systemic inflammatory diseases. Increases in these levels have been linked to mortality (6, 7). The main symptoms of COVID-19, including inflammatory cytokine storm, multiple organ failure, and acute respiratory distress syndrome (ARDS), encompass high fever, shortness of breath, lymphopenia, and elevated cytokines [(IL-1β, TNF-α, interleukin-6 (IL-6)], serum ferritin, D-dimers, and CRP levels (8, 9).
2. Objectives
The present study aimed to examine the changes in CRP, IL-6, WBC, NEU, LYM, and EOS levels in patients infected with SARS-CoV-2 variants.
3. Methods
3.1. Study Population
The study retrospectively evaluated the CRP, IL-6, WBC, NEU, LYM, and EOS in SARS-CoV-2 positive patients and SARS-CoV-2 mutations who presented to our hospital between 2020 and 2023. A total of 40,133 patients were included in the study (9).
3.2. Inclusion and Exclusion Criteria
Patients over the age of 18, who tested positive for SARS-CoV-2 using reverse transcription (RT)-PCR and had molecular variant analysis conducted, were included. Pediatric patients were excluded.
3.3. Severe Acute Respiratory Syndrome Coronavirus 2 Analysis
The study was conducted in our hospital’s laboratory using RT-PCR kits (Bio-Rad Laboratories, USA) to detect SARS-CoV-2 in nasopharyngeal samples from patients.
3.4. Molecular Variant Analysis
The SARS-CoV-2 Alpha and Beta variants were identified using the Bio-Speedy® SARS-CoV-2 Variant Plus Kit (Bioeksen AR-GE Technologies, Turkey), which targets the N gene, ORF1ab regions, and variant-specific genome regions found only in B.1.1.7, B.1.351, and P.1 (SE484K Beta/Gamma, N31-33, and SL452R Delta, RNAase P internal quality control). The CFX96 DX real-time PCR systems (Bio-Rad Laboratories, USA) were utilized for this purpose. The SARS-CoV-2 Delta and Omicron variants were analyzed via 16S ribosomal RNA (rRNA) using the Illumina MiSeq sequencing technique. Serum and blood samples from the patients were analyzed for CRP (Cobas 702, Roche), IL-6 (Cobas 802, Roche), WBC, NEU, LYM, and EOS values using the Mindray 6800 Plus device analyzer. All data were recorded.
3.5. Statistical Analysis
For statistical analysis, the number Cruncher statistical system (NCSS) 2020 statistical software (NCSS LLC, Kaysville, Utah, USA) program was used to evaluate the findings obtained in the study. Quantitative variables were presented using mean, standard deviation, median, minimum, and maximum values, while qualitative variables were displayed with descriptive statistical methods such as frequency and percentage. The Shapiro-Wilk test and Box Plot graphics were employed to assess the normal distribution of the data. The one-way ANOVA test was used to compare normally distributed quantitative data between groups, with the Bonferroni test applied to identify the group causing the difference. Fisher’s exact test was utilized for the comparison of qualitative data. Results were evaluated with a 95% confidence interval, and the significance level was set at P < 0.05.
4. Results
There is a significant difference in gender distributions according to variants (P < 0.001; P < 0.01). The incidence of the Delta variant in women is higher than the rates of the Alpha, Beta, and Omicron variants. The order is as follows: Delta > Omicron > Alpha > Beta. There is also a significant difference in age distributions according to variants (P < 0.001; P < 0.01). The ages of cases with the Omicron variant are higher than those with the Alpha, Beta, and Delta variants (P < 0.001 for all comparisons) (Table 1).
| Variables | Alpha (n = 2,800) | Beta (n = 1,572) | Delta (n = 2,083) | Omicron (n = 1,769) | P-Value | Post Hoc |
|---|---|---|---|---|---|---|
| Gender | 0.001 a, b | - | ||||
| Female | 1,439 (51.4) | 745 (47.4) | 1241 (59.6) | 896 (50.7) | ||
| Male | 1,361 (48.6) | 827 (52.6) | 842 (40.4) | 873 (49.3) | ||
| Age | 0.001 b, c | 4 > 1, 2, 3; 3 > 1, 2 | ||||
| Mean ± SD | 52.83 ± 17.67 | 52.10 ± 15.75 | 54.57 ± 19.09 | 60.15 ± 20.40 | ||
| Median (min-max) | 52.27 (18 - 95) | 52.26 (18 - 94) | 53.70 (18 - 93) | 64.60 (18 - 99) |
Distribution of Age and Gender Results of Severe Acute Respiratory Syndrome Coronavirus 2 Variant Patients (N = 8,224)
In the CRP evaluation, CRP result values were found to be high in:
- 70.8% (n = 2,015) of cases with the Alpha variant,
- 81.3% (n = 1,208) of cases with the Beta variant,
- 84.4% (n = 1,539) of cases with the Delta variant, and
- 83.4% (n = 1,297) of cases with the Omicron variant.
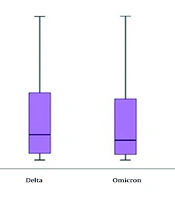
When evaluated by variants, CRP results of cases with the Delta variant are higher than those with the Alpha and Beta variants (P < 0.001 for both comparisons) (Table 2 and Figure 1). In the evaluation of IL-6 levels, an increase was observed from the Alpha to the Omicron variant. However, there was a significant decrease in the number of patients with elevated IL-6 levels (P < 0.001 for all comparisons), as shown in Table 3 and Figure 2.
| Variable | Alpha (n = 2,847) | Beta (n = 1,486) | Delta (n = 1,823) | Omicron (n = 1,556) | P-Value | Post Hoc |
|---|---|---|---|---|---|---|
| CRP results (mg/L) | ||||||
| Mean ± SD | 38.15 ± 48.49 | 52.17 ± 55.96 | 64.17 ± 62.64 | 61.16 ± 64.83 | 0.001 a, b | 3, 4 > 1 , 2; 2 > 1 |
| Median (min-max) | 16.34 (0.10 - 229.77) | 29.34 (0.11 - 230.42) | 40.73 (0.17 - 229.79) | 31.91 (0.09 - 230.24) | ||
| Normal | 832 (29.2) | 278 (18.7) | 284 (15.6) | 259 (16.6) | 0.001 b, c | 1 < 3, 4; 2 < 3 |
| High | 2015 (70.8) | 1208 (81.3) | 1539 (84.4) | 1297 (83.4) |
Distribution of C-reactive Protein Results of Severe Acute Respiratory Syndrome Coronavirus 2 Variant Patients (N = 7,712)
 results of severe acute respiratory syndrome coronavirus 2 (SARS-CoV-2) variant patients")
Distribution of C-reactive protein (CRP) results of severe acute respiratory syndrome coronavirus 2 (SARS-CoV-2) variant patients
| Variable | Alpha (n = 867) | Beta (n = 212) | Delta (n = 654) | Omicron (n = 492) | P-Value | Post Hoc |
|---|---|---|---|---|---|---|
| IL-6 results (Pg/mL) | ||||||
| Mean ± SD | 56.42 ± 78.29 | 102.50 ± 108.45 | 109.13 ± 114.51 | 115.73 ± 103.20 | 0.001 a, b | 2, 3, 4 > 1 |
| Median (min-max) | 26.2 (1.5 - 462.7) | 56.4 (1.5 - 463) | 60.8 (1.5 - 473.2) | 83.0 (1.5 - 473.6) | ||
| Normal | 687 (79.2) | 194 (91.5) | 600 (91.7) | 474 (96.3) | 0.001 b, c | 1 > 2, 3, 4; 4 < 1, 2, 3 |
| High | 180 (20.8) | 18 (8.5) | 54 (8.3) | 18 (3.7) |
Distribution of Interleukin-6 Results of Severe Acute Respiratory Syndrome Coronavirus 2 Variant Patients (N = 2,220)
 results of severe acute respiratory syndrome coronavirus 2 (SARS-CoV-2) variant patients")
Distribution of interleukin-6 (IL-6) results of severe acute respiratory syndrome coronavirus 2 (SARS-CoV-2) variant patients
In the WBC evaluation, it was determined that cases with the Delta variant had higher WBC levels and that the number of patients with high WBC levels was greater compared to other variants (P < 0.001 for all comparisons) (Table 4 and Figure 3). In the evaluation of NEU levels, significant differences were observed across the variants (P < 0.001; P < 0.01). The NEU levels in cases with the Omicron variant were significantly higher than those in cases with the Alpha, Beta, and Delta variants (P < 0.001 for all comparisons). Additionally, cases with the Beta and Delta variants exhibited higher NEU levels compared to those with the Alpha variant (P < 0.001 for all comparisons), as illustrated in Table 5 and Figure 4.
| Variable | Alpha (n = 2,448) | Beta (n = 1,533) | Delta (n = 1,878) | Omicron (n = 1,025) | P-Value | Post Hoc |
|---|---|---|---|---|---|---|
| WBC results (103/µL) | ||||||
| Mean ± SD | 7.73 ± 2.85 | 8.13 ± 3.45 | 9.32 ± 3.82 | 7.93 ± 2.98 | 0.001 a, b | 3 > 1, 2, 4; 2 > 1, 4 |
| Median (min-max) | 7.3 (0.5 - 18.3) | 7.5 (0.4 - 18.2) | 8.8 (0.5 - 18.3) | 7.4 (1.5 - 18.1) | ||
| Low | 213 (8.7) | 103 (6.7) | 61 (3.2) | 41 (4.0) | 0.001 b, c | 1 > 2, 3, 4; 2 > 3, 4 |
| Normal | 1,994 (82.5) | 1,016 (66.3) | 1,100 (58.6) | 763 (74.4) | 1 > 2, 3, 4; 2 > 3; 4 > 2, 3 | |
| High | 241 (9.8) | 414 (27.0) | 717 (38.2) | 221 (21.6) | 1 < 2, 3, 4; 3 > 1, 2, 4 |
Distribution of White Blood Cell Results of Severe Acute Respiratory Syndrome Coronavirus 2 Variant Patients (N = 6,885)
 results of severe acute respiratory syndrome coronavirus 2 (SARS-CoV-2) variant patients")
Distribution of white blood cell (WBC) results of severe acute respiratory syndrome coronavirus 2 (SARS-CoV-2) variant patients
| Variable | Alpha (n = 2,785) | Beta (n = 1,506) | Delta (n = 1,234) | Omicron (n = 1,661) | P-Value | Post Hoc. |
|---|---|---|---|---|---|---|
| NEU results (103/µL) | ||||||
| Mean ± SD | 5.49 ± 2.64 | 6.01 ± 3.12 | 5.85 ± 2.83 | 6.46 ± 3.02 | 0.001 a, b | 4 >1, 2, 3; 2 > 1; 3 > 1 |
| Median (min-max) | 4.9 (0.3 - 14.5) | 5.2 (0.2 - 14.5) | 5.3 (0.2 - 14.5) | 5.8 (0.6 - 14.6) | ||
| Low | 107 (3.8) | 35 (2.3) | 23 (1.9) | 18 (1.1) | 0.001 b, c | 1 > 2, 3, 4; 2 > 4 |
| Normal | 2192 (78.7) | 798 (53.0) | 677 (54.9) | 789 (47.5) | 1 > 2, 3, 4; 2, 3 > 4 | |
| High | 486 (17.5) | 673 (44.7) | 534 (43.3) | 854 (51.4) | 1< 2, 3, 4; 4 > 1, 2, 3 |
Distribution of Neutrophil Results of Severe Acute Respiratory Syndrome Coronavirus 2 Variant Patients (N = 7,186)
 results of severe acute respiratory syndrome coronavirus 2 (SARS-CoV-2) variant patients")
Distribution of neutrophil (NEU) results of severe acute respiratory syndrome coronavirus 2 (SARS-CoV-2) variant patients
In the LYM evaluation, there is a significant difference in LYM results across variants (P = 0.001; P < 0.01). The results of cases with the Alpha variant are higher than those with the Beta, Delta, and Omicron variants (P < 0.001 for all comparisons) (Table 6 and Figure 5). In the EOS evaluation, the results of cases with the Omicron variant are higher than those with the Alpha, Beta, and Delta variants (P < 0.001 for all comparisons). Additionally, the results of cases with the Alpha variant are higher than those with the Beta and Delta variants (P < 0.001; P < 0.05) (Table 7 and Figure 6).
| Variable | Alpha (n = 2,800) | Beta (n = 1,572) | Delta (n = 2,083) | Omicron (n = 1,769) | P-Value | Post Hoc |
|---|---|---|---|---|---|---|
| LYM results (103/µL) | ||||||
| Mean ± SD | 1.59 ± 0.82 | 1.34 ± 0.74 | 1.30 ± 0.80 | 1.31 ± 0.79 | 0.001 a, b | 1 > 2, 3, 4 |
| Median (min-max) | 1.50 (0.10 - 3.80) | 1.20 (0.10 - 3.80) | 1.10 (0.10 - 3.80) | 1.10 (0.10 - 3.80) | ||
| Low | 1,078 (38.5) | 740 (47.1) | 606 (29.1) | 499 (28.2) | 0.001 b, c | 3, 4 < 1, 2; 2 > 1 |
| Normal | 1,659 (59.3) | 819 (52.1) | 1,477 (70.9) | 1,270 (71.8) | 2 < 1, 3, 4; 1 < 3, 4 | |
| High | 63 (2.3) | 13 (0.8) | 0 (0.0) | 0 (0.0) | 1 > 2, 3, 4; 2 > 3, 4 |
Distribution of Lymphocyte Results of Severe Acute Respiratory Syndrome Coronavirus 2 Variant Patients (N = 8,224)
 results of severe acute respiratory syndrome coronavirus 2 variant patients")
Distribution of lymphocyte (LYM) results of severe acute respiratory syndrome coronavirus 2 variant patients
| Variable | Alpha (n = 2,706) | Beta (n = 1,505) | Delta (n = 2,003) | Omicron (n = 1,687) | P-Value | Post Hoc |
|---|---|---|---|---|---|---|
| EOS results (103/µL) | ||||||
| Mean ± SD | 0.06 ± 0.07 | 0.05 ± 0.07 | 0.06 ± 0.07 | 0.07 ± 0.08 | 0.001 a, b | 4 > 1, 2, 3; 1 > 2 |
| Median (min-max) | 0.04 (0 - 0.31) | 0.02 (0 - 0.31) | 0.02 (0 - 0.31) | 0.05 (0 - 0.31) | ||
| Low | 844 (31.2) | 848 (56.3) | 1,140 (56.9) | 778 (46.1) | 0.001 b, c | 1 < 2, 3, 4; 4 < 2, 3 |
| Normal | 1862 (68.8) | 657 (43.7) | 863 (43.1) | 909 (53.9) |
Distribution of Eosinophil Results of Severe Acute Respiratory Syndrome Coronavirus 2 Variant Patients (N = 7,901)
 results of severe acute respiratory syndrome coronavirus 2 variant patients")
Distribution of eosinophil (EOS) results of severe acute respiratory syndrome coronavirus 2 variant patients
5. Discussion
It is significant to note that the average age of patients progressively increases from the Alpha variant to the Omicron variant, which is an unexpected observation given that the elderly population was the first to be vaccinated in our country. This may be due to factors such as changes in quarantine conditions, the first encounter of the elderly population with the virus, vaccine leakage, or the shortness of the protection period of the vaccine. It has been observed that CRP levels increase in response to pro-inflammatory cytokines, as reported in many previous studies on COVID-19 patients (10, 11). C-reactive protein and ESR are usually elevated, whereas procalcitonin levels are generally normal. A high procalcitonin level may indicate a bacterial co-infection (12).
In our study, CRP levels were high in 70.8% - 84.4% of all patients. When evaluated by variant, the CRP values ranked as Delta > Omicron > Beta > Alpha (Table 2 and Figure 1). The IL-6 levels also rise due to cytokine storms (7, 8). While IL-6 levels increased from Alpha to Omicron, the number of patients with elevated IL-6 levels decreased. This suggests that the severity of disease is reduced toward Omicron. In cases of COVID-19, WBC counts are typically normal or low, and lymphopenia is often observed. A LYM count below 1,000 has been associated with severe disease. In the early stages of COVID-19, the total number of leukocytes in peripheral blood is normal or decreased, and LYM counts are reduced (13). Studies indicate that the initial and peak values of the NEU/LYM ratio were higher in patients who died compared to those who survived (P < 0.001) (14).
In our study, WBC levels were low in 3.2% - 8.7% of all patients and high in 9.8% - 38.2%. The WBC levels according to variant were ranked as Delta > Beta > Alpha > Omicron. Neutrophilia is linked to a hyper-inflammatory state and cytokine storms, integral components of the pathogenic mechanism of COVID-19, except in cases of bacterial infections or superinfections. Neutrophils play a significant role in viral respiratory diseases associated with ARDS. Leukocytosis accompanied by neutrophilia is observed in a minority of patients and is associated with more severe outcomes (15). Neutrophils drive hyperinflammation in COVID-19 through increased degranulation and cytokine production (16). A study revealed that NEU counts in severe COVID-19 patients were higher on the day of hospitalization compared to moderate and mild cases. Additionally, an increase in NEU counts was observed from the 7th to the 9th day after symptom onset.
Considering the link between neutrophilia and poor outcomes, it has been concluded that changes in NEU counts in peripheral blood or tissues are unequivocally associated with lung damage in COVID-19 patients (17). In our study, NEU levels were low in 1.1% - 3.8% of patients and high in 17.5% - 51.4% of patients. The results of cases with the Omicron variant are higher than those with the Alpha, Beta, and Delta variants. Similarly, the results of cases with the Beta and Delta variants are higher than those with the Alpha variant. The NLR (absolute NEU count/absolute LYM count) and PLR (absolute platelet count/absolute LYM count) are utilized for diagnosing, monitoring, and investigating various systemic inflammatory processes such as cholangiocarcinoma, ischemic heart disease, and acute pancreatitis. They are also used as prognostic markers for malignant tumors (18-21). In COVID-19, NLR has been used for prognosis monitoring.
In our study, low LYM levels were observed in 29.1% - 47.1% of patients. The occurrence of low LYM decreases toward the Omicron variant, while the number of patients with normal LYM levels increases. The lowest LYM levels were detected in patients with the Beta variant. The role of EOSs in COVID-19 remains unclear. Eosinopenia was identified in studies by Zhang et al. and Mu et al. (22, 23). It is believed that eosinopenia in COVID-19 may be multifactorial, possibly resulting from migration-related inhibition of EOSs to inflammatory sites, EOS mobilization from the bone marrow, blockade of eosinophilopoiesis, decreased expression of chemokine receptors/adhesion molecules, and/or inflammation-induced EOS apoptosis (24, 25). Differences in laboratory parameters were observed between variants. Increases in CRP levels from Alpha to Omicron, high WBC levels in the Delta variant, high NEU levels in the Omicron variant, low EOS levels in the Beta and Delta variants, and low LYM counts frequently detected in the Beta variant were notable findings.
5.1. Conclusions
It is known that persistently high IL-6 levels have an impact on mortality (26). In this study, IL-6 levels in patients with the Omicron variant were found to be elevated. The average level being higher than other variants indicates that a small number of patients with the Omicron variant experienced very severe, fatal progression. The decrease in the number of patients with high IL-6 levels from Alpha to Omicron suggests that the severity of disease has declined over time.
5.2. Limitations of the Study
Since laboratory data were evaluated alone, individual-based NLR and PLR rates could not be evaluated. Additionally, patients were not clinically categorized as severe, moderate, or mild. This study is exclusively focused on laboratory data.
