

1. Background
Mangroves are known as important inter-tidal estuarine wetlands along the tropical and subtropical coastlines. These ecosystems are closely tied to human activities and are very vulnerable to anthropogenic contaminations mainly due to their inherent physical and chemical properties such as rich organic contents and the anaerobic and reduced phase condition of the soil (1, 2).
Natural polycyclic aromatic hydrocarbons (PAHs) as well as those produced by human activities are widely detected in coastal environments and accumulate in mangrove sediments (3). The US environmental protection agency (EPA) has listed 16 PAHs as particularly hazardous agents due to their carcinogenic and mutagenic properties (4). Among these agents, phenanthrene (Phe) - a three ring constituent of coal derivatives and oil fuels- is considered as one of the prior pollutants. It is reported to act as human skin photosensitiser, a mild allergen and also a mutagen in bacterial systems (5).
With the discovery of a wide variety of microorganisms that are capable to degrade PAHs (6), bioremediation- a technology that utilizes the microorganisms to eliminate the environmental contaminants- has become a popular and effective remediation technique (7). To date, large varieties of bacteria which are able to use PAHs as the sole carbon and energy source have been isolated from the mangrove sediments (8-10) but success of bioremediation has been found to largely depended on different biotic and abiotic factors such as bacterial population size, temperature, pH, nutrient, salinity, etc. (11-13). Moreover, the effect of a single factor seems not straightforward in fashion since it is often is influenced by the presence and levels of other factors. For instance, temperature has been reported to affect the PAH bioavailability and both temperature and PAH bioavailability have been shown to affect the activity of microorganisms (7).
In essence, the application of appropriate statistical methods seems mandatory for the accurate study of these interactions. Response surface methodology (RSM) is a collection of mathematical and statistical techniques that are useful for modeling and analysis of problems in which the response of interest is influenced by several variables. This method has been successfully applied to optimize the biodegradation of toxic substances (14).
2. Objectives
The Nayband bay, a protected coastal region located in the northern Persian gulf, is a suitable place for restoration of ecologically important habitats such as coral reefs, seagrass beds, and mangrove forests. However, in recent years, growing industrial activities in that area is threating different habitats located in the Bay. The aims of the present study were to isolate the PAHs-degrading bacteria from mangrove sediments and to investigate the effect of five different abiotic and biotic factors including bacterial population size, temperature, pH, NH4Cl concentration and salinity on Phe biodegradation, using RSM.
3. Materials and Methods
3.1. Sediment Sampling and Enrichment of Phe-Degrading Bacterial Consortium
Aerobic surface sediment samples were randomly collected from the mangrove forests at Nayband bay- Iran during low tides. To enrich Phe-degrading bacterial consortium, a predetermined amount of phenanthrene (Merck, Germany) was dissolved in acetone in a 250mL conical flask to obtain the final concentration of 1000 mg/L. The solution was kept at room temperature until complete evaporation of the solvent (acetone) and then the flask was filled with 45 mL sterilized mineral salt medium (MSM) (1.0 g NH4Cl, 0.5 g K2HPO4, 0.01 g FeSO4.7H2O in 1 L 0.45 µm Millipore-filtered 40ppt local seawater). Then, approximately 5 g of the fresh sediment sample was transferred into the conical flask and the solution pH was adjusted to 8.0. The flask was incubated at 30˚C on a rotary shaker at 140 rpm during of which PAH utilization in the enriched cultures was monitored by signs of decreased amounts of Phe crystals, that is presented with medium color changes (from pale color to dark red), and increased bacterial biomass. At the end, 5 mL of the enriched culture was transferred to the fresh medium and incubated under the same condition. This process was repeated for four times to obtain the enriched Phe-degrading consortium.
3.2. Isolation and Identification of Bacterial Strains
At the end of the enrichment, bacterial strains in the consortium were isolated by spreading the 10-fold serially diluted consortium on Mineral salt medium agar plates coated with a layer of Phe. Bacterial colonies were then collected from the plates, and purified by repetitive streaking onto nutrient agar plates (Quelab Laboratories Inc. Montreal, Canada). Purified strains were identified by biochemical tests such as Gram staining and oxidation/fermentation tests (15). Further molecular identification of the strains was also performed by 16S rDNA gene sequences analysis. For this purpose, DNAs of the isolated bacteria were extracted using the bacterial DNA extraction kit (Roche®- Germany).
The isolated strains were then identified by 16S rDNA gene sequence analysis after amplification of the gene by PCR using the set of primers 27F (5- AGA GTT TGA TCC TGG CTC AG-3) and 1510R (5-GGT TAC CTT ACG ACT T-3). The reactions were cycled in a Primus 25 advanced® thermocycler with an initial denaturation step at 95◦C for 5 minutes followed by 35 cycles of denaturation at 94◦C for 1 minute, annealing at 52◦C for 1: 30 minute and extension at 72◦C for 1 minute, and a final extension step at 72◦C for 15 minute. DNA sequences of the cloned 16S rDNA fragments compared using BLAST at http://www.ncbi.nlm.nih.gov/BLAST/ (National Center of Biotechnology Information, NCBI).
3.3. Assessment of Biodegradation
The most effective isolated strain was first cultivated on nutrient broth at 30˚C for 3 days, after that the cells were collected by centrifugation at 8000 rpm for 15 minutes, and washed twice with sterilized sea water. In order to assess the basal Phe utilization rates, the microbial inoculums with final optical density (OD600)nm of 0.15 were passed to the MSM (1.0 g NH4Cl, 0.5 g K2HPO4, 0.01 g FeSO4.7H2O in 1 L 0.45 µm Millipore-filtered 40 ppt local seawater) + Phe medium. The experimental cultures were performed in triplicate at 30˚C in the dark at 140 rpm for 10 days. To determine the abiotic losses of Phe, the same MSM media without any microbial inoculum were also retained. The entire medium was used for further analysis of Phe concentrations at the end of each experiment.
3.4. Experimental Design and Statistical Analysis
The optimization of Phe biodegradation efficiency was examined by using the RSM with a 5-level, 5-factor central composite design (CCD). The selected variables were temperature, inoculum sizes, pH, NH4Cl concentration, and salinity. Coded and actual values of the five variables, as well as composites of their combination sets are presented in Table 1. In order to reach to the initial in oculum sizes determined by RSM experimental design, the strain was first cultured on nutrient broth for 3 days at 30˚C. The cells were then collected by centrifugation at 8000 rpm for 15 minutes, and washed twice with sterilized sea water. For each experiment, Phe were used as a sole carbon source and spiked into the 250 mL conical flask at 1000 mg/L concentration. Each experimental experiment was conducted in triplicate at 140 rpm shaking schedule. Parallel controls were also setup to assess a biotic losses. These trials contained the same aqueous volume and contaminant concentration but were not inoculated.
Table 1.The Design Matrix of the Variables (CCD) and Observed Values of Response (Phe Biodegradation Efficiency)
| Treatment | Optical Density, OD600 (x1) | pH (x2) | Temperature, ˚C (x3) | NH4Cl, g/L (x4) | Salinity, ppt (x5) | Biodegradation Efficiency, % (Y) |
|---|---|---|---|---|---|---|
| 1 | 0.2 (+1) | 6.5 (-1) | 35 (+1) | 0.08 (-1) | 40 (+1) | 15.20±1.71 |
| 2 | 0.2 (+1) | 6.5 (-1) | 35 (+1) | 0.16 (+1) | 30 (-1) | 7.00±1.00 |
| 3 | 0.2 (+1) | 8.5 (+1) | 35 (+1) | 0.08 (-1) | 30 (-1) | 26.33±2.08 |
| 4 | 0.1 (-1) | 8.5 (+1) | 25 (-1) | 0.16 (+1) | 40 (+1) | 23.42±2.00 |
| 5 | 0.05 (-2) | 7.5 (0) | 30 (0) | 0.12 (0) | 35 (0) | 13.79±2.55 |
| 6 | 0.15 (0) | 7.5 (0) | 20 (-2) | 0.12 (0) | 35 (0) | 11.67±1.53 |
| 7 | 0.2 (+1) | 8.5 (+1) | 25 (-1) | 0.16 (+1) | 30 (-1) | 21.72±3.81 |
| 8 | 0.1 (-1) | 6.5 (-1) | 35 (+1) | 0.08 (-1) | 30 (-1) | 16.64±1.88 |
| 9 | 0.15 (0) | 9.5 (+2) | 30 (0) | 0.12 (0) | 35 (0) | 7.26±1.39 |
| 10 | 0.15 (0) | 7.5 (0) | 30 (0) | 0.12 (0) | 35 (0) | 21.33±4.51 |
| 11 | 0.15 (0) | 7.5 (0) | 30 (0) | 0.12 (0) | 45 (+2) | 8.45±1.39 |
| 12 | 0.15 (0) | 7.5 (0) | 30 (0) | 0.12 (0) | 25 (-2) | 20.67±3.06 |
| 13 | 0.2 (+1) | 8.5 (+1) | 25 (-1) | 0.08 (-1) | 40 (+1) | 17.03±2.90 |
| 14 | 0.1 (-1) | 6.5 (-1) | 25 (-1) | 0.08 (-1) | 40 (+1) | 2.94±1.01 |
| 15 | 0.15 (0) | 7.5 (0) | 30 (0) | 0.12 (0) | 35 (0) | 14.49±2.27 |
| 16 | 0.15 (0) | 7.5 (0) | 30 (0) | 0.12 (0) | 35 (0) | 14.39±1.82 |
| 17 | 0.1 (-1) | 6.5 (-1) | 35 (+1) | 0.16 (+1) | 40 (+1) | 7.13±1.40 |
| 18 | 0.25 (+2) | 7.5 (0) | 30 (0) | 0.12 (0) | 35 (0) | 21.03±2.03 |
| 19 | 0.15 (0) | 7.5 (0) | 30 (0) | 0.04 (-2) | 35 (0) | 19.55±2.86 |
| 20 | 0.15 (0) | 5.5 (-2) | 30 (0) | 0.12 (0) | 35 (0) | 1.74±1.27 |
| 21 | 0.15 (0) | 7.5 (0) | 40 (+2) | 0.12 (0) | 35 (0) | 23.71±2.06 |
| 22 | 0.1 (-1) | 6.5 (-1) | 25 (-1) | 0.16 (+1) | 30 (-1) | 6.10±0.10 |
| 23 | 0.1 (-1) | 8.5 (+1) | 35 (+1) | 0.08 (-1) | 40 (+1) | 26.08±1.67 |
| 24 | 0.15 (0) | 7.5 (0) | 30 (0) | 0.12 (0) | 35 (0) | 21.85±0.33 |
| 25 | 0.1 (-1) | 8.5 (+1) | 35 (+1) | 0.16 (+1) | 30 (-1) | 27.32±0.68 |
| 26 | 0.2 (+1) | 6.5 (-1) | 25 (-1) | 0.08 (-1) | 30 (-1) | 6.02±0.98 |
| 27 | 0.2 (+1) | 8.5 (+1) | 35 (+1) | 0.16 (+1) | 40 (+1) | 22.61±1.39 |
| 28 | 0.15 (0) | 7.5 (0) | 30 (0) | 0.12 (0) | 35 (0) | 20.61±2.15 |
| 29 | 0.15 (0) | 7.5 (0) | 30 (0) | 0.12 (0) | 35 (0) | 15.33±2.08 |
| 30 | 0.2 (+1) | 6.5 (-1) | 25 (-1) | 0.16 (+1) | 40 (+1) | 5.50±1.50 |
| 31 | 0.1 (-1) | 8.5 (+1) | 25 (-1) | 0.08 (-1) | 30 (-1) | 20.42±2.98 |
| 32 | 0.15 (0) | 7.5 (0) | 30 (0) | 0.2 (+2) | 35 (0) | 19.35±2.09 |
The entire medium of each flask was used for analysis of Phe concentrations after 10 days from experiment. Concentration of Phe was determined by GC-FID equipped with a HP-5MS fused silica capillary column according to Wu et al.(16). The Phe biodegradation rates (%) were fitted to a second-order polynomial model (equation 1) and the regression coefficients were obtained.
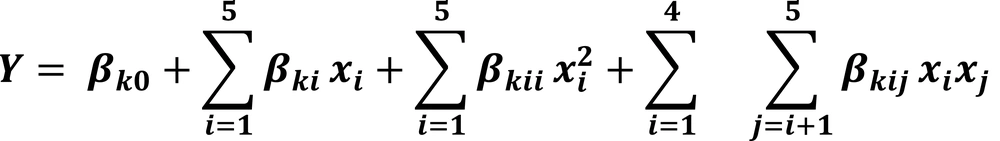
Equation 1.
where Y is response (%Phe biodegradation); βk0, βki, βkii and βkij are constant coefficients and xi is the uncoded independent variables; x1 = Optical Density (OD600nm); x2 = pH; x3 = Temperature (˚C); x4 = NH4Cl (g/L); x5 = Salinity (ppt).
The observed responses (% of Phe biodegradation) were subjected to the analysis of variance (ANOVA) and regression to seek for an optimized level of factors (Design Expert V 7.0.10, Stat-Ease Inc., Minneapolis, 2005). The efficiency of the achieved optimized cultural condition was then tested during a 10-day experiment.
4. Results
4.1. Identification of Microbial Strains
A Gram-negative bacterium strain (SBU1) was isolated from enrichment consortium SBU cultured on MSM agar plates coated with a layer of Phe. The isolated strain was cocco-shaped, forming small raised creamy colonies on nutrient agar medium. Differential biochemical and phenotypic characteristics of strain SBU1 are shown in Table 2. The 16S rDNA sequence obtained in this study (GenBank database accession number:KF052989) showed 96% similarity with Roseovarius sp. The SBU1 degraded < 15% of Phe after 10 days.
Table 2.Differential Biochemical and Phenotypic Characteristics of Strain SBU1
| Characteristic | Strain SBU1 |
|---|---|
| Motility | + |
| Anaerobic growth | - |
| Growth in NaCl, % | 1-20 |
| Growth temperature,˚C | |
| 4 | - |
| 37 | + |
| Oxidase | + |
| Catalase | + |
| Gelatinase | - |
| Amylase | - |
| Reduction of Nitrate to Nitrite | + |
| Reduction of Nitrite to N2 | + |
| Bchl a | - |
aBacteriochlorophyll
4.2. Optimization of the Quadratic Model of Phenanthrene Biodegradation
The degradation rate of Phe ranged from 2.94% (run order 14) to 27.32% (run order 25)
The resulted second-order quadratic polynomial equation achieved by optimization of process variables was shown as below

Equation 2.
Equation 2.
Analysis of variance indicated that the second order polynomial model was significant (P < 0.05) and effective (r 2 = 0.94) in representing the actual effects of the variable on Phe biodegradation (Table 3).
Table 3.Analysis of Variance (ANOVA) for Quadratic and Regression Statistics
| Full Model a | Reduced Model b | |||||||||
|---|---|---|---|---|---|---|---|---|---|---|
| Sum of Squares | Degrees of Freedom | Mean Square | F Value | P value | Sum of Squares | Degrees of Freedom | Mean Square | F Value | P value | |
| Model | 13.36 | 20 | 0.67 | 9.48 | 0.000 | 12.36 | 6 | 2.06 | 28.90 | 0.000 |
| Inoculum size , OD600nm, (x | 0.035 | 1 | 0.035 | 0.49 | 0.497 | - | - | - | - | - |
| pH (x2) | 6.07 | 1 | 6.07 | 86.12 | 0.000 | 6.07 | 1 | 6.07 | 85.18 | 0.000 |
| Temperature , ºC, (x3) | 1.19 | 1 | 1.19 | 16.92 | 0.001 | 1.19 | 1 | 1.19 | 16.73 | 0.000 |
| NH4Cl, %, (x4) | 0.022 | 1 | 0.022 | 0.31 | 0.586 | 0.022 | 1 | 0.022 | 0.31 | 0.581 |
| Salinity, ppt, (x5) | 0.37 | 1 | 0.37 | 5.27 | 0.042 | 0.37 | 1 | 0.37 | 5.22 | 0.0311 |
| x1x2 | 0.055 | 1 | 0.055 | 0.79 | 0.394 | - | - | - | - | - |
| x1x3 | 0.026 | 1 | 0.026 | 0.37 | 0.556 | - | - | - | - | - |
| x1x4 | 0.044 | 1 | 0.044 | 0.63 | 0.445 | - | - | - | - | - |
| x1x5 | 0.20 | 1 | 0.20 | 2.80 | 0.122 | - | - | - | - | - |
| x2x3 | 0.30 | 1 | 0.30 | 4.22 | 0.064 | - | - | - | - | - |
| x2x4 | 0.099 | 1 | 0.099 | 1.40 | 0.261 | - | - | - | - | - |
| x2x5 | 0.022 | 1 | 0.022 | 0.31 | 0.591 | - | - | - | - | - |
| x3x4 | 0.47 | 1 | 0.47 | 6.70 | 0.025 | 0.47 | 1 | 0.47 | 6.63 | 0.016 |
| x3x5 | 0.27 | 1 | 0.27 | 0.38 | 0.549 | - | - | - | - | - |
| x4x5 | 0.040 | 1 | 0.040 | 0.57 | 0.467 | - | - | - | - | - |
| x12 | 0.011 | 1 | 0.011 | 0.15 | 0.706 | - | - | - | - | - |
| x22 | 4.08 | 1 | 4.08 | 57.85 | 0.000 | 4.23 | 1 | 4.23 | 59.35 | 0.000 |
| x32 | 4.99 | 1 | 4.99 | 0.071 | 0.795 | - | - | - | - | - |
| x42 | 0.08 | 1 | 0.08 | 1.13 | 0.310 | - | - | - | - | - |
| X52 | 0.058 | 1 | 0.058 | 0.82 | 0.383 | - | - | - | - | - |
| Residual error | 0.78 | 11 | 0.70 | - | - | 1.78 | 25 | 0.071 | - | - |
| Lack-of-fit | 0.57 | 6 | 0.095 | 2.30 | 0.188 | 1.58 | 20 | 0.079 | 1.91 | 0.243 |
| Pure error | 0.21 | 5 | 0.041 | - | - | 0.21 | 5 | 0.041 | - | - |
| Total | 14.14 | 31 | - | - | - | 14.14 | 31 | - | - | - |
aFull model: Coefficient of determination (r2) = 0.945; Adjusted r2 0.84
bReduced model: Coefficient of determination (r2) = 0.87; Adjusted r2 0.84
Normally, a regression model that possess an r2 value higher than 0.9 is considered a very high correlation (17). The results revealed the statistically significant (P < 0.05) effects of pH (X2), temperature (X3) salinity (X5), pH2 (X22), or temperature x NH4Cl concentration (X3 X4) on Phe biodegradation, whereas, Optical Density (X3) and NH4Cl (X4) did not show significant effects.
When interactive surface contour was plotted for NH4Cl concentration and temperature, the removal of Phe was found to increase with the decrease of NH4Cl concentration and the increase in temperature. As a result, a lower NH4Cl concentration and a higher pH seemed to be mandatory for maximum biodegradation percentage (Figure 1). In order to improve the model prediction, only significant elements were included in the model. The reduced model which describes the response as a function of significant variables is shown below (Equation 3).

Equation 3.
Equation 3.

Figure 1.
A Three-Dimensional Interactive Surface Contour Which Displays the Effects of NH 4 Cl Concentration and Temperature Level on the PheBiodegradation
Small r2 values resulted when reduced model was used, but when the similar adjusted values were obtained in both models, then the reduced model was constituted the preferred model. The validity of the model was tested by conducting experiments considering the best predicted conditions (Table 4). Maximum biodegradation efficiency of 28.4% was obtained at pH = 8.2, temperature≈ 35˚C, salinity = 30 ppt, NH4Cl = 0.13 g/L and inoculum size = 0.2 OD 600nm. In all experiments, the practically achieved biodegradation rates were consistent with predicted values. The abiotic elimination of Phe during biodegradation experiments was negligible.
Table 4.The Three Best Possible Optimal Conditions Achieved by RSM
| pH | Tempreature, ˚C | Salinity, ppt | NH4Cl, g/L | Inoculum (OD600nm) | Biodegradation of Predicted Values , % | Biodegradation of Experimental Values, % |
|---|---|---|---|---|---|---|
| 8.20 | 34.8 | 30 | 0.13 | 0.2 | 27.34 | 28.4 |
| 8 | 34.7 | 32.34 | 0.12 | 0.2 | 27.37 | 27.9 |
| 8.20 | 33.5 | 30.8 | 0.12 | 0.14 | 27.34 | 26.10 |
5. Discussion
Bioremediation provides a cheap and environmentally safe way to remove toxic pollutants from the environment (18). In the current study, the bacterial strain, SBU1, isolated from mangrove surface sediments, was found accountable in Phe biodegradation.
In general, the SBU1 showed a low Phe biodegrading activity in pure cultures reaching to 28.4% even after optimization process. Although the PAHs degrading activities of the bacterial consortium belong to the genus Roseovarius have been reported in literature (19, 20) and any research on PAHs degrading activities of the Roseovarius sp. in pure culture condition has been done up to date and also several studies have suggested that biodegradation performed by mixed culture would be more effective than those pure cultures which may be due to a broader enzymatic capability and counteraction of toxic intermediates by co-metabolic processes (21).
In our study, the optimum culture conditions for Phe degradation by SBU1 were successfully determined by RSM. Previous studies have shown that the application of statistical experimental design techniques can result in improved yields of degradation and allow rapid and economical determination of the optimum culture conditions with fewer number of experiments and minimal resources in biodegradation processes (22, 23).
The optimum degradation conditions were determined as: pH = 8.2, temperature≈35˚C, salinity = 30 ppt, NH4Cl = 0.13 g/L and inoculum size = 0.2 OD600nm. Under these conditions, degradation rate of approximately 28.4% were achieved within 10 days, which was approximately 2 times more than the basal condition.
Among examined factors, Inoculum size and NH4Cl concentration had no significant effects, which indicating that biodegradation with small inoculums size and low NH4Cl concentration may also be applicable.
The pH has been found as the most important factor affecting biodegradation in the current study (effect size = 85.18). The pH of culture medium can affect microbial diversity and activity through altering the enzymatic activity, transporting processes and the nutrient solubility ( 24 ). Leahy and Colwell et al. (25 ) have reported that most petroleum degrading bacterial species have degrading property at pH = 6-8, but the optimum degradation abilities is observed at pH near 7. The biodegradation process was active at a pH range from 5.5 to 9.5 in the current study, but the highest biodegradation rate (23%) was obtained at pH ≈ 8 (Figure 2).

Figure 2.
Phenantrene Biodegradation Efficiency at Different pH Levels
Temperature was found as the next effective factor affecting the biodegradation process (effect size = 16.73). In general this factor is one of the most important factors affecting biodegradation of petroleum hydrocarbons through its positive effects on bacterial metabolism (25, 26). In our experiment, the best SBU1 biodegrading efficiency was achieved at nearly highest temperatures (35˚C). This could be due to the increased solubility of PAHs at higher temperatures, which is causing a noticeable improvement in the bioavailability of Phe molecules (27).
Also Salinity was found to have an important role on biodegradation (effect size = 5.22) Shiaris et al.(18) found positive correlation between salinity and Phe biodegradation rates and naphthalene in estuarine sediment but in the contrast, some researchers, reported decreased rates of hydrocarbon metabolisms when salinity was increased and concluded that this may be due to negative effects of ions on metabolism of bacterial cells (24). Our results supposed that 30-33 ppt salinity levels would optimize the Phe biodegradation performed by SBU1.
Analyses results also revealed significant interactions between NH4Cl concentration and temperature (P =0.016). When interactive surface contours were generated for NH4Cl concentration and temperature, the removal of Phe was found to increase with decreased amount of NH4Cl concentration and increased amount of temperature. Thus, a lower NH4Cl concentration and a higher temperature seemed to be needed for the maximum biodegradation percentage.
In conclusion, our findings showed that, indigenous bacteria from mangrove surface sediments of Naybandbay are capable to degrade Phe. The similarity of the predicted and the observed results confirmed the validity and applicability of RSM (CCD) in optimization processes. Our results suggested that statistical optimum strategy is an effective tool to predict the biodegrading activity of SBU1. However, the examined bacterial strain showed low biodegrading efficiency in general and even after optimization. This could be due to the nature of the strain or the limited knowledge about the environmental factors affecting the biological activity of the strain.
