1. Background
Botrytis cinerea, an important plant-necrotrophic pathogenic fungus, can cause infections in a minimum of 235 dicotyledonous species, including a wide range of important nursery plants, vegetables, ornamental, field, and orchard crops, as well as post-harvested agricultural products. This fungus belongs to the Leotiomycetes class with a genome of 40 - 42 Mb. Its plant-pathogen interactions and epidemiology has been thoroughly studied as a model pathogen for plant-pathogen interaction mechanisms (1, 2). Moreover, B. cinerea strains B05.10 and T4 have been sequenced, which makes it possible for them to be used for gene expression profiling technology to study pathogenic mechanisms of B. cinerea. Gene expression profiling is an effective approach to investigate mRNA expression that occurs in various biological processes.
In the last decade, the primary approach to study gene expression was based on microarray in which fragments, peptides, proteins, tissues, cells, or other biological samples are fixed on an inert carrier surface to form a high-density two-dimensional array for micro-biochemical reaction and analysis. However, such method is very difficult for identification of genes that are less abundant due to the high background and cross-hybridization (3-6). Recently, the development of high-throughput Illumina sequencing technologies, such as Digital Gene Expression tag profiling (DGE), has significantly improved sequencing efficacy. Level of gene transcription is fundamental for functional genomics and medical research. This high-throughput sequencing and high-performance computing technology are comprehensive, inexpensive and rapid method for detection of gene expression in specific tissues at a particular state of an organism. Compared to microarray, DGE is a more powerful tool that searches for differentially expressed and low-abundance transcripts.
The reduced cost and increased sequencing capacity has made researchers more interested in DGE technology, which has been widely used in basic research in humans (7), animals (8, 9), plants (10), insects (11) and microorganisms (12) as well as other areas in the medical field (13). However, applications of DGE have not yet been reported in B. cinerea. In our previous study, a novel nonpathogenic mutant (BCt89) was screened from the transformants of B. cinerea by an Agrobacterium tumefaciens-mediated method. A pathogenicity-related gene, BcPDR1 (BC1G_10703.1), was identified in B. cinerea. The mutant strain showed a white color and lower number of plaques, which did not produce conidium and sclerotia on the Potato Dextrose Agar (PDA) medium. This suggested that BcPDR1 is possibly involved in conidium development, sclerotia formation, and pathogenicity in B. cinerea. In this study, the gene expression profile of the mutant was analyzed via high-throughput Illumina sequencing. These results not only provide gene-profiling skills for in-depth studies of pathogenic mechanisms and developmental processes of B. cinerea, but also facilitate further understanding of the molecular development of B. cinerea and its pathogenic mechanisms in plants.
2. Objectives
This study aimed to investigate the development and pathogenicity-related gene in B. cinerea. A Digital Gene Expression profile was used to analyze differentially expressed genes between a novel nonpathogenic mutant and the Wild Type (WT).
3. Materials and Methods
3.1. RNA Extraction From Botrytis cinerea Strains
The WT strain, BC22, of B. cinerea, isolated from tomatoes in Hebei, China, were used to generate a mutant library via A. tumefaciens-mediated transformation (ATMT) (14). The nonpathogenic mutant (BCt89) was obtained by screening the library. The WT and mutant strains were treated separately in the same manner, as follows. The B. cinerea strains were firstly inoculated on tomato at 20°C in the dark for 10 days. Next, RNA was extracted from the frozen fungal mycelia of B. cinerea strains with an RNA extraction kit (Cat. No. SK1322, Sangon, China). These procedures were repeated three times. The RNA of three biological samples were mixed for tag preparation and sequencing. The quality and quantity of RNA samples were measured using a nucleonic acid and protein detection instrument (NanoDrop ND-1000, American).
3.2. Tag Preparation and Sequencing
Total RNA of the B. cinerea strains was subjected to reverse transcription with RTase M-MLV (TaKaRa, Japan), according to the manufacturer’s instructions. The amount of total RNA should reach 6 µg. Pure mRNA was adsorbed by Oligo (dT) magnetic beads, and the first and second-strand of cDNA were synthesized by Oligo (dT) as primers. The 5' ends of tags could be generated by NlaIII, which recognizes and cuts off the CATG sites. The 3' cDNA fragments were purified by Oligo (dT) beads, the Illumina adaptor 1 was ligated to the 5' cDNA fragments. The Illumina adaptor 2 was ligated to the 3' ends of tags after removing 3' fragments with magnetic beads precipitation, and the tags with different adaptors of both ends were acquired. After 15 cycles of Polymerase Chain Reaction (PCR) amplification, a 95 bp fragment was purified by 6% Tris Borate EDTA Polyacrylamide Gel Electrophoresis (TBE PAGE). Then the single-chain molecules were fixed onto the Illumina Sequencing Chip (flowcell) with four types of nucleotides, which were labeled by four colors. Each tunnel generated millions of raw reads with sequencing length of 35 bp.
3.3. The Processing of Sequencing Data
We completed raw read filtration to eliminate those potentially false tags and obtained clean tags by reducing 30 adaptor sequences. After filtering, all tags were annotated according to the Illumina database. A reference library that represents 16 448 genes of all possible CATG + 17-nt tag sequences of B. cinerea genome data was established, and a tag database representing 14,227 genes was obtained. Thereafter, all clean tags were mapped to the reference tag database and analyzed.
3.4. Identification of Differentially Expressed Genes
We drew up a strict algorithm to determine differentially expressed genes between the two samples based on Audic’s approach (15). The P value corresponded to the differential gene expression test. False Discovery Rate (FDR) was used to determine the threshold of the P value. The calculation of FDR was done by Benjamini’s method (16). We used "FDR ≤ 0.001 and the absolute value of [log2Ratio] ≥ 1" as the thresholds to evaluate the significance of the difference in the expression gene. More accurate criteria with lower FDR and higher fold-change value were used to distinguish DEGs.
3.5. Molecular Biology Identification of Differentially Expressed Genes
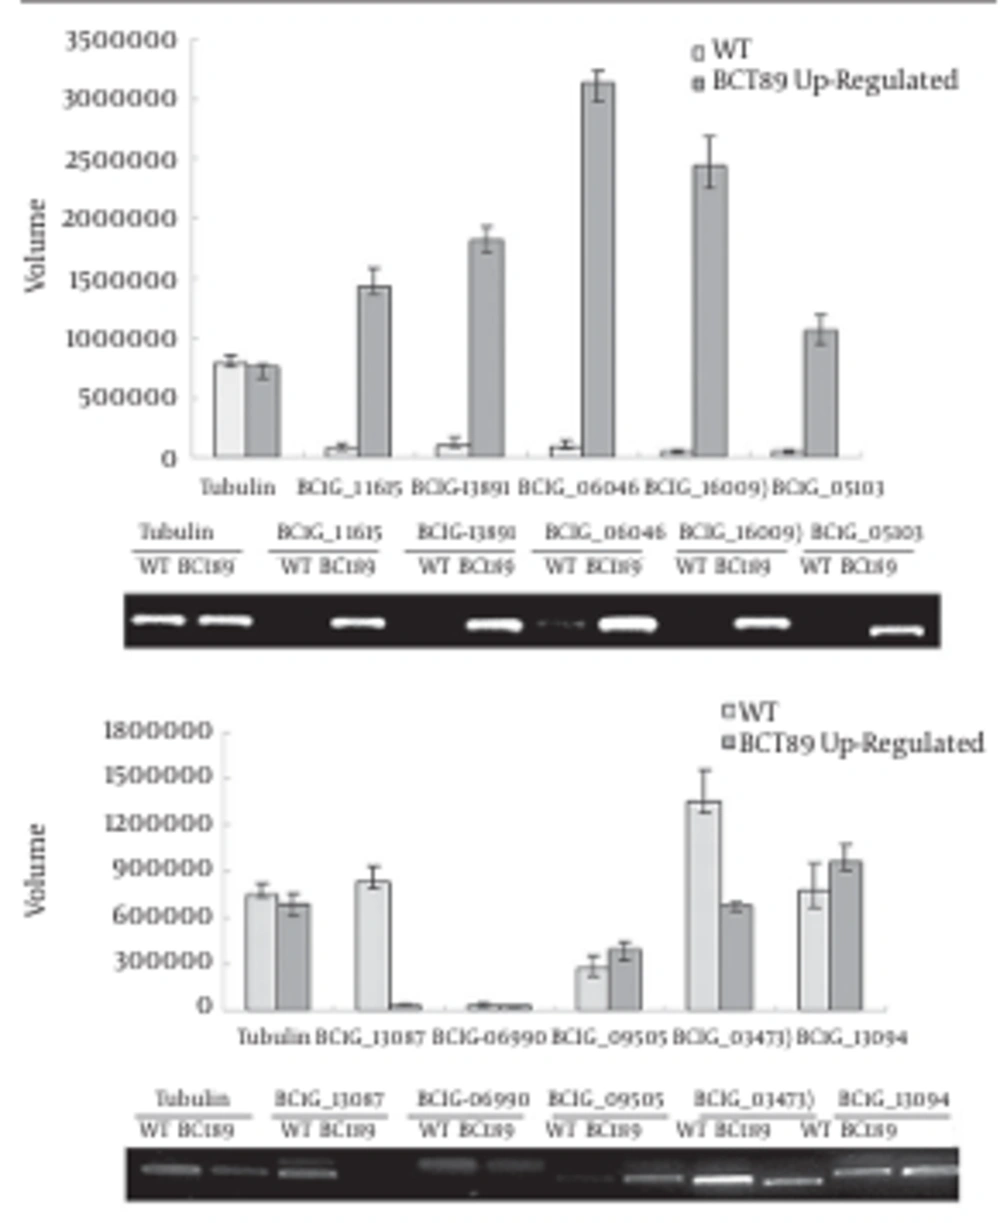
The Digital Gene Expression was identified by semiquantitative Reverse Transcription-Polymerase Chain Reaction (RT-PCR). Transcription levels of differentially expressed genes, e.g. up-regulated genes (BC1G_11615, BC1G_13891, BC1G_06046, BC1G_16009 and BC1G_05103) and down-regulated genes (BC1G_13087, BC1G_06990, BC1G_09505, BC1G_03473 and BC1G_13094), were measured using semi-quantitative RT-PCR with gene-specific primers (Table 1). All RT-PCR experiments were performed in three biological replicates and each biological sample was analyzed in triplicates.
| Gene No. | Primer Sequence (5′-3′) | Annealing Temperature |
|---|---|---|
| BC1G_11615 | 55°C | |
| ATCAACGATAATGGCGGTG | ||
| AGAGCCCAACTCCCAAATG | ||
| BC1G_13891 | 57°C | |
| GAATGATTTCCGATACGCTG | ||
| CCTCGCTCTTTCTCTCCATC | ||
| BC1T_06046 | 54°C | |
| GGTAGTGGACTGACTTTCGTTC | ||
| GAGGCAGAAGAAGACAAGAGA | ||
| BC1G_16009 | 56°C | |
| AGAACTTTGCGGTTGGGT | ||
| GATAGATGTGGTAGAACGCCA | ||
| BC1G_05103 | 54°C | |
| TATTCTCAACCGTGCTCGC | ||
| CCATCTCCTCAAATCCAGC | ||
| BC1G_13087 | 52°C | |
| AGACAAAGGCGAAGAGGAC | ||
| ACAGGTTTCGTTCCCTCCA | ||
| BC1G_06990 | 56°C | |
| AGCCTCATCAATGCTCTCG | ||
| TCTCTCTCAGTTCAGTTGCTTG | ||
| BC1G_09505 | 55°C | |
| GAGAAACAGAAGGCAGAAGC | ||
| TAAGCGTGAGAGGAGTGGA | ||
| BC1G_03473 | 54°C | |
| ACAACAGGGTTTGAGAGCG | ||
| CGAGTAATCCAACATCTGCG | ||
| BC1G_13094 | 54°C | |
| CTCATCATCTGTGGCATCA | ||
| AGACCGATTGTGCGAAAG | ||
| BC1G_00122 (Tubulin) | 52°C | |
| GTTGGATTTGCTCCTTTGAC | ||
| TGTTGGACTCAGCCTCAGT |
4. Results
4.1. Sequence Analysis of Raw Data
To investigate transcriptome response to the development and pathogenicity of related genes in B. cinerea, the Illumina Genome Analyzer was used to perform a high throughput Tag-seq analysis. Table 2 summarizes the major characteristics of libraries in the Wild Type (WT) and BCt89. A total of 4 182 944 tags in the WT and 4 182 021 tags in the mutant were sequenced. A total of 278 711 WT tags and 175 997 corresponding distinct tags in the mutant were acquired. The tag sequences of the two DGE databases were further mapped to the B. cinerea B05.10 genome. The highest percentage of mutant total clean tags (68.47%) could be matched to the reference genes, and 57.78% of the total tags were mapped to the B. cinerea genome. The corresponding values in the WT sample were 59.72% and 54.39%, respectively. Results showed that libraries in WT and BCt89 were successfully established.
| Summary | WT | BCt89 |
|---|---|---|
| Clean tag | ||
| Total number | 4 182 944 (99.57) | 4 182 021 (99.57) |
| Distinct tag number | 278 711 (96.18) | 175 997 (96.18) |
| Mapping to genome | ||
| Total number | 2 274 838 (54.39) | 2 420 408 (57.88) |
| Distinct tag number | 96 950 (34.8) | 62 689 (35.62) |
| Tag mapping to gene | ||
| Number (Percentage of ref genes) | 9 822 (59.72) | 11 262 (68.47) |
| Unambiguous tag mapping to gene | ||
| Number (Percentage of ref genes) | 9 591 (58.31) | 11 000 (66.88) |
aAbbreviations: WT, Wild Type; BCt89, a T-DNA insertion mutant.
bData are presented as No. (%).
4.2. Sequence Quality Assessment
The raw data, which contained adaptor sequences, were obtained via the calling method, and the clean tags were obtained by data processing. If the N in the tags was below 10% of the total raw data, and the single copy in impurity tags was approximately 20%, the sample preparation and experiments were proven to be successful. Supplementary 1 shows the results in the WT and the BCt89. For the WT, the tags that contained N comprised only 0.41% of the total raw data; no impurities and tags with only one copy were found. Therefore, the corresponding values in the mutant were 0.43% and 0%. The majority of the genes showed low expression, and only a few genes exhibited high expression. Wild Type and BCt89 slightly differed in terms of tag expression. The types of distinct differences are very few. This observation corresponded to the general rules (Figure 1). The experimental data could meet the requirements for further sequencing analysis.
4.3. Sequence Saturation Analysis
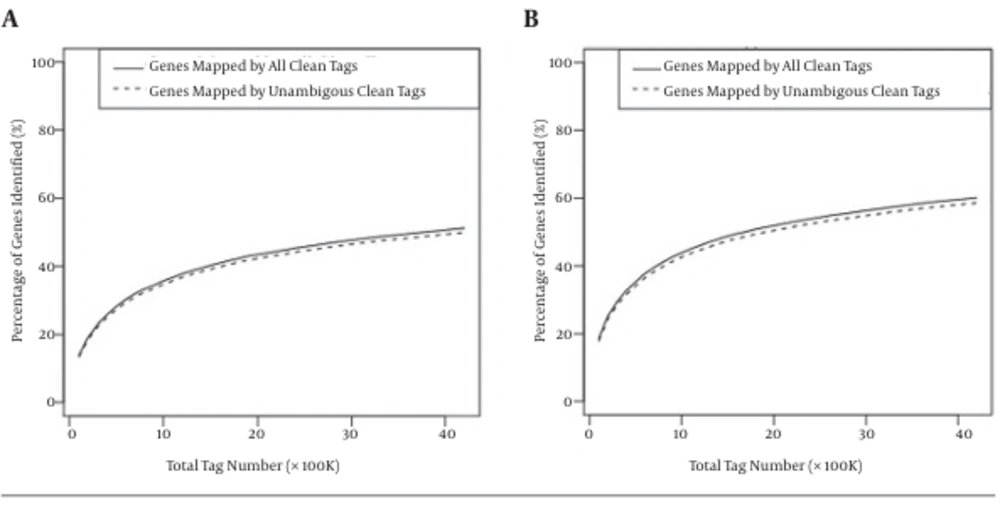
To understand whether sequencing could satisfy the expression profiling coverage requirements, the sequencing saturation of the mutant and WT was analyzed. Using the same samples, sequencing saturation analysis was performed if the identified genes grew in number with the increasing number of total tags in high-throughput Illumina sequencing. The results are shown in Figure 1 A (WT), and indicated that the percentage of genes increased before the total tags reached three million, and the percentage of genes stabilized after the number of tags reached 3.5 million. The mutant data showed a similar curve (Figure 1 B). When the total amount of clean tags reached a particular value, the distinct genes were nearly not identified. Nearly four million clean tags were obtained from the WT and the mutant libraries, thereby suggesting that the high-throughput Illumina sequencing data were exhaustive.
4.4. Distribution of Clean Tag Copy Number
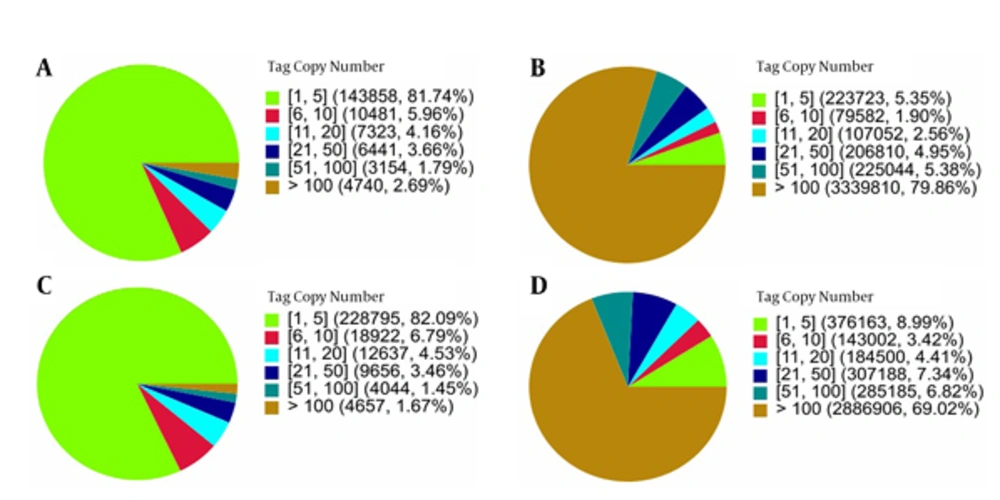
Botrytis cinerea (WT and mutant) DGE pools were sequenced using the same technique described above. A small portion of mRNA was highly abundant, whereas the remaining had relatively low expression. To determine whether the entire data were normal, the distribution of clean tag expression was determined. The distribution of the total clean tags and distinct tags are shown in Figure 2. The tags were categorized based on their abundance in the two DGE pools. Based on the distribution of the total tags, the less expressed tags with copy numbers in BCt89 and WT (less than 10) comprised the majority of the distinct tag distributions (Figures 2 A and 2C), whereas the distribution of the total clean tags of highly expressed tags with copy numbers higher than 100 were dominant (Figures 2 B and 2D).
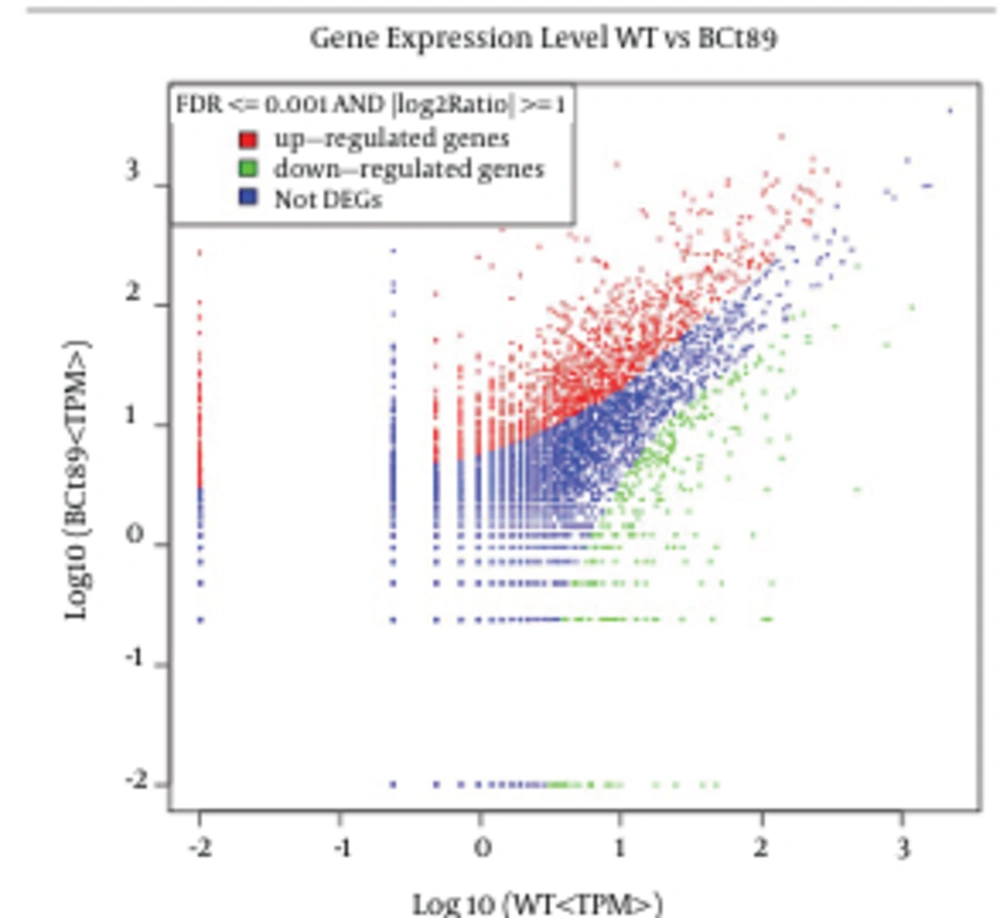
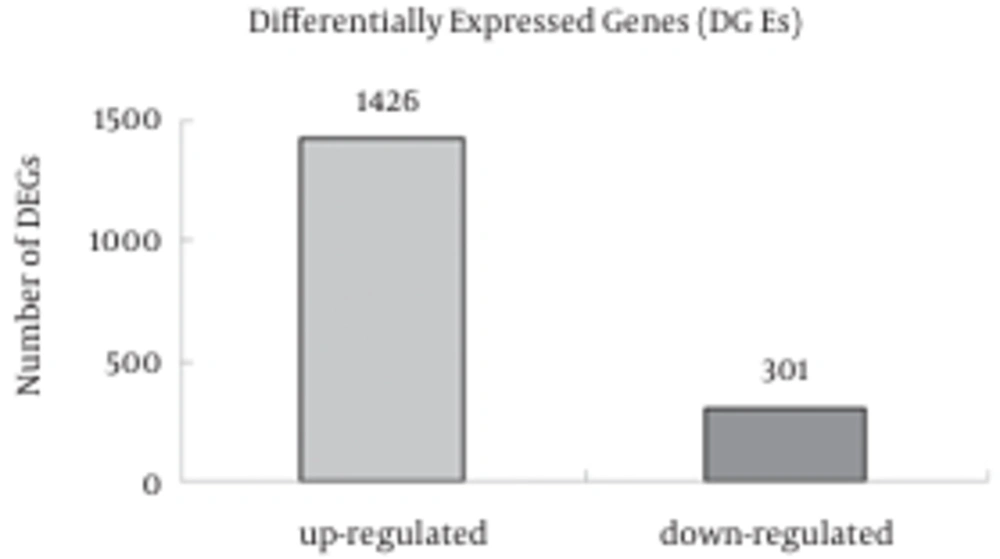
4.5. Screening of Differentially Expressed Genes (DEGs)
Approximately 100 virulence genes have been identified in B. cinerea, yet this amount is insufficient to reveal the pathogenicity signal pathways. Differentially Expressed Genes between the WT and mutant libraries provide a hint for the molecular motions related to B. cinerea development and pathogenicity. The expression level of tag-mapped genes was analyzed using the amount of Transcripts Per Million (TPM) clean tags (Figure 3). The description of the DEGs was showed in Supplementary 2. In addition, a total of 10 410 genes were found to be differentially expressed between WT and the mutant at a certain level (data not shown). First, we standardized the read density and used fatal discovery rate to statistically analyze the significance of gene expression with thresholds of under 0.001, an absolute value of log2, and ratio greater than 1. After data processing, a total of 1 727 genes were found to be differently expressed between WT and the mutant (Figure 4). Of these genes, a total of 301 genes showed down-regulated expression and 1,426 genes showed up-regulated expression. Moreover, antisense may have an important function in gene regulation; hence, we found plenty of highly expressed genes in the sense (Supplementary 3) and antisense (Supplementary 4). The 20 highly expressed genes in sense and in antisense of both WT and mutant shared 30% and 35% identity, respectively. Such data indicates that these genes serve an important function in the life cycle of B. cinerea.
4.6. Pathway Enrichment Analysis for Differentially Expressed Genes
Kyoto Encyclopedia of Genes and Genomes (KEGG) is a bioinformatics resource for analyzing various types of molecular biological data to understand their roles in biochemical functions. For pathway enrichment analysis, all DEGs were mapped in the KEGG database to search for remarkably enriched KEGG terms. This method revealed the main biochemical and signal transduction pathways, which included the DEGs. All identified genes were involved in 91 KEGG pathways (Supplementary 5), and the top six pathways were chosen according to their statistical significance. The enriched pathways included metabolic pathways, fatty acid metabolism, tryptophan metabolism, glycolysis/gluconeogenesis, pyruvate metabolism, and purine metabolism. The results will serve as a basis for revealing the pathogenic mechanism of mutant genes. For instance, more than 32% of DEGs with pathway annotation have been changed in metabolic pathways, and this value is much higher than other path ways in KEGG. The results showed that the mutant gene primarily affected the metabolic pathways.
4.7. Gene Ontology Functional Enrichment Analysis for Differentially Expressed Genes
Gene ontology (GO) maintains and develops its controlled vocabulary of gene and gene product attributes in any organism. The ontology covers three domains; cellular component, parts of a cell and extracellular environment, and molecular function. Each GO term within the ontology has a designated name. Terms may also have synonyms and comments on term meaning or usage among differently expressed genes. A total of 46 genes were significantly enriched for GO component ontology, and about 347 and 236 genes were annotated terms from the function and process ontologies, respectively (Supplementary 6).
4.8. Molecular Biology Identification of Differentially Expressed Genes
A considerable number of DEGs in the WT and the mutant were found by using DGEs, but the expression needs to be confirmed in vivo. In the present study, as confirmed by semiquantitative RT-PCR, five up-regulated and five down-regulated genes were chosen to verify the DGEs, and many genes were consistent with this result (Figure 5). Thus, the DGEs were reliable for the researcher.
5. Discussion
High-throughput Illumina sequencing is a powerful tool for high-throughput transcriptome research that can reveal differentially expressed genes of transcriptomes. We used this technology to identify differentially expressed genes between the WT and a nonpathogenic mutant of B. cinerea. This is the first report on the transcriptome analysis of B. cinerea, a phytopathogenic fungus that causes significant losses in a number of crops. Our results also showed a large number of differentially expressed genes in B. cinerea WT and its nonpathogenic mutant. We presented DGE profiles of 4 182 944 clean tags in WT and 4 182 021 clean tags in its pathogenic mutant. A total of 10 410 genes were detected as differentially expressed in B. cinerea WT and its mutant. We also demonstrated 1 426 up-regulated genes and 301 down-regulated genes.
Many of these differentially expressed genes are associated with the pathogenicity of B. cinerea. Fungus pathogenicity includes the adherence of conidia to the plant surface following germ-tube sprouting and penetration. This process is involved in a set of lytic enzymes and phytotoxins that enable the pathogen to invade host tissues (17). Previous studies have explicitly described that cell wall-degrading enzymes, such as chitin synthases, play important roles during the early stages of infection by B. cinerea (18, 19). The enzymes can attack pectic substances in the cell wall (20, 21). Endopolygalacturonase activity was detected in B. cinerea conidia (22). Two polygalacturonase isozymes were related to the penetration stage in infection process (23). Pectin lyase isoenzymes were also detected in the extracts of B. cinerea conidia and its germinations. These genes were expressed during pathogenesis from the onset of germination on the host surface (24). This argument was verified by our DGE data. Based on DGE data, lytic enzyme-related genes such as Bcpg1, Bcpme1 and BcSOD1 were not detected.
Digital Gene Expression data confirmed this view because our pilot samples were not successfully inoculated to the host. Although the cutinase gene, BC1G_01840, and the lipase gene, BC1G_15212, were found in the DGE, they exhibited higher expressions in the nonpathogenic mutant strain than in the WT. These results are in agreement with the study of Van Kan’s group (24, 25), where cutinase and lipase genes, either separately or together, did not detect reduced virulence. In addition, polyketide synthase is required for fungal virulence and the production of polyketide T-Toxin (26, 27). The Bcpks1 (BC1G_08227) gene was severely down regulated in the B. cinerea mutant. Infection of B. cinerea in at least 235 dicotyledonous species could be attributed to the evolved mechanisms in recognizing suitable hosts, followed by penetration and invasion of host tissues. These mechanisms involve chemical and physical interactions, requiring a network of signal transduction pathways, such as the cyclic adenosine monophosphate (cAMP) dependent pathway (28), Ca2 + /calmodulin-dependent signaling pathway, small G-proteins, mitogen-activated protein kinase (MAPK)-controlled signaling pathways (29), two-component signal pathway and so on. The pathogens communicate with one another when external signals are changed. The cAMP-dependent pathway is involved in multiple processes such as spore germination, hypha growth, nutrient sensing, virulence, and so on (30).
In B. cinerea, the process is either fully described or being investigated currently. Gα subunits were composed of heterotrimeric G-proteins, which were named BCG1 (31), BCG2 (32) and BCG3 (33). Most of the genes controlled by BCG1 are involved in at least one additional signaling cascade, apart from the cAMP-dependent pathway. In the present study, DGE data proved this to be correct. BCG1 (BC1G_02286) was down-regulated in the nonpathogenic mutant through high-throughput Illumina sequencing. The bac gene in B. cinerea was cloned and identified (34) to encode adenylate cyclase. Two catalytic subunits (bcpka1 and bcpka2) and a regulatory subunit (bcpkaR) were described. In this paper, the Bcpka1 (BC1G_03473) gene was down-regulated in the mutant. In addition to the G protein subunits and the cAMP signaling pathway, MAPK genes are essential for the development and pathogenicity of different fungi (32, 33).
The bmp1 gene in B. cinerea is a homologous gene of pmk1 in Magnaporthe, which plays an important role in pathogenicity (35). In our study, MAPK gene BC1G_03001 was down-regulated in the mutant, which lost its pathogenicity. “Two-component” Histidine Kinase (HK) phosphorelay signaling system is a major mechanism by which organisms adapt to their environment. Histidine Kinase has a close relationship with the two-component signal transduction mechanisms and MAPK signal pathway (36, 37). Bcbos1 is a HK gene, which was shown to be involved in osmoregulation and virulence (38). In the present research, Bcbos1 (BC1G_06464) was not down-regulated in the pathogenic mutants. We also noted several differentially expressed genes that encode unknown proteases, along with a number of enzymes that are involved in secondary metabolism, and those encoding cell wall-degrading enzymes.
Although previous researchers have cloned and analyzed more than 100 virulence genes, yet these genes are not sufficient to clarify the pathogenic mechanism of B. cinerea. We firstly established a B. cinerea mutant library by using A. tumefaciens mediated transformation (ATMT) technology and further screened nonpathogenic mutants (data not shown). Differentially expressed mRNAs between WT and nonpathogenic mutants were further described by DGE along with additional virulent genes obtained. In this study, we detected a number of differentially expressed genes that might play a key function in the pathogenicity of B. cinerea and presented comprehensive gene profiling data. Such results will facilitate further understanding of the molecular development of B. cinerea and its pathogenic mechanism in host plants.
