1. Background
The incidence of invasive yeast infection caused by non-Candida albicans Candida (NCAC) species including Candida glabrata has increased considerably (1) in the past two decades. The emergence of C. glabrata as an important threat has been reported in an epidemiological study conducted at a tertiary care hospital, whereby the prevalence of C. glabrata as a causative agent for healthcare-associated candidemia has increased drastically from 0% to 16% from 1983 to 2007 (2). The candidiasis disease ranges from superficial to life-threatening disseminated types such as deep-seated candidiasis (3, 4). The wide spectrum of disease found in various anatomical regions of the human body suggests that C. glabrata has flexibility in sensing nutrients such as glucose and thus can adapt to unique environmental niches of the host.
Glucose sensing and transportation are highly regulated processes in most organisms, as glucose is an important source of carbon and energy. Previous studies have shown that Saccharomyces cerevisiae, a model organism of eukaryotes, senses the uptake of glucose through the Sugar Receptor-Repressor pathway (SRR). Basically, SRR pathway uses two glucose sensors in the cell membrane, namely Snf3 and Rgt2 that govern and regulate the expression of genes encoding for hexose transporter (HXT) with the aids of transcription regulators: RGT1 and MIG1 (5-7). In a similar fashion, another important human pathogen, C. albicans, also employs the same glucose sensing pathways, yet instead of two glucose sensors in the SRR pathway, only one has been shown to be present in this species, namely the Hgt4 (8, 9). However, little is known about the function of these orthologous genes found in C. glabrata in response to glucose. Candida glabrata, which was previously known as Cryptococcus glabratus and Torulopsis glabrata (10) has displayed a closer evolutionarily relationship with S. cerevisiae (11), in comparison to other Candida species. Even though these two yeasts have shared common ancestry yet there are differences between them as C. glabrata has an exclusively haploid life cycle while S. cerevisiae undergoes active sexual reproduction and has interchangeable haploid/diploid life cycle (12).
The availability of fully sequenced C. glabrata genome (13) has aided with the determination of the physiology of this organism through the phylogenomics approach (14). The availability of this data is advantageous for the investigation of the evolutionarily lineage between C. glabrata and S. cerevisiae. According to Yin et al. (15) and Rodaki et al. (16), S. cerevisiae and C. albicans have a high sensitivity response to glucose levels as low as 0.01%, suggesting the presence of a strictly regulated glucose sensing system in the corresponding yeasts. Owing to the importance of these processes, it would be interesting to decipher the key genes in this mechanism, which could serve as potential antifungal or antimicrobial targets (17).
2. Objectives
The present study aimed to identify glucose sensors, key regulators and hexose transporters of C. glabrata and also to predict their phylogenetic relationships with their counterparts found in S. cerevisiae. In addition, the growth of C. glabrata and expression pattern of selected glucose-sensing related genes in response to different concentrations of glucose was assessed.
3. Materials and Methods
3.1. Retrieval of Nucleotides and Protein Sequences
The nucleotide and protein sequences of C. glabrata (CAGL) and S. cerevisiae were retrieved from the Candida genome database (CDG) and yeast genome database (YGD), respectively. The accession number of the proteins of C. glabrata and S. cerevisiae are listed in Tables 1 and 2.
| Target Gene Name | Systematic Name | Accession Number | No. of Amino Acids | Molecular Mass, kDa |
|---|---|---|---|---|
| SNF3 | CAGL0J09020 | CAG61052 | 856 | 95.2 |
| RGT2 | CAGL0I03872 | CAG60354 | 762 | 84.0 |
| RGT1 | CAGL0L01903 | CAG61822 | 1287 | 143.4 |
| MIG1 | CAGL0A01628 | CAG57729 | 424 | 46.4 |
| HXT1 | CAGL0A01804 | CAG57737 | 563 | 62.3 |
| HXT3 | CAGL0A02321 | CAG57758 | 556 | 61.5 |
| HXT4 | CAGL0A01782 | XP_444843 | 568 | 62.9 |
| HXT5 | CAGL0A01826 | CAG57738 | 588 | 65.7 |
| HXT4/6/7 | CAGL0A02233 | XP_444861 | 549 | 61.2 |
| HXT6/7 | CAGL0A02211 | XP_444860 | 552 | 61.5 |
| HXT6/7 | CAGL0A00737 | XP_444803 | 549 | 61.6 |
| HXT2/10 | CAGL0D02662 | XP_445530 | 564 | 62.4 |
| HXT2/10 | CAGL0D02640 | XP_445530 | 564 | 62.4 |
| HXT2/10 | CAGL0I00286 | XP_447265 | 555 | 61.7 |
| HXT14 | CAGL0M04103 | XP_449525 | 531 | 59.0 |
Details of Glucose Sensing-Related Genes of Candida glabrata
| Target Gene Name | Systematic Name | Accession Number | No. of Amino Acids | Molecular Mass, kDa |
|---|---|---|---|---|
| SNF3 | YDL194W | CAA98771 | 884 | 96.7 |
| RGT2 | YDL138W | CAA65621 | 763 | 83.1 |
| RGT1 | YKL038W | CAA81873 | 1170 | 128.2 |
| MIG1 | YGL035C | CAA96736 | 504 | 55.6 |
| HXT1 | YHR094C | DAA06789 | 570 | 63.3 |
| HXT2 | YMR011W | DAA09909 | 541 | 59.8 |
| HXT3 | YDR345C | DAA12185 | 567 | 62.6 |
| HXT4 | YHR092C | DAA06788 | 576 | 63.9 |
| HXT5 | YHR096C | DAA06790 | 592 | 66.3 |
| HXT6 | YDR343C | DAA12184 | 570 | 62.7 |
| HXT7 | YDR342C | DAA12183 | 570 | 62.7 |
| HXT8 | YJL214W | DAA08597 | 569 | 63.5 |
| HXT9 | YJL219W | DAA08593 | 567 | 62.9 |
| HXT10 | YFL011W | DAA12428 | 546 | 60.7 |
| HXT11 | YOL156W | DAA10630 | 567 | 62.7 |
| HXT13 | YEL069C | DAA07586 | 564 | 62.7 |
| HXT14 | YNL318C | CAA96250 | 540 | 61.0 |
| HXT15 | YDL245C | DAA11622 | 567 | 62.9 |
| HXT16 | YJR158W | DAA08942 | 567 | 62.9 |
| HXT17 | YNR072W | DAA10613 | 564 | 62.8 |
Details of Glucose Sensing-Related Genes of Saccharomyces cerevisiae
3.2. Phylogenetic Analysis
The multiple sequence alignment of selected amino acid sequences listed in Tables 1 and 2 was calculated and generated through Clustal Omega program (18-20). A phylogenetic tree was constructed using MEGA version 5 (21) with the maximum likelihood method based on the Poisson correction model (22). Bootstrap tests (100 replicates) were computed (23) for the confidence limits of the constructed phylogenetic tree.
3.3. Yeast Strain and Media Preparation
The standard laboratory reference wild type, C. glabrata strain ATCC2001, was used in this study. Two types of media, namely standard synthetic minimal glucose medium (SD), which contains Yeast Nitrogen Base (YNB) (Becton, Dickinson and Company, USA) plus glucose (Fisher Scientific, USA), and the standard Yeast extract Peptone Dextrose (YPD) (Becton, Dickinson and Company, USA) medium were used. Different glucose concentrations (0%, 0.01%, 0.1% 1%, 2% glucose) of SD was prepared as described by Sherman (24). The YPD medium that consists of 10 g of yeast extract, 20 g of peptone and 20 g of glucose per litre was used as routine growth media.
3.4. Yeast Culture Conditions and Spot Dilution Assay
The glucose response experiment was performed using a modified procedure described for C. albicans by Brown et al. (25) and Rodaki et al. (16). Briefly, C. glabrata cells were grown overnight in YPD medium at 37°C. The cells were reinoculated in 50 mL of fresh YPD (OD600 = 0.1) and regrown at 37°C to mid log phase (OD600 = 0.5). Yeast extract Peptone Dextrose was used in this study with a purpose to provide optimum growth for the cells and prevent possible stress responses triggered by inadequate carbon sources. Prior to reinoculation in the desired glucose concentrations, the cells were washed with Phosphate Buffered Saline (PBS), pH 7.4, three times to ensure complete removal of residues of YPD medium. For the spot dilution assay, mid log phase cells were adjusted to 106 and a ten-fold serial dilution was performed before growth on SD agar and incubated at 37°C for 24 hours.
3.5. Gene Expression Analysis and RNA Extraction
For the gene expression analysis, mid log phase cells were reinoculated in 15 mL of fresh SD with the mentioned glucose concentrations for two hours at 37°C. Collected cells were washed and RNA extraction was carried out as described by the Yeast Current Protocols in Molecular Biology (26). Verification of RNA integrity and quality was performed by visualization on 1% tris-acetate-EDTA gel and a NanoPhotometer (Implen, Germany). Furthermore, RNA was treated with Turbo DNase (Life Technologies, USA) and reverse transcribed using SuperScript® III First-Strand synthesis system (Life Technologies, USA). In order to generate full length transcripts (27), RNA was reverse transcribed with the mixture of Oligo (dT) 18 and random hexamer (Fermentas, Germany). A reaction mixture without reverse transcriptase (Non-Reverse Transcriptase; NRT) and a reaction mixture without RNA template (non-template control; NTC) were included as controls. Next, RNA isolation and subsequent cDNA synthesis were performed by three biological independent experiments for each glucose concentration tested.
3.6. Quantitative Polymerase Chain Reaction (qPCR)
Gene ACT1 was used as the normalizing housekeeping gene (28) and all PCR primers listed in Table 3 were designed to amplify target genes based on the gene sequences sourced from the Candida genome database (29). The PCR efficiency using each set of primers of the respective genes was tested by two independent experiments by running a series of five-fold dilutions of C. glabrata DNA in MiniOpticon™ Real time PCR (Bio-Rad, USA). The acceptable amplification efficiency of the current study was between 90% and 110%. For the expression analysis of the genes, all samples were performed in triplicate. The total volume of each reaction was 20 µL where it contained the cDNA template, primers and 2X SensiFAST™ SYBR No-ROX master mix (Bioline, UK). Melting curve analysis was performed to ensure no non-specific PCR products were generated. For post-experimental expression analysis, normalized expression ratios were calculated based on the mathematical equation developed by Pfaffl (30) as shown below:

Where, Etarget = the quantitative real-time PCR efficiency of target genes; Ereference = the quantitative real-time PCR efficiency of the reference gene (ACT1); ΔCt = the crossing point difference of a particular gene derived from the control (0% or 2% glucose) and the sample (different glucose concentrations).
| Target Gene Name | Accession Number | Direction | Sequence 5’ - 3’ | Amplicon Size |
|---|---|---|---|---|
| SNF3 (CAGL0J09020) | XM_448101 | Forward | ACGACGCATCTCTGCTTTTT | 182 bp |
| Reverse | CGTGAATCCAACGTGATTTG | |||
| RGT2 (CAGL0I03872) | XM_447417 | Forward | CGTTTGTGGGACTTTTCGTT | 203 bp |
| Reverse | TGAAATCCATGGAGCAATGA | |||
| RGT1 (CAGL0L01903) | XM_448852 | Forward | CCAACTCAAAGGATGGAGGA | 194 bp |
| Reverse | TATCGTTGGCGTCATTTTGA | |||
| MIG1 (CAGL0A01628) | XM_444836 | Forward | CCGGGATGTGTCAAGAGATT | 212 bp |
| Reverse | CGTTTCGTCTTCCTCCTCAG | |||
| HXT1 (CAGL0A01804) | XM_444844 | Forward | AAACCAAGTCGGCAAGAATG | 224 bp |
| Reverse | ATTCAGTTCCGTCAGGATGC | |||
| HXT3 (CAGL0A02321) | XM_444865 | Forward | TGACCTTCGTTCCAGAATCC | 165 bp |
| Reverse | TACCAGCGGCATTAGCTTCT | |||
| HXT4 (CAGL0A01782) | XM_444843 | Forward | TCCTGGGGTGAATTGTTCTC | 228 bp |
| Reverse | GCCAAATCTACCGACCAAGA | |||
| HXT5 (CAGL0A01826) | XM_444845 | Forward | TATGTTTCGCATGGGCATTA | 153 bp |
| Reverse | CCAAAAGGACGATTGGAGAA | |||
| ACT1 | XM_448768 | Forward | TTGCCACACGCTATTTTGAG | 225 bp |
| Reverse | ACCATCTGGCAATTCGTAGG |
Target and Normalizing Genes Used in Quantitative Real Time Polymerase Chain Reaction (qRT-PCR) With Their Respective Primer Sequences and Size of Amplicon
There were two glucose controls: no glucose control (0%) and high glucose control (2%), which were chosen as baselines when interpreting the results in accordance to the predicted glucose affinity of target genes for better representation of the transcript profiling. The calculated normalized expression ratios were transformed to logarithm based values (Log10) and averaged with standard error means (SEM). Statistical analysis was performed using relative expression software tool (REST©) version 2009 (31) in order to examine significant differences of sample expression ratios in relation to the control.
4. Results
4.1. Sequence Comparison and Phylogenetic Relationship Between C. glabrata and S. cerevisiae Glucose-Sensing Related Proteins
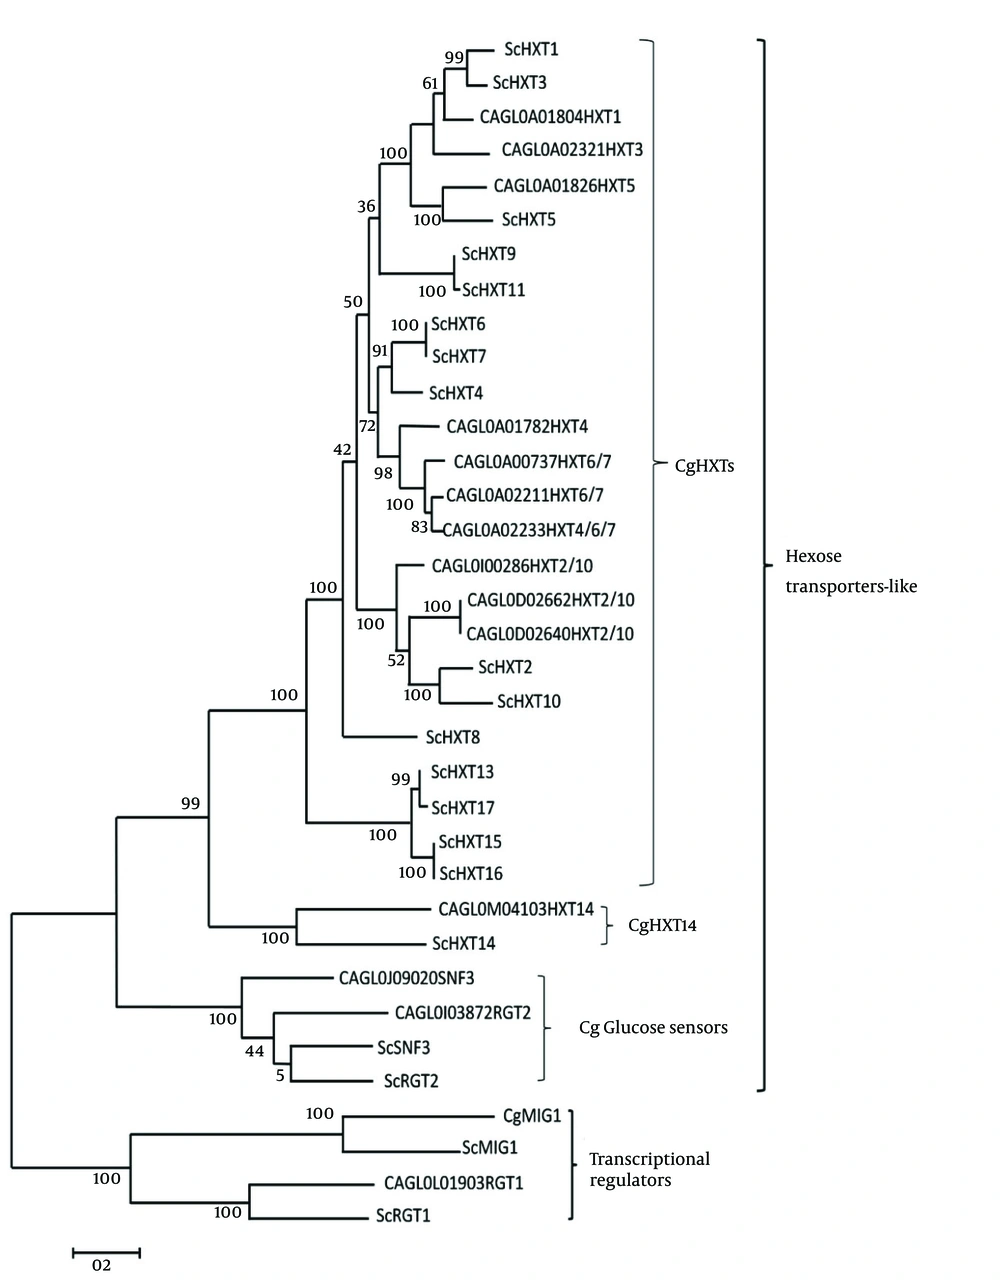
Two main groups of C. glabrata glucose-sensing related proteins were identified by bootstrap maximum-likelihood analysis with S. cerevisiae: first, transcriptional regulators and second, the hexose transporter -like proteins (Figure 1). The clade of C. glabrata transcriptional regulator consisted of CgMig1 and CgRgt1, which were grouped with ScMig1 and ScRgt1 (Figure 1). Besides, the clade of hexose transporter like-protein group consisted of three sub clades: first, the CgHxt14, second, the C. glabrata glucose sensors, and third, the CgHxts (Figure 1). Sub clade C. glabrata glucose sensors contains two glucose sensor-like proteins (SNF3 (CAGL0J09020g) and Rgt2 (CAGL0I03872 g)) with a longer cytoplasmic tail. A copy of 25-amino acid motif was found in both CgSnf3 and CgRgt2 (Figure 2) as found in S. cerevisiae glucose sensors. On the other hand, there were ten hexose transporters found in C. glabrata within the subclade HXTs with approximately 530 - 590 amino acids in length. Generally, C. glabrata hexose transporters were found to be similar to each other and they could be categorized to three main groups: CgHxt2/10, CgHxt1/3/5 and CgHxt4/6/7 (Figure 1).
Initial trees for the heuristic search were obtained automatically by applying neighbor-joining and BioNJ algorithms to a matrix of pairwise distances estimated using a Jones-Taylor-Thornton (JTT) model and then selecting the topology with superior log likelihood value. The analysis involved 35 glucose sensing-related amino acid sequences from S. cerevisiae and C. glabrata. The numbers on branches denote bootstrap values (100 replicates).
4.2. Growth Assay of Candida glabrata in Response to Different Glucose Concentrations
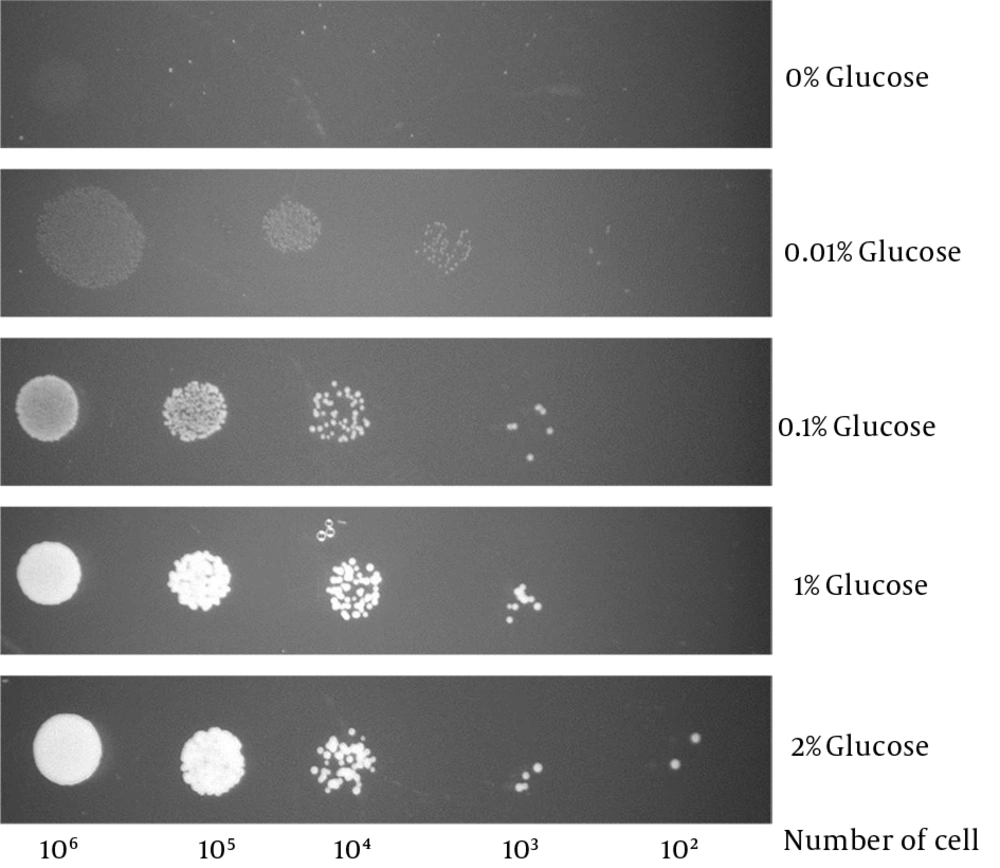
Candida glabrata was able to survive in glucose levels as low as 0.01% (Figure 3). This is far below the human blood glucose level (0.05% - 0.1%) (16) thus suggests that C. glabrata is likely to be equipped with a sensitive glucose sensing mechanism to sense and transport such low levels of glucose.
4.3. qRT-PCR analysis of Selected Glucose-Sensing Related Genes in Response to Different Glucose Concentrations
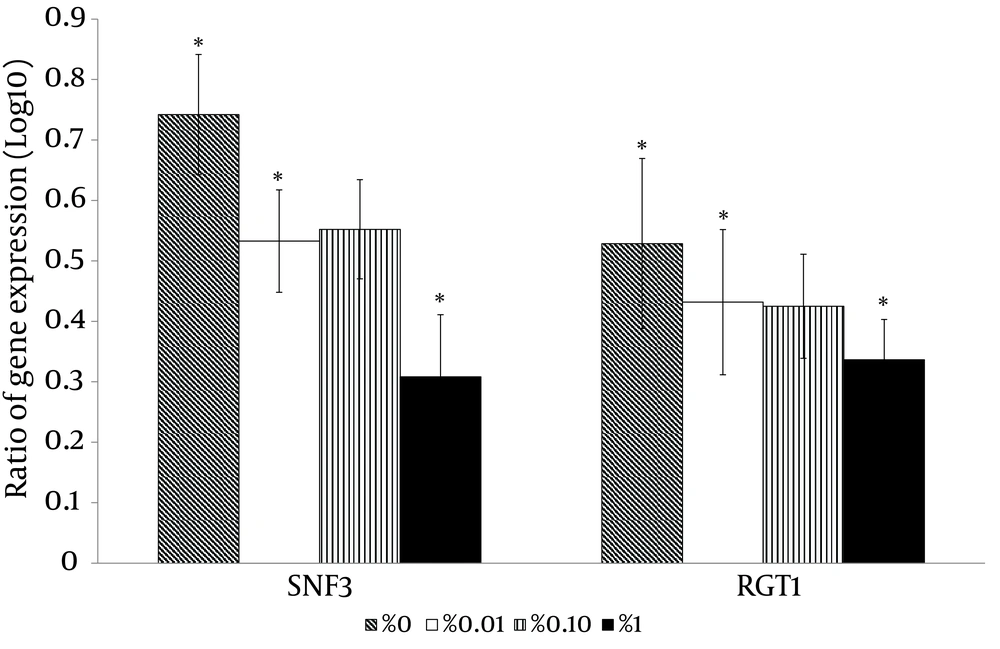
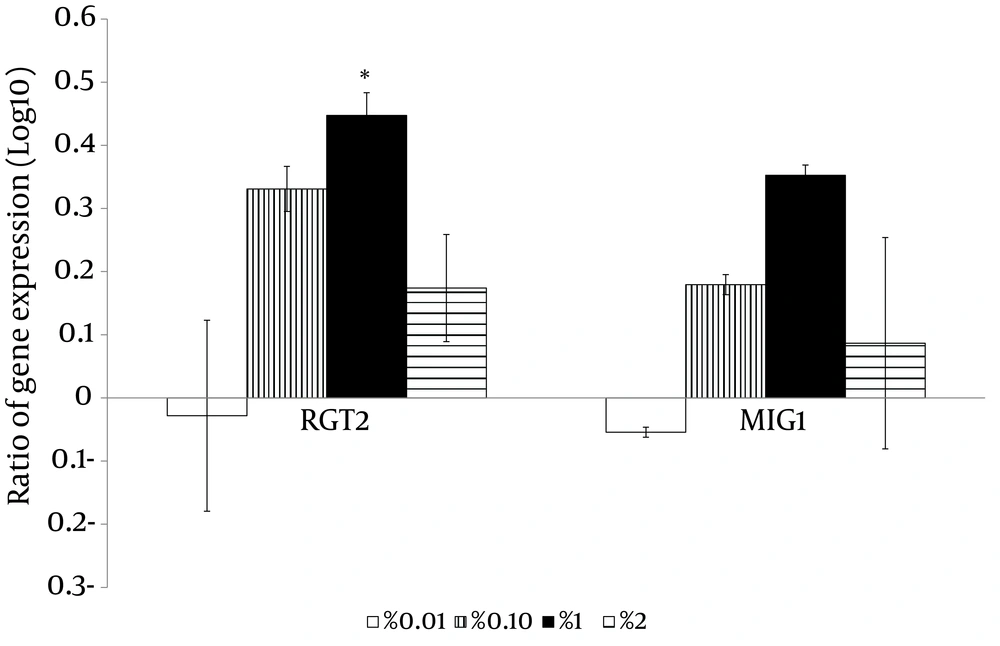
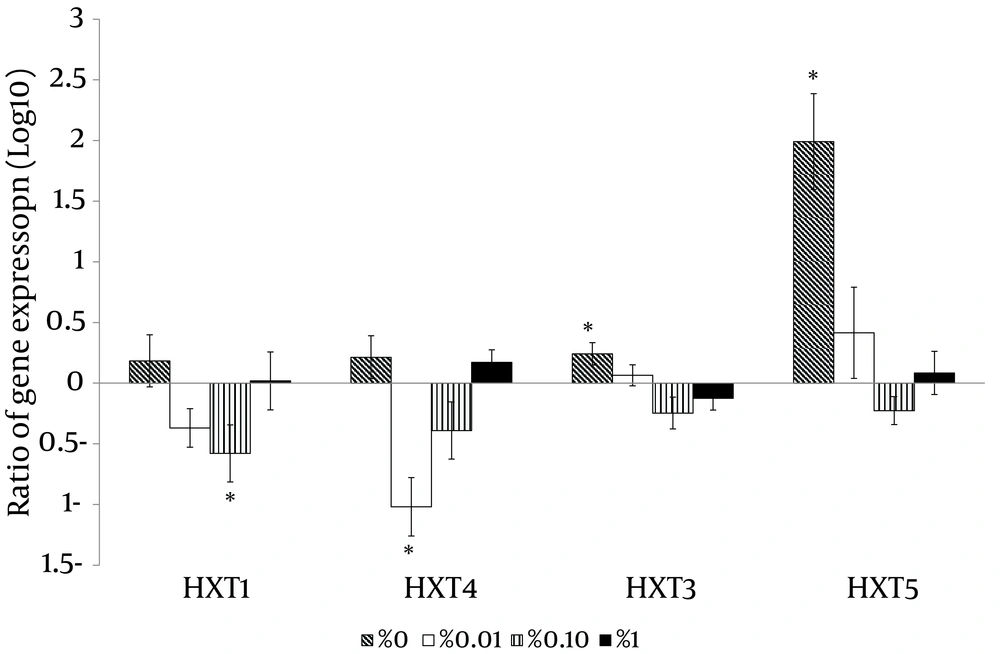
With the high glucose control experiments (2% glucose) as a baseline, the putative high affinity glucose sensor, SNF3 (CAGL0J09020g), and the putative downstream transcriptional repressor, RGT1 (CAGL0L01903g), were found to have similar expression patterns (Figure 4). Both genes were significantly up-regulated in no (0%), low (0.01%) and moderately high (1%) glucose conditions (Figure 4). On the other hand, the experiment with no glucose control (0% glucose) as baseline showed that the putative low affinity glucose sensor, RGT2 (CAGL0I03872 g), was significantly up-regulated in the moderately high glucose condition (1%) (Figure 4). Meanwhile, the putative downstream transcriptional repressor, MIG1 (CAGL0A01628g), was found to be responsive to the high surrounding glucose concentration (Figure 5). For the hexose transporters gene expression, only four candidates were selected for qRT-PCR analysis after screening through semi-quantitative reverse transcriptase-PCR. These hexose transporter genes were selected as they showed distinct gene expression levels (data not shown). In the high glucose control (2%), both expression of putative hexose transporter HXT1 (CAGL0A01804g) and HXT4 (CAGL0A01782g) were found to be higher in no glucose (0%) and high glucose conditions (2%) (Figure 6). Meanwhile, HXT3 (CAGL0A0231g) and HXT5 (CAGL0A01826g) were up-regulated significantly only under no (0%) glucose conditions (Figure 6).
5. Discussion
The ability of a microorganism to sense and transport glucose is crucial for its survival and pathogenicity in the host. Our study aimed to identify the key genes of the glucose sensing mechanism in C. glabrata, an emerging fungal pathogen, with the aid of the genomic profile available for S. cerevisiae. The results showed that C. glabrata SNF3 and Rgt2 protein were similar to their counterpart in S. cerevisiae (59% and 60%). ScSNF3 and ScRGT2 encode a protein with 12 predicted transmembrane-spanning domains and share only low similarity (30%) with other Hxt proteins (32). Saccharomyces cerevisiae with SNF3-deleted mutants was found to have lost the ability to grow fermentatively at low concentrations of glucose with impaired HXT2 expression (33) and this has led to the view that Snf3 is a high affinity glucose sensor in S. cerevisiae. On the other hand, deletion of ScRGT2 led to low expression of HXT1, which suggests the role of RGT2 as a low affinity glucose sensor of S. cerevisiae (33). Both ScSnf3 and ScRgt2 were found with unusual long C-terminal segments (341 amino acids in Snf3 and 218 amino acids in Rgt2). This molecular structure is distinct from other members of the hexose transporter family as none of them possess C-terminal tail that is longer than 60 amino acids (32).
The role of the C-terminal tail to transmit intracellular signal for glucose sensing was further confirmed with the generated chimeric protein. The attachment of SNF3 C-terminus to HXT1 and HXT2 has successfully complemented the hexose transporters expression defect found in ScSNF3- and ScRGT2-deleted mutants (34). The functional unit of this C-terminal tail was further discovered with a 25-amino acid sequence. Deletion of all C-terminal tail distal sequences and preservation of this critical 25-amino acid sequence has partially retained the functionality of ScSnf3 and ScRgt2. Interestingly, ScSnf3 was found to possess two copies of this 25-amino acid motif while ScRgt2 possessed only one (34).
In our study, distinct long C-terminal amino acid extensions were observed in both SNF3 and RGT2 of C. glabrata in comparison to other hexose transporter members. This observation suggests that C. glabrata may have retained this conserved region of glucose sensors, inherited from its common ancestor with S. cerevisiae. However, only a copy of a 25-amino acid motif was found in both CgSnf3 and CgRgt2 (Figure 2). In comparison to C. albicans, even though HGT4 and HGT12 were grouped in the same clade, yet only HGT4 with long C-terminal tails was identified as a glucose sensor of C. albicans in a gene knock out study (17, 25). The missing C-terminal tail in HGT12 is believed to support the observation that C-terminal tail is a signature characteristic of glucose sensors.
Besides, for the transcriptional regulator clade, CgRgt1 and CgMig1 are predicted to play the same role as ScRgt1 and ScMig1, where the latter serves as a glucose responsive transcription factor by regulating the expression of hexose transporters (7, 35). The qRT-PCR result is supportive of this prediction as both the RGT1 and MIG1 were found to be responsive to low and high surrounding glucose concentrations, respectively (Figures 4 and 5). The role of RGT1 and MIG1, as the key links that control the expression of hexose transporters and glucose sensors in response to different glucose concentrations, was also determined in C. albicans (36). In addition, sub clade CgHxt14 (CAGL0M04103g) was found to be distinct from other hexose transporter-like proteins. This may be due to its native role as a glucose transporter for the mitochondria. Unlike other hexose transporters, which are located in the cell membrane, ScHXT14 was found to be part of a mitochondria protein as reported in a mitochondria proteomic study done for S. cerevisiae (37). Notably, no ortholog of HXT14 was found in C. albicans (17). This may further indicate the dissimilar evolutionarily relationship between C. glabrata and C. albicans.
Notably, the number of C. glabrata hexose transporters (11 HXTs) were found to be less than S. cerevisiae (17 HXTs) and C. albicans (20 HGTs) (17, 34). In addition, there were no orthologs of ScHXT11 or ScHXT9 found in C. glabrata, which were previously reported as drug resistance-related transporters in S. cerevisiae (38). This suggests that C. glabrata may not rely on this HXT-like transporter mechanism to counteract with the antifungal drug. In addition, ScHXT11 or ScHXT9 were also not found in C. albicans (17). Although the number of hexose transporters found in C. glabrata is different from S. cerevisiae and C. albicans, both hexose transporters and glucose sensors of C. glabrata were found to possess several sites of high amino acid conservation, such as GR and GRK/C/R, when compared to C. albicans and S. cerevisiae (17). Interestingly, both CAGL0D02662g and CAGL0D02640g were found to be indistinguishable in terms of nucleotide sequences and length yet different in their chromosomal location. These two copies of identical genes are unusual to be seen in C. glabrata, a haploid organism. Besides, both CAGL0D02233g and CAGL0D02211g were also found to be highly similar with 96% identity.
For the gene expression analysis, this study revealed that C. glabrata, like S. cerevisiae and C. albicans (15, 16) was sensitive to a wide range of glucose concentrations from 0% to 2%, in its living environment. Changes in expression of target genes were observed within two hours of the incubation time upon exposure to different concentrations of glucose. These findings showed that C. glabrata is able to detect and respond according to the available glucose in its surrounding, which in turn, may greatly aid the species in the process of the colonization and establishment of infections in human niches. A similar study done by Brown et al. (25) on C. albicans showed a high degree of concordance with our data, where C. albicans putative glucose sensor, HGT4, was expressed significantly when the glucose source was low. A similar observation was made for C. glabrata on the linkage between glucose sensors and transcriptional regulators. For the high glucose affinity lineage, the expression patterns of the SNF3 and RGT1 were in high degree of concordance and the same was observed for the low glucose affinity lineage, RGT2 and MIG1. These observations reveal a possible collaboration among glucose sensors and transcriptional regulators in responding to the dynamic environment in which the amount of glucose is changing. Notably, the putative HXT3 (CAGL0A02321g) and HXT5 (CAGL0A01826g) genes were highly expressed in the presence of no glucose and this might suggest the potential role of these two transporters as high affinity hexose transporters. The expression of putative HXT1 (CAGL0A01804g) and HXT4 (CAGL0A01782g) was high under both no glucose (0%) and high glucose (2%) conditions. This highlights the possible role of HXT1 (CAGL0A01804g) and HXT4 (CAGL0A01782g) in glucose transportation at two extreme conditions (0% and 2%) with regulation from both low and high affinity glucose sensors.
In conclusion, C. glabrata was found to have the ability to withstand low glucose environments and this points to the possible role of glucose-sensing in aiding the survival of C. glabrata. The findings imply the interrelatedness of glucose-sensing-related members between C. glabrata and S. cerevisiae. In addition, the gene expression analyses of this study provided better insight into the glucose sensing key members of C. glabrata. The low glucose affinity glucose sensor and the downstream transcription factor, RGT2 and MIG1, were sensitive to high glucose concentrations while the high glucose affinity sensor and the downstream transcription factor, SNF3 and RGT1, were up-regulated at low glucose concentrations. This study also demonstrated the possible role of glucose sensing by SNF3 and RGT2 and the potential transcriptional regulators, RGT1 and MIG1, in the glucose uptake mechanisms in C. glabrata. Our results for expression profiling of these genes serve as exploratory data for forthcoming studies in deciphering the complex mechanism of glucose sensing and transporting in C. glabrata. Future works, such as investigating protein expression and performing gene knockout experiment by involving more isolates of C. glabrata will further assist in explaining the operative role of these genes in the physiological process of C. glabrata and thus shed light on the understanding of the comprehensive picture of glucose sensing mechanisms in the species.
