1. Background
Bacterial biofilm can cause problems in almost any natural, industrial, or medical ecosystem. In the food industry, food items can become contaminated by pathogenic or non-pathogenic microorganisms (1). Pathogenic bacteria can cause disease via the release of secretory toxins in food; in the case of non-pathogenic microorganisms, contamination can result in economic losses (2).
Biofilm is an accumulation of bacteria that is surrounded by a solution of extracellular matrix proteins and which causes bacteria to bond to each other and to the surface. This multi-layer structure protects the bacteria from the host’s immune system responses; moreover, studies show that extraordinary resistance to various antibiotics can result from biofilm formation in bacteria. Biofilms are formed in water systems as well as in items relating to the medical equipment and food industries (3). Via this method of growth, bacteria have developed a compelling means of escalating their own survival (2). This often results in the increase of bacterial resistance to adverse factors such as environmental moisture reduction, radiation, toxins, changes in pH, temperature fluctuations, hydrodynamic pressure, hydrolytic agents, phages, detergents, and antibiotics (3). This resistance, in turn, facilitates the transfer of genetic material between bacteria (4, 5). Furthermore, the formation of biofilm on devices, equipment, and medical devices can lead to contamination and the subsequent transmission of nosocomial infections (4).
Escherichia coli is often one of the contaminating factors of various nutritive substances, particularly of dairy products such as yogurt and of fruit and fruit juices. Certain concentrations of sucrose sugars, glucose, fructose, and lactose are present in these products. The question now is: what effect do these sugars, in their special concentrations, have on the antimicrobial activity of the antimicrobial material?
To limit or even inhibit biofilm formation (biological contamination), we must first understand the mechanisms that facilitate a bacteria’s initial attachment to a cell surface. The physico-chemical interactions involved in the infection of inanimate surfaces (polymers, metals, glass) are acid-based and principally constitute Van Der Waals electrostatic forces (5). Various studies have shown that any physical or chemical change in an environment that surrounds a bacteria can be involved in biofilm formation. The presence of different sugars in a bacterial environment or even the presence of drugs can cause changes to the physico-chemical properties of a constant surface, which in turn leads to indirect changes in the formation of biofilm (6).
2. Methods
2.1. Bacterial Strains and Culture Conditions
For this study, standard pathogenic E. coli185p strains were prepared in the UMG laboratory in Lyon, France. LBB (Luria-Bertani Broth, Merck, Germany) solutions with 30% glycerol and stored at -80°C were used.
2.2. Bacterial Storage Conditions
In this study, stocks of samples were stored at -80°C, prepared in the LBB, and kept at -20°C for daily use.
<b>2.3</b>. Determination and Comparison of the Growth Curve of <i>E. coli</i> in Two Different Sugar Culture Mediums
Evaluation of the growth curves was performed by measuring the absorbance at 400 nm using a spectrophotometer (Spectronic 20 Genesis, USA) and counting the number of living cells; this was accomplished via the pour plate method. Experiments were performed in three mediums: an LBB, an LBB medium with 15% sucrose (Sigma), and an LBB medium with 8 - 7% sucrose and 10% glucose (Sigma). All experiments were performed in 20°C conditions. The time required to add 1 ml of -20°C stoke to 100 ml of the culture medium was considered the “zero time”. The resulting optical density was measured every two hours (until 54 hours had passed).
2.4. Preparation of Surfaces and Bacterial Suspensions to Test Adhesion and Biofilm Growth
2.4.1 Solid Surfaces
In this study, two types of surfaces that are regularly used in the medical and food industries were selected. The selected surfaces included stainless steel, which is a medium hydrophilic surface, and polyethylene terephthalate (PET), which is a hydrophilic surface.
2.4.2. Preparation and Treatment of the Selected Surfaces
Solid surfaces (3 × 1) were first cleaned in the RBS 35 (Sigma) with agitation for 15 minutes. Then, the surfaces were rinsed with hot water an additional five times for five minutes. Finally, the surfaces were washed in sterile water five times for five minutes. Eventually, the surfaces were placed in a laminar flow cabinet for drying.
2.5. Determination of the Physico-Chemical Properties
2.5.1. Micro-Organisms
Hydrophobicity and electron donor-acceptor properties were determined via the microbial adhesion to solvents method (MATS) (7). According to this method, four types of solvents (Sigma) were used, including chloroform, ethyl acetate, hexadecane, and decane. For the purposes of this study, researchers first prepared a bacterial suspension-delivered OD (Optical Density) at 400 nm to 0.08 (A0). Then, 2.4 ml of room temperature bacterial suspension was added to 0.4 ml of each of the above solvents. The solvents were kept stationary for 15 minutes, after which time they were subjected to vortex. Finally, the OD of the aqueous phase was measured at 400 nm (A1). The adhesion percentage of microorganisms to the above solvents was calculated according to the following formula:

2.5.2. Solid Surfaces
Measurements of the physico-chemical properties of the desired surfaces were completed by calculating the contact angle. For the purposes of this study, three liquids with specific energetic characteristics were selected, including distilled water (MilliQ, Millipore), formamid (Sigma), and D-iodine methane (Sigma). The surface energy of steel and polyethylene terephthalate (γs), as well as the accompanying Van der Waals forces (γsLW), electron donors (γs-), and electron acceptors (γs+), were calculated according to the following YOUNG-VAN OSS formula (VAN OSS, 1988):

2.6. Attached Cell-to-Surface Count
2.6.1. Total Flora
In this study, bacteria were kept in a stationary phase during all tests. Acridine orange was used in order to observe and evaluate the total amount of flora (living, dead, and uncultivable bacteria). The surfaces, which had been contaminated with bacteria and stained with 0.01% Acridine orange for 15 minutes, were placed in a laminar flow cabinet after being washed with sterile water. The stained surfaces were observed by an Epi-fluorescence microscope DMBL Leica EFM (objective × 10).
2.6.2. Viable Cultivable Flora
First, contaminated samples were placed in 6 ml of sterile saline. Sonication was performed at 35°C for two minutes in order to count the number of attached viable bacteria to surfaces (Ultrasonic 250 Jamestown, NY, USA, 40 kHz). Then, the samples were shaken mechanically for 30 seconds using a rotator. Finally, the serial dilution method was used to accomplish the bacterial count. It should be noted that bacteria were cultured in an LBB, and 24 hours’ incubation at 30°C was performed.
2.7. Statistical Analyses
The data were analyzed according to the GLM procedures found in the SAS software version 8.0 (SAS Institute Inc., Cary, NC) and the SPSS 16.
3. Results
3.1. Effects of Carbohydrates on the Bacterial Growth Curve
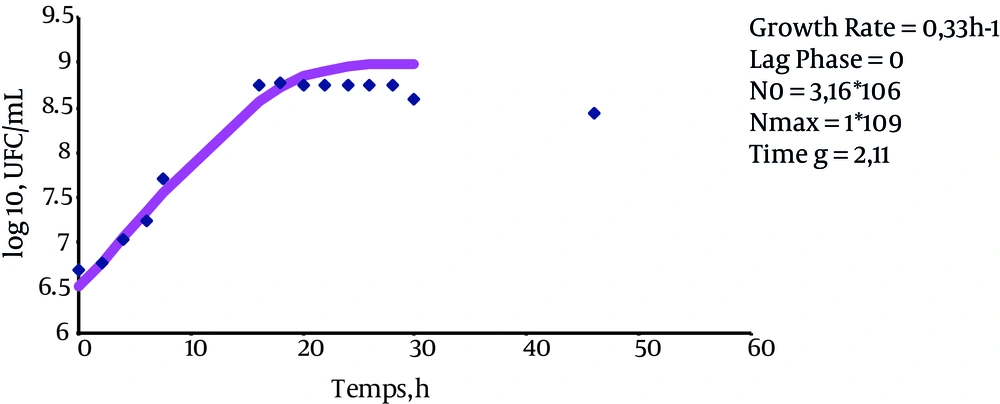
An empirical model was used to calculate the generation time and the lag phase following the measurement of optical density and the counting of bacterial numbers by serial dilution in three mediums with different concentrations of glucose.
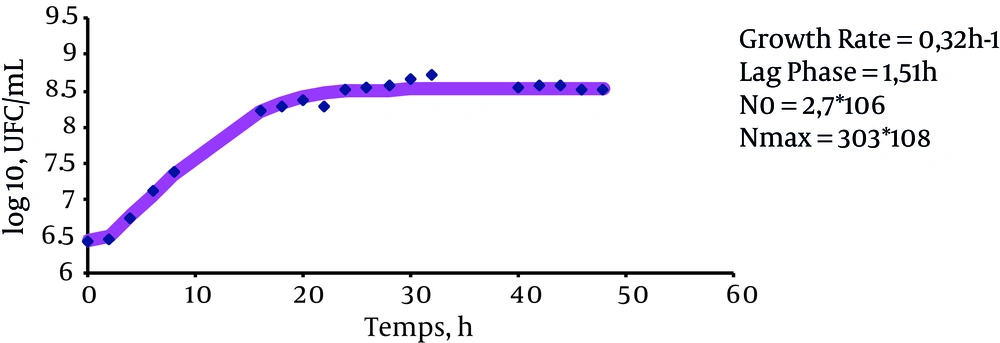
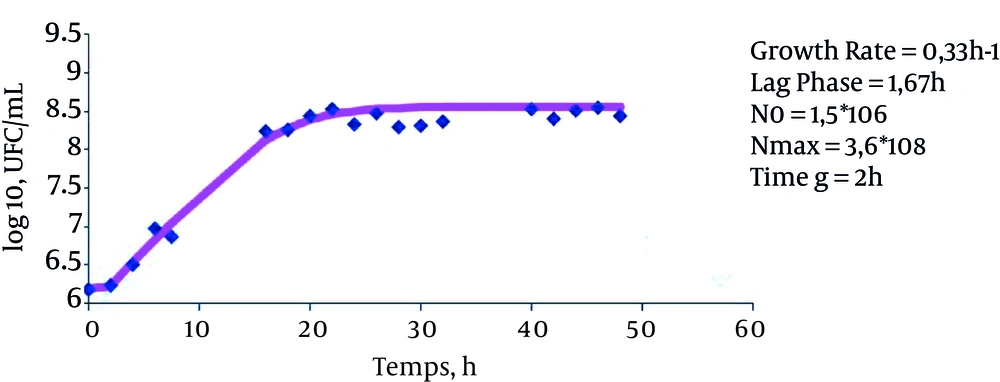
The results indicate that the growth rate of bacteria in LBB is 0.33 ± 0.007 h-1 (P value = 0.147), the growth rate of bacteria in LBB + 15% sucrose is 0.32 ± 0.4 hours-1 (P value = 0.0983), and the growth rate of bacteria in LBB + 7% sucrose + 10% glucose is 0.33 ± 0.007 hours-1 (P value = 0.128). These results suggest that the presence of these sugars does not affect the bacterial growth rate (Figures 1, 2 and 3).
The lag phase in LBB was equal to zero (P value = 0.0001). However, the lag phase was 1.51 ± 0.38 hours for the cultured bacteria in LBB + 15% sucrose (P value = 0.0063) and 1.67 ± 0.12 (P value = 0.0013) for the cultivated bacteria in LBB + 7% sucrose + 10% glucose. This indicates that the above sugars serve to increase the length of the stationary phase.
Eventually, the generation time of these bacteria in different mediums was measured. The results of these measurements indicate that the generation time was 2.11 hours for cultured bacteria in LBB, 2.12 hours for cultured bacteria in LBB + 15% sucrose, and 2 hours for cultured bacteria in LBB + 7% sucrose + 10% glucose (P value < 0.05).
3.2. Physicochemical Properties of the Bacterial Cell Surface
Experiments were performed during the stationary phase of bacterial growth. Hydrophilic-hydrophobic properties of E. coli 189p were determined via the MATS method following growth in each of the selected mediums. The tendency percentages (affinity%) of the bacterial cells to each of used solvents are provided below in Table 1.
The structure and nature of chemical groups on the surface of bacterial cells determines its physicochemical properties (8). These characteristics are not fixed; rather, they are dependent on the physical and chemical factors that surround the bacterial cell, even in different culture mediums (9). Escherichia coli 189p is super-hydrophilic in the LBB medium because its affinity with apolar solvents is low (decane 0.86% et hexadecane 0.0%). Differences in the affinity of E. coli 189p in this medium following the addition of chloroform and hexadecane indicate the electron donor properties of this bacteria. Similarly, the electron donor properties of the bacteria cultured in LBB + 15% sucrose were also demonstrated. However, its low affinity with apolar hydrophobic solvents (decane and hexadecane) represents the hydrophilic properties of the bacterial surface. Nonetheless, the bacteria demonstrated “Lewis acid” properties (revealing a great affinity with chloroform [64.02] and also with ethyl acetate [34.97] ) when cultured in an LBB + 7% sucrose + 10% glucose medium. Conversely, the bacteria displayed “Lewis base” properties when cultured in the two other mediums. It is noteworthy that the electron donor property was stronger than the electron acceptor property. In this medium, E. coli 189p had a hydrophilic property, such as in the two previous mediums (P value < 0.05).
3.3. Physico-Chemical Properties of the Selected Surfaces
Contact angle measurements of the selected surfaces were performed for each of the three selected liquids (as shown in Table 2).
| Steel | PET | |
|---|---|---|
| θ Distilled water | 74.13 ± 1.23 | 76.18 ± 2.42 |
| θ diodomethane | 52.2 ± 0.81 | 53.6 ± 1.20 |
| θ Formamide | 50.65 ± 2.40 | 33.13 ± 1.36 |
Values of the Measured Contact Angles (°) of the Different Liquids to the Surface of the Steel and the PET
The results indicate that steel is hydrophilic (the contact angle with water was 74.13°), which is associated with a “Lewis base” (γ- = 7.9 mJ/m2) (P value = 0.0004). Additionally, PET has hydrophilic properties (the contact angle with water was 76.18°), which also indicates that it has “Lewis base” properties (γ- = 7 mJ/m2) (P value = 0.009).
3.4. Adhesion and Bacterial Biofilm Analysis
The number of viable bacteria attached to both studied surfaces (steel and PET) was counted after 3 hours and after 24 hours. An Epi-fluorescent microscope was used to view the total number of bacteria attached to the surfaces (living or non-living). Cultivable live bacteria were cultured in the LBB and were reported according to log10 (cells/cm²).
3.5. Total Flora
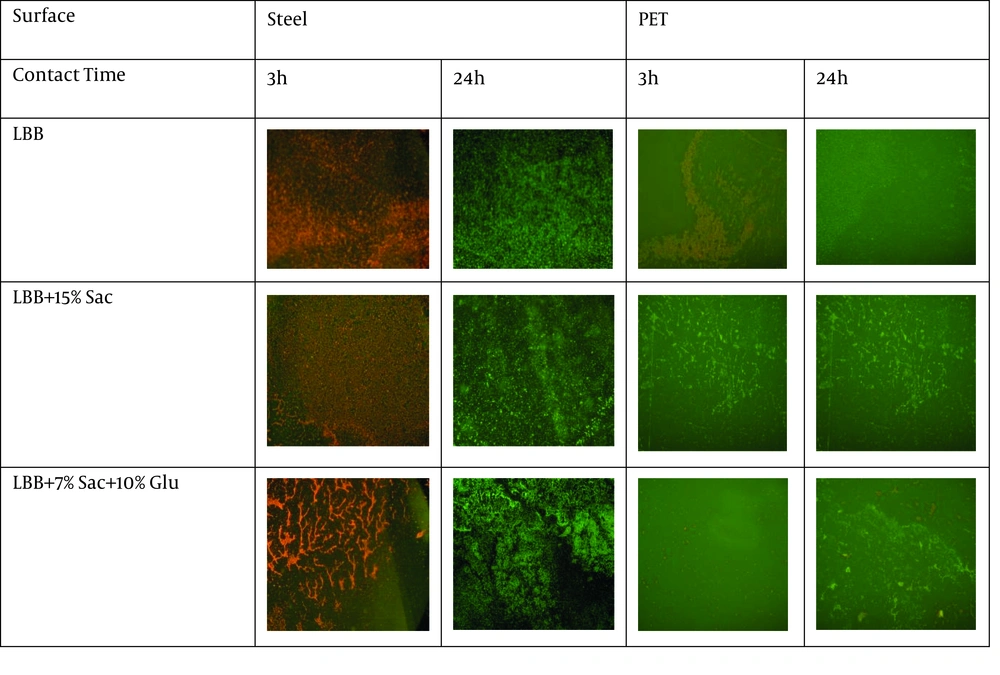
Multiple shots taken by microscope Epi-fluorescence indicate the number of bacteria attached to the surface and reveal levels of biofilm formation. The bacterial percentages found on the surface of each material were calculated and are presented in Figure 4.
These bacteria can be homogeneously spread upon the surface (as was the case for the cultured bacteria in LBB and in LBB + 15% sucrose) or perched on the target’s surface in a grid-like fashion (as occurred with the cultured bacteria in LBB + 7% sucrose + 10% glucose) (Figure 4).
3.6. Viable Cultivable Flora
The results of the tests for adhesion and biofilm formation on the steel and polyethylene terephthalate surfaces taken at 3 hours and at 24 hours are shown below (Table 3).
| Medium | Steel 3, H, (UFC/cm2) | Steel 24, H, (UFC/cm2) | PET 3, H, (UFC/cm2) | PET 24, H, (UFC/cm2) |
|---|---|---|---|---|
| LBB | 1.7 × 10⁶ | 6.59 × 10⁶ | 9.75 × 10⁵ | 7.03 × 10⁶ |
| LBB + 15% sucrose | 1.35 × 10⁶ | 5.99 × 10⁶ | 5.55 × 10⁵ | 2.40 × 10⁶ |
| LBB + 7% sucrose + 10% glucose | 8.07 × 10⁵ | 2.54 × 10⁵ | 1 × 10⁶ | 1.89 × 10⁶ |
Results of Adhesion Tests for Contact Bacteria/Support at 3 and 24 Hours
Hydrophilic bacteria bind more strongly to hydrophilic surfaces, and bacteria with hydrophobic properties bind more potently to hydrophobic surfaces (10). The previous tests showed that both surfaces chosen for this project are hydrophilic. However, the studied bacteria demonstrated hydrophilic properties; therefore, it is expected that the cultured bacteria in each of the three mediums would bind to both target surfaces and form biofilms. Viable cells cultured in LBB count for E. coli, which has strong hydrophilic properties that are indicative of its strong bond with steel (6.76 ± 0.30 log10) (P value = 0.0031) and polyethylene terephthalate (6.69 ± 0.53 log10) (P value = 0.068). Similarly, for the bacteria cultured in LBB + 15% sucrose, a number of bacteria attached to the steel (6.77 ± 0.028 log10) (P value = 0.0090) and to PET (6.38 ± 0.0 log10) (P value = 0.012). Finally, the number of bacteria that attached to the steel for the cultured bacteria in LBB + 10% glucose + 7% sucrose was 6.29 ± 0.45 log10.
4. Discussion
In the food industry, microorganisms are capable of causing biofilms to form on wet surfaces. The adhesion of food spoiling bacteria and pathogens to surfaces that come into contact with food could be potential sources of contamination and disease transmission (11). Physico-chemical conditions (temperature, pH, sugar, and salt compounds) are effective facilitators of biofilm formation. The above conditions cause changes to bacterial cell wall components, surface physicochemical properties such as hydrophobicity, and electron donor and acceptor properties (12).
The selected surfaces have many applications to the food and medical industries, and the selected bacteria are one of the most significant causes of corruption and disease for the food industry. Sugar’s effect on the bacterial growth curve was examined via the creation of an adaptation phase (stationary phase), which was higher for the cultured bacteria in the LBB + 10% glucose + 7% sucrose solution than for the cultured bacteria in the LBB + 15% sucrose solution. The bacterial growth rate was the same in all three mediums. Results of the study of the physicochemical properties of bacteria in different candied mediums indicate that the examined bacteria is extremely hydrophilic in the LBB and LBB + 15% sucrose solutions. Moreover, the bacteria cultured in the LBB + 7% sucrose + 10% glucose solution had hydrophilic properties but also demonstrated a “Lewis acid-base” property.
The results of measuring the contact angles of the surfaces (steel and polyethylene terephthalate) indicate the hydrophilic surface properties of the desired surfaces. The percent of surface coverage by E. coli 185p was analyzed by fluorescent microscopy and image J programing; results indicate the formation of biofilms on both surfaces in all three mediums. Biofilm formation was expected in all conditions, since inanimate coats of the bacterial cell surface have hydrophilic properties, as indicated by the results. Additionally, because steel had a stronger hydrophilic surface than polyethylene terephthalate, more biofilm was formed on that surface. However, results of the measurement and counting of participating biofilm bacteria revealed an increase in the number of bacteria at 24 hours as compared to the measurements taken at 3 hours; this result seems reasonable, as more bacteria attach to surfaces with the passage of time. In general, the amount of biofilm formation and the adhesion ability of bacteria in the LBB + 7% sucrose + 10% glucose solution was less significant than that found in the cultured bacteria of LBB and LBB + 15% sucrose. Because the above medium can contain Lewis acid-base properties of bacteria, the bacteria in the environment no longer demonstrates open Luiz properties; indeed, these bacteria contain Lewis base properties in the two other mediums. A study conducted by Jackson et al. on the effect of glucose on the biofilm formation of E. coli showed that glucose inhibits the biofilm formation that is mediated by catabolic suppression systems (CRP) (13).
A study performed by Yang et al. on the effects of sugars and antimicrobial substances on oral microbial biofilm formation demonstrated that sucrose increases biofilm formation more significantly than does glucose, fructose, galactose, and lactose (14). In 2011, a study conducted by Michu et al. on the effects of glucose and salt on the biofilm formation of staphylococcus epidermidis on surfaces of stainless steel found that while the presence of salt can increase biofilm formation, the presence of salt and glucose strongly increases biofilm formation (15). Xu et al. examined biofilm formation in different salt concentrations (10 - 0%) of Listeria monocytogenes, Staphylococcus aureus, Shigella boydii, and Salmonella typhimurium. Results showed that increases in the concentration of salt reduces biofilm formation; however, a significant reduction was observed in the 2% concentration. One reason for this decrease in biofilm formation involves the reduced hydrophobicity of bacterial cells in such conditions (16).
A study performed Bonaventura et al. on the effect of temperature on the biofilm formation of 44 strains of Listeria monocytogenes on different food contact surfaces revealed that biofilm formation on glass surfaces is greater than that seen on polystyrene surfaces or on stainless steel at 4°C, 12°C, and 22°C (17). A study conducted by Giaouris et al. was carried out using the bead vortexing and conductance measurements methods; this study examined the effects of temperature (5°C, 20°C, and 37°C) and pH (4.5, 5.5, 6.5, and 7.4) on the biofilm formation of Salmonella enterica enteritidis PT4 on of stainless steel surfaces. Results indicated that most of the biofilm formed after 6 days at 20°C and that at this temperature, the amount of biofilm formation depended on the pH value after the seventh day (18).
A study performed by Pan et al. on the effects of glucose (at a concentration of 0.25% to 10.0% wt/vol), salt (0.5 to 7%), and temperature (22.5°C, 30°C, and 37°C) on the biofilm formation of 36 strains of Listeria monocytogenes found that 97% of strains (35 strains) formed thicker biofilms in mediums containing glucose (1% to 10%), as compared with glucose-free mediums, at all three temperatures. Additionally, most strains formed more biofilms in the 2 - 5% salt solutions. It is possible that glucose, salt, and temperature have a synergistic effect on biofilm formation (19). In a study conducted by Chai et al. on the effect of galactose metabolism on the biofilm formation of Bacillus subtilis, it was found that galactose metabolism genes play a major role in biofilm formation and the development of a polysaccharide matrix (EPS) (20).
Changes in the nature and bacterial surroundings of an environment lead to changes in bacterial cell surfaces and biofilm formation (1, 21). In this study, concentrations of selected sugars (equivalent to the concentration of sugars in fruit yogurt) somewhat reduced the level of bacterial attachment and biofilm formation on two surfaces (polyethylene terephthalate for the packaging of fruit yogurt, and stainless steel for the storage of yogurt); this can help to prevent the attachment of bacteria as well as its pathogenesis. However, the types of microorganisms that are able to grow in these special foods are often variable; therefore, the extrinsic and intrinsic factors of each food and of each bacteria must be considered.


