1. Background
Tuberculosis (TB) is the world's second-deadliest infectious disease after Human Immunodeficiency Virus Infection/Acquired Immunodeficiency Syndrome (HIV/AID), and the most frequent cause of mortality (1, 2). Currently about one-third of the world’s population (2 billion people) are infected with TB (1, 3). About 8 to 10 million new infectious TB cases are reported annually, of which 2.3 million lose their life each year (4). The highest incidence of TB has been reported in Asia (55%) and Africa (30%), which is about 700 cases per 100,000 people (5). The incidence rate of TB in Iran based on the World Health Organization (WHO) report in 2011 has been estimated to be 17 per 100,000 individuals, which has had a significant decrease compared to 1990 (36/100,000) (6). Mashhad, the city located northeast of Iran, has a high prevalence of TB as it shares a border with Afghanistan and there is a high immigration of refugees to this city (7).
Human immunodeficiency virus infection increases susceptibility to TB and in 2011, about 40% of TB patients also had HIV infection (8, 9). Tuberculosis has many clinical manifestations and the most common form is pulmonary tuberculosis. Patients with pulmonary tuberculosis spread bacilli in aerosol and transmit their infection to other people (10). Cellular immune response is a critical component of protective immunity against Mycobacterium tuberculosis. It has been reported that CD4+ effector T cells, which secrete immunocompetent cytokines such as interferon gamma (IFNγ), have a pivotal role in elimination of M. tuberculosis (9, 11). Activation of Th1 cells is essential to control TB infection. Furthermore, IL-4 and other Th2 related markers such as IgE and IgG4 can be found frequently in patients with pulmonary tuberculosis, and the synergistic effect between TNF-α and IL-4 causes disease progression and fibrosis (12). It seems that TNF-α and IL-4 are more effective than IL-4 alone to suppress Th1 response against M. tuberculosis (13). Therefore, low Th1 and high Th2 activity is associated with the failure of immune response against TB (12, 14). T regulatory (Treg) cells suppress immune responses against pathogens such as M. tuberculosis and express the forkhead winged-helix family transcriptional repressor p3 (FoxP3), which has suppressive activity (15).
Development and function of natural Treg (n Treg) is dependent on the expression of Foxp3 (16). FoxP3 interacts with Nuclear Factor-kB (NFkB) and represses the expression of cytokines such as IL-2, IL-4 and IFN-γ, which lead to impaired cell proliferation (17). In addition, Treg cells express CTLA-4 on their surface, which binds to CD80 and CD86, and has an inhibitory role on T cell activation (18). The number of cells expressing these markers has been reported to be decreased in several chronic inflammatory disorders (19-21). Nonetheless, the number of Treg cells in patients with active TB increases in peripheral blood cells (22). It has also been reported that CD4+ CD25+ FoxP3+ T cells and FoxP3 mRNA increase in blood or at the site of infection in patients with active TB (23). More recently, Pang et al. demonstrated that the frequency of nTreg cells and inductive regulatory T cells increase in peripheral blood samples of patients with active TB (24). In contrast, it has been reported that the expression of Foxp3 decreases in patients with newly diagnosed TB (25). Since, only 5 - 10% of individuals infected by TB develop active disease (2723 to 28), and there are controversial data regarding the role of Treg cells in TB, evaluation of these cells in infected individuals is imperative and further studies are needed to clarify the role of Treg cells in disease development.
2. Objectives
The aim of this study was to evaluate the frequency CD4+ CD25+ Treg cells, and FoxP3 and Cytotoxic T Lymphocyte Antigen 4 (CTLA-4) gene expressions in peripheral blood of patients with tuberculosis and patients with positive tuberculin skin test before and after Peripheral Blood Mononuclear Cells (PBMCs) activation with Purified Protein Derivative (PPD).
3. Patients and Methods
3.1. Study Population
A cross-sectional study was conducted on 29 patients with newly diagnosed pulmonary TB and 19 healthy control subjects who were referred to Ghaem Hospital, Mashhad University of Medical Sciences during September 2011 to March 2012. The diagnosis of the patients was based on TB smear positive test, positive culture, and clinical and radiological features. Subjects with a history of Bacillus Calmette–Guérin (BCG) vaccination at an early age and no history of TB were selected as the control group. The study was approved by the ethics committee (No; 86278) of Mashhad University of Medical Sciences, Mashhad, Iran and informed consent was obtained from all participants. Participants infected with HIV, human T lymphotropic virus type I (HTLV-I), Hepatitis B virus (HBV) and Hepatitis C Virus (HCV) were excluded from the study. Blood samples were collected from all patients and control groups.
3.2. Phenotypic Analysis
Peripheral blood mononuclear cells (PBMCs) were isolated from 10 mL blood samples collected in EDTA–anti-coagulated tubes by standard Ficoll–Hypaque density centrifugation (Cederlane, Canada). Furthermore, CD4+/CD25+, the surface markers of PBMCs were stained by incubation with PE-CY5 conjugated anti-CD4+ (Ebioscience, Germany) and FITC conjugated anti-CD25+ (BD, Ebioscience, USA) at room temperature for 30 minutes. The FITC-mouse IgG1, PE-mouse IgG1 and PE-CY5-mouse IgG1 (BD Ebioscience. USA) were used as isotype controls. To analyze CD4, CD25 and FoxP3 expression, cells were stained with PE-CY5 conjugated anti-CD4 (Ebioscience) and FITC conjugated anti-CD25 (BD Ebioscience); followed by intracellular staining with anti-FoxP3 staining set (BD Ebioscience, USA). After staining, the cells were analyzed by flow cytometer using the Cell Quest software (Coulter, USA). The CD4+ CD25+ lymphocyte population was gated for FoxP3 expression analysis. The percentage of CD4+ CD25+ FoxP3 T cells to total CD4+ T cells, and proportion of FoxP3 cells in CD4+ CD25+ T cells were computed for different groups.
3.3. Gene Expression Analysis by Real-Time Polymerase Chain Reaction
Peripheral Blood Mononuclear Cells were washed twice by culture medium and were subjected to further analysis. The PBMCs were cultured in 12-well plates at a concentration of 1.106 in 1000 μL of RPMI 1640 complete medium (Gibco, USA). The cells were activated by 0.75 TU/ml Purified Protein Derivative (PPD) (SPAN Diagnostic, India) for 72 hours. Next, activated cells were harvested and RNA extraction and cDNA synthesis was performed as follows; RNA was extracted using a TriPure Isolation Kit (Roche Co.) according to manufacturer’s instructions. Treatment with DNase I followed to remove contamination. Reverse transcription reaction was performed with Revert Aid H minus First Strand cDNA Synthesis Kit (Fermentas, Germany). Reverse transcription was carried out at 42°C for 60 minutes followed by RT inactivation at 70°C for five minutes. cDNA was kept at - 20°C until analysis. Amplification was performed by Corbet Research using Quantifast SYBR Green and the Taq man detection Kit (TaKaRa, Japan). Primer and probe sequences are described in Table 1.
| Name | Sequence (5́ - 3́) | Accession Number | Product Length |
|---|---|---|---|
| FoxP3 | 001114377 | 95 bp | |
| Forward | ACTACTTCAATTTCCACACGC | ||
| Reverse | GAGTGTCCGCTGCTTCTCTG | ||
| Probe | TCACCTACGCCACGTTCATCCGCT | ||
| CTLA-4 | 00521404 | 209 bp | |
| Forward | CTCATGTACCCATCGCCATAC | ||
| Reverse | ACATAGACCCCTGTTGTAAGAGG | ||
| β2M | NM_004048.2 | 127 bp | |
| Forward | TTGTCTTTCAGCAAGGACTGG | ||
| Reverse | CCACTTAACTATCTTGGGCTGTG | ||
| Probe | TCACATGGTTCACACGGCAGGCAT |
Polymerase chain reaction conditions by the Taqman method were as follows: holding at 95°C 10 minutes, followed by 40 cycles of denaturation at 95°C for 10 seconds, and annealing and extension at 60°C for 45 seconds. Polymerase chain reaction conditions by SYBR Green method were as follows; holding at 95°C 10 seconds, followed by 40 cycles of denaturation at 95°C for 10 seconds, and annealing and extension at 60 °C for 45 seconds. Standard curves were prepared for target and reference genes. The Rotor Gene software was used to analyze the standards and to carry out the quantifications. Relative expression level of FoxP3 and CTLA-4 mRNA in both activated and non-activated cells were normalized by β2M, as a house keeping gene, and calculated by the 2-ΔΔCt method.
3.4. Statistical Analysis
Data was expressed as mean ± SD. Statistical analysis for paired variables was performed with paired sample t-test. Comparisons of FoxP3 and CTLA-4 gene expression between control group and TB patients were performed using the non-parametric two-tailed Mann-Whitney U-test. The Wilcoxon matched paired t-test was used to analyze the effect of PBMCs activation with PPD on FoxP3 and CTLA-4 gene expression, and then gene expressions before and after PBMCs activation were compared. P values of < 0.05 were considered statistically significant. All analyses were performed using the SPSS version 20 software.
4. Results
4.1. Patient Characteristics
In this study 19 healthy controls and 29 patients with newly diagnosed pulmonary TB were enrolled. Overall, 18 males and 11 females were in the patient group. The control group consisted of 14 males and five females. There was no statistically significant gender difference between the two groups (P = 0.9). The mean age of each group was 52 ± 4 years for patients with TB (range 16 - 85 years) and 43 ± 2 years (range 30 - 68 years) for healthy controls. No significant difference existed in mean age between the two groups (P > 0.05). Frequency of Treg cells were measured and compared between control and patient groups. In addition, expression of FoxP3 and CTLA-4 were evaluated before and after activation with PPD and compared for each group.
4.2. The Association of CD4+ CD25+ FoxP3+ T Cells Frequency With Newly Diagnosed Tuberculosis
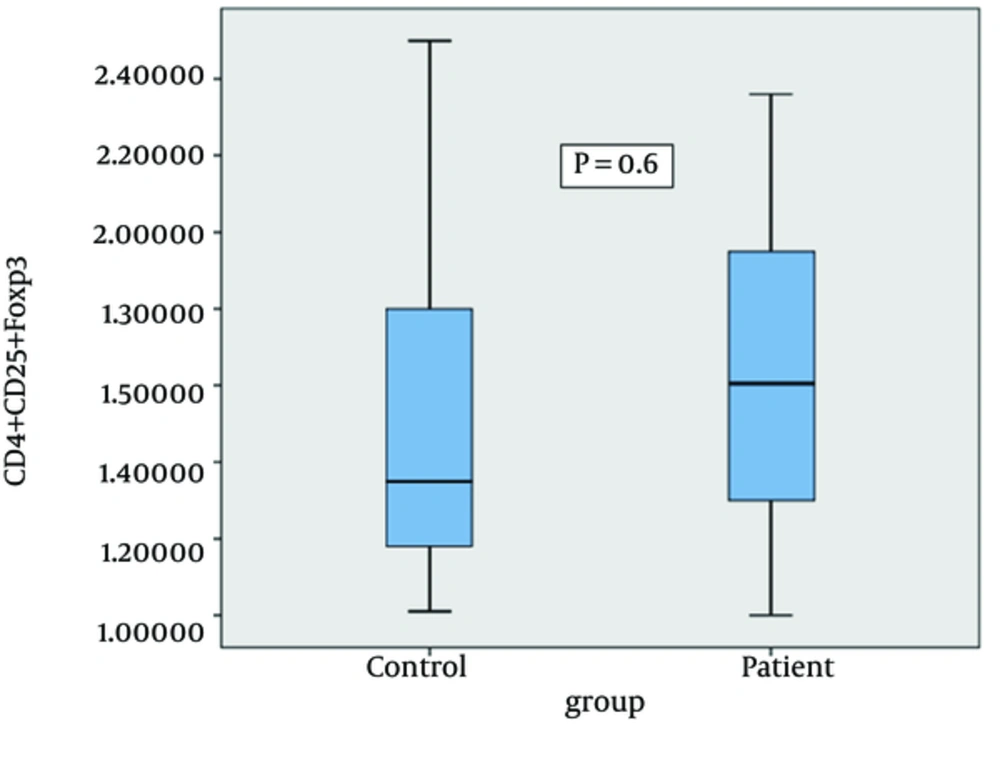
The frequency of CD4+ CD25+ FoxP3+ regulatory T cells in control and patient groups was evaluated to investigate whether M. tuberculosis infection is associated with CD4+ CD25+ FoxP3+ Treg expansion. The mean number of Treg cells in PBMCs of the control group was 1.57 ± 0.1% and in the patient group was 1.5 ± 0.1%. As shown in Figure 1 no significant differences in the frequency of CD4+ CD25+ FoxP3 regulatory T cells between the control group and patients with tuberculosis was observed (P > 0.05).
4.3. FoxP3 mRNA Expression
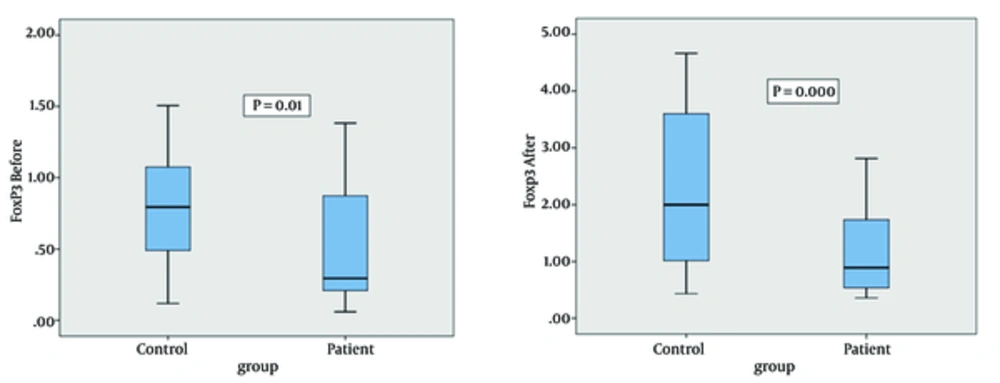
We evaluated FoxP3 gene expression in PBMCs isolated from blood samples of the control and patient groups before and after PBMCs activation with PPD. The mean FoxP3 gene expression in controls and patients before PBMCs activation was 1.4 ± 0.2 and 0.5 ± 0.1, respectively. FoxP3 mRNA expression was significantly higher in the control group compared to the patients with tuberculosis before PBMCs activation with PPD (P = 0.01) (Figure 2). The mean FoxP3 gene expression in the control and patients groups after PBMCs activation was 3.8 ± 0.7 and 1.1 ± 0.2, respectively. FoxP3 mRNA expression was significantly increased in the control group compared to patients with tuberculosis after PBMCs activation with PPD (P = 0.000) (Figure 2)
4.4. CTLA-4 mRNA Expression
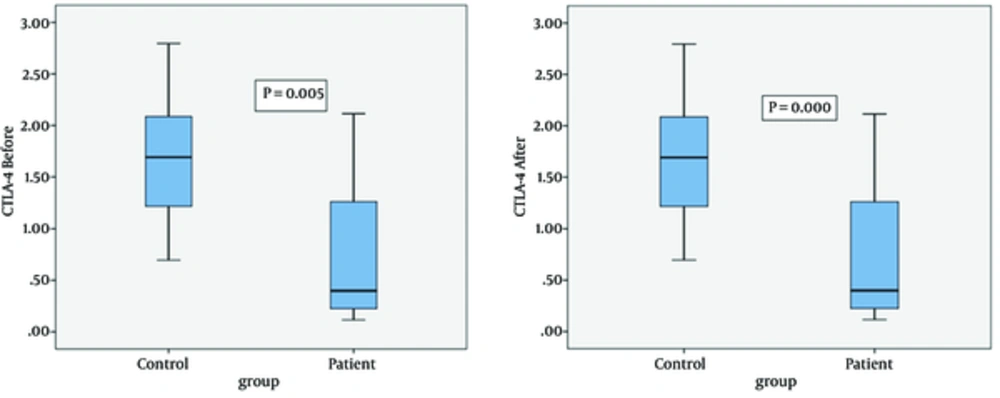
CTLA-4 gene expression was examined in PBMCs isolated from blood samples of the control group and patients with TB before PBMCs activation with PPD. The mean CTLA-4 gene expression was 1.66 ± 0.18 and 0.8 ± 0.2 for the control and patient groups, respectively. The data revealed that CTLA-4 mRNA expression in the control group was significantly higher compared to the patient group (P = 0.005). The mean CTLA-4 gene expression in controls and patients after PBMCs activation with PPD was 3.4 ± 0.4 and 1.1 ± 0.2, respectively. CTLA-4 mRNA expression was significantly higher in the control group compared to patients (P = 0.000) (Figure 3)
4.5. Comparison of FoxP3 and CTLA-4 Gene Expression Before and After PBMCs Activation with PPD
FoxP3 gene expression increased after PBMCs activation with PPD compared to before PBMCs activation in both groups (P = 0.001). CTLA-4 gene expression increased after PBMCs activation with PPD compared to before PBMCs activation in the control group (P = 0.006). CTLA-4 expression in the patient group was not significantly different before and after PBMCs activation with PPD (P = 0.2).
5. Discussion
Adaptive immune response provides long-term highly-effective protection against pathogens. CD25+ CD4+ regulatory T cells play an important role in preventing immune responses to auto-antigens and are also involved in immune response to infections agents (26, 27). In the present study, the frequency of CD4+ CD25+ FoxP3+ Treg cells and expression of FoxP3 and CTLA-4 in peripheral blood of patients with newly diagnosed TB and the control group including patients with positive tuberculin skin test were evaluated. In contrast to some previous studies, the results of this study showed that the frequency of CD4+ CD25+ FoxP3+ Treg cells in the early stages of the disease, before treatment, is not significantly different between the two groups (28-30).
The Foxp3 transcription factor is a reliable marker of Treg cells and unlike CD25, CTLA-4, and glucocorticoid-induced tumor-necrosis-factor-receptor-related protein (GITR), FoxP3 is not upregulated in activated CD4+ CD25-T cells (26, 31). In TB, Th1 response is extremely down-regulated and may lead to disease progression. Furthermore, in early subclinical TB, the expression of FoxP3 in peripheral blood of patients has been shown to decrease; however, when TB becomes progressive, the expression of FoxP3 is upregulated (25). Several previous studies have compared the frequency of CD4+ CD25+ FoxP3+ Treg cells in patients with active and latent TB, and demonstrated that the percentage of Treg cells in patients with active TB increases and leads to the suppression of immune response and progression of chronic disease (9, 23, 28). Moreover, increased number of inflammatory cells, especially T-cell populations (Th1/Th2/Th17/Treg cells) at the site of infection, in newly diagnosed TB patients has also been reported previously (29, 32).
Our results are consisted with the mentioned studies, and we could not find any differences in the frequency of CD4+ CD25+ FoxP3+ Treg cells between cases and controls, which might be because our TB patients were studied during the early stages of infection in which some of Treg cells migrate to the site of infection and therefore, result transiently reduced numbers of Treg cells in peripheral blood (25). Studies have shown that BCG induces FoxP3 mRNA expression in some mycobacteria-stimulated whole blood samples, which might suggest the presence of BCG induced regulatory CD4 T cells (33). Additionally, in this study we demonstrated statistically significant increases in expression of FoxP3 and CTLA-4 in the control group compared to patients with newly diagnosed TB before and after activation with PPD. Furthermore, previous studies have shown that the expression of Foxp3 in humans is inadequate to induce T cell activity (34) and Foxp3 expression in humans correlates with suppressive activity, which is a transient property of all activated CD4+ T-cell subsets (35).
Adaptive immune response to TB is significantly delayed compared to other pathogens, suggesting that individuals, who are exposed to M. tuberculosis, show a positive tuberculin test for six weeks after exposure to M. tuberculosis (36, 37). Therefore, there were no changes in the frequency of CD4+ CD25+ FoxP3+ Treg cells in the peripheral blood of our patients, and low Foxp3 and CTLA-4 expression might be due to accumulation of T cells in the patients’ lungs (38). The Treg cells which display an activated phenotype such as cell surface molecules and chemokine receptors tend to accumulate in the lung (39), and this could be considered as one of the explanations for the low expression of Foxp3 and CTLA-4 in PBMCs of patients with M. tuberculosis.
It should be taken into account that during chronic infection, pathogen-specific T reg cells might arise through clonal expansion of antigen-specific cells from within the natural T reg cell population, thus it is not clear whether PPD expands M. tuberculosis-specific or non-specific Treg cells in PBMCs. Based on our results it is more likely that PPD induces non-specific T reg cells rather than M. tuberculosis-specific T reg cells, thus the expression of Foxp3 and CTLA-4 is higher in the control group compared to patients with TB; further studies are needed to clarify this issue (40). Taken together, it seems that Treg cells in the first phase of active TB, accumulate in the primary site of infection such as lymph nodes and lungs, thus the expression of Treg markers are decreased in newly diagnosed cases. Further studies are needed to clarify the controversial data regarding Treg cells in TB.


