


1. Background
Infection caused by hepatitis C virus (HCV) is one of the main public health concerns across the globe. Hepatitis C virus is associated with consistently higher morbidity and mortality in various developing countries including Pakistan (1). Despite a wide variation across different geographical regions, the overall prevalence of HCV in Asia is > 2% (2). According to the estimates, approximately 77% of the individuals infected with HCV are unable to clear the virus spontaneously during the initial six months of infection (so-called acute phase). Eventually, these patients develop a chronic infection that may lead to other complications such as fibrosis, cirrhosis, hepatocellular carcinoma, and liver failure (2, 3). The exact mechanism by which the spontaneous clearance of HCV occurs remains obscure. However, predisposition to the viral infection is dependent on both environmental and genetic factors (4). Single nucleotide polymorphisms (SNPs) at various loci, particularly the immune system genes, have been implicated in the host immune response, as well as treatment outcomes. For instance, studies have shown that variant rs4273729 at HLA-DQB1 was associated with the clearance of HCV in European and African cohorts (5). On the other hand, SNPs in the intronic region of HLA-DQB1 were found to be associated with chronic HCV infection (6).
Currently, HCV treatment comprises combination therapy with pegylated interferon (peg-IFN) for up to 48 weeks and ribavirin (RBV) for up to 24 weeks (7). After 24 weeks of the completion of therapy, the absence of the HCV RNA and evidence of a sustained virological response (SVR) indicates treatment success (8). The presence of HCV RNA is indicative of non-clearance, which could be due to ineffective recognition of viral antigen by T cells or failure in the treatment (4, 8). Moreover, human leukocyte antigen (HLA) molecules such as HLA-DQ, -DR, and -DP trigger the immune response via CD4 T cells (9, 10). Similarly, IFN-L4 genotypes (rs12979860 C/C and ss469415590 TT/TT) were described as the predictors of response to IFN and RBV therapy (11, 12). Allelic polymorphisms HLA-DRB1*0301, DRB1*0701, and DRB1*11 showed to have significant roles in therapeutic response to HCV infection in Romanian patients (10). Likewise, HLA-A01 and HLA-B38 were associated with response to IFN-RBV therapy in HCV-infected Egyptian patients (13).
The roles of HLA-DRB1 and DQB1 allelic variations were investigated in Brazilian patients and DRB1*11 along with DQB1*03 was witnessed to have frequent occurrence among the responsive group of patients under IFN-RBV therapy (6, 14). The association of SNPs in TNF-α, HLA-DRB1, and HLA-DQB1 with differential response to HCV infection and anti-HCV therapy has been established in many populations (10).
2. Objectives
In this study, we first established the distribution of SNPs in three key immunological factors, i.e., TNF-α, HLA-DRB1, HLA-DQB1, in a cohort of HCV-infected patients of Pakistani origin. Second, through regression modeling, we investigated the role of 20 different SNPs in spontaneous clearance and response to anti-HCV therapy among chronically infected patients. We reported five novel SNPs in the promoter region of HLA-DQB1 and haplotypes of SNPs in association with patients’ disease status. To the best of our knowledge, no previous study focused the Pakistani population for comprehensive characterization and analysis of polymorphisms in TNF-α, HLA-DRB1, and HLA-DQB1 loci among HCV-infected patients.
3. Methods
3.1. Study Participants and Sampling
The blood samples were collected in the period of July 2015 to September 2015. Data on clinical presentation, risk factors, and anti-HCV treatment were collected. The infection status of the participants was confirmed by the immune chromatographic technique (ICT). Children, immunocompromised patients, pregnant women, and patients having HBV/HIV co-infection were excluded. HIV was detected using anti-HIV antibody by the third-generation ELISA kit (Saceae, Italy) whereas HBsAg was detected using the ICT-based method.
3.2. Quantitative PCR and HCV Genotyping
Hepatitis C virus quantification and genotypic analysis were carried out according to the methods described elsewhere (15, 16).
3.3. Patient Categories
In total, 245 patients (121 men, 124 women) were included in this study (Table 1). The mean age of the patients was 41.1 ± 11.8 years (P = 0.964), with the highest percentage of subjects in the age group of 31% - 40.9% (31%; data not shown). The study patients were divided into two groups, i.e., patients receiving anti-HCV therapy (therapy group) and patients not receiving anti-HCV therapy (non-therapy group). The therapy group was further divided into responsive and non-responsive categories. The non-therapy group was divided into two different sub-categories: chronically infected and spontaneously recovered. Hence, the patients in the therapy group were not treatment naïve since they had already received combination therapy (peg-IFN/RBV) for HCV infection. Patients under treatment were receiving antiviral combination therapy with peg-IFN (180 mcg) once a week and RBV (800 - 1200 mg) prescribed according to their body mass index.
| Characteristics | Therapy Group (N = 110) | Non-Therapy Group (N = 135) | Total (N = 245) | ||
|---|---|---|---|---|---|
| Responsive (N = 68) | Non-Responsive (N = 42) | Spontaneously Recovered (N = 36) | Chronically Infected (N = 99) | ||
| Gendera | |||||
| Male | 33 (49) | 23 (55) | 22 (61) | 43 (43) | 121 (49) |
| Female | 35 (51) | 19 (45) | 14 (39) | 56 (57) | 124 (51) |
| Age category, yeara | |||||
| Up to 39 | 31 (46) | 17 (40) | 21 (58) | 52 (53) | 121 (49) |
| Above 39 | 37 (54) | 25 (60) | 15 (42) | 47 (47) | 124 (51) |
| Viral genotypea | |||||
| 1a | 1 (5) | 1 (4) | 0 | 0 | 2 (2) |
| 1b | 1 (5) | 1 (4) | 0 | 0 | 2 (2) |
| 3a | 20 (90) | 21 (84) | 6 (100) | 40 (100) | 87 (94) |
| Untypable | 0 | 2 (8) | 0 | 0 | 2 (2) |
| ALT, IU/La | 53 ± 53 | 79 ± 71 | 39 ± 21 | 58 ± 17 | 59 ± 54 |
| Viral load, ×105 IU/L | 38.3 ± 89.9 | 42.6 ± 74.6 | |||
| < 8 ×10⁵ IU/L | 17 | 33 | 50 | ||
| > 8 ×10⁵ IU/L | 19 | 56 | 75 | ||
Features of Therapy Group and Non-Therapy Group
3.4. Candidate Gene Selection
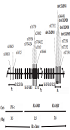
The candidate genes selected for the polymorphism study included tumor necrosis factor (TNF-α; NM-000594), human leukocyte antigen-DRB1 (HLA-DRB1; NM-002124), and human leukocyte antigen-DQB1 (HLA-DQB1; NM-002123). In total, 20 different SNPs were studied, including 3 in the upstream region of TNF-α, 7 in exon 2 of HLA-DRB1, and other 10 in the upstream region of HLA-DQB1 (Figure 1). This combination of genes and SNPs had not been previously studied in Pakistani HCV cohorts.

Genomic interval at chromosome 6 illustrating the map of SNPs in three genes investigated in this study. Arrows indicate the direction of the reading frame of the gene. SNPs are shown with rs number. Novel SNPs detected in DQB1 are shown in boldface. E = exon; Pr. = promoter.
3.5. DNA Extraction and Genotyping
By using the standard phenol-chloroform method, genomic DNA was extracted from the whole blood. For PCR analysis, 50 µL of the reaction mixture was prepared, consisting of 4 µL of ExTaq polymerase, 5 µL of both forward and reverse primers, 6 µL of template DNA (40 ng/ µL), and 35 V of PCR water. The cycling conditions were as follows: initial denaturation at 95°C for 5 minutes, followed by denaturation at 95°C for 2 minutes, annealing at 58°C for 30 seconds, extension at 72°C for 2 minutes (the cycle repeated from step 2 for 35 times), and a final extension at 72°C for 10 minutes. Amplified products were purified (Qiagen Purification kit). The DNA sequencing was performed on both strands by the Sanger method using both forward and reverse primers (sequences available on request).
3.6. SNP Typing and Mapping, Detection of Novel SNPs and Haplotype Generation
DNA sequence reads were analyzed for the typing of SNPs. Sequence electropherograms were inspected using BioEdit Sequence Editor (TomHall) and CodonCode Aligner (version 7.0.1). Minor allele frequencies (MAF) were observed in online databases such as ExAC, 1000 Genome, and SNPedia. Positions and maps of the SNPs were determined using the UCSC genome browser (GRCh37/hg19). Haplotypes were generated by online tool SNPstat (https://www.snpstats.net/start.htm) and linkage disequilibrium estimates were obtained.
3.7. Statistical Analysis
Allele and genotype frequencies of all the SNPs were compared between the responsive and non-responsive (R vs. NR) groups and between chronically infected and spontaneously recovered (CI vs. SR) groups. An exact test for Hardy-Weinberg equilibrium (HWE) was implemented for genotype frequencies observed in SR and CI patients, as well as in the R and NR groups. Statistical analyses were carried out using GraphPad Prism and STATA (11.0) software. The significance of the differences from random distribution was estimated by the chi-square and t tests. Yates’ corrected chi-square and Fisher’s exact tests were also employed. The level of significance was set at a P value of < 0.05. The magnitude of the effect was analyzed by calculating odds ratios (OR) and 95% confidence intervals (95% CI). For multivariate analyses, logistic regression was performed for both R/NR and CI/SR groups separately. Groups were coded as dichotomous variables and SNPs and demographic factors as independent variables. A stepwise regression model was applied by including all variables and eliminating the non-significant ones.
4. Results
4.1. Sample Characteristics and HCV Prevalence
The distribution of subjects in the R/NR and CI/SR groups is presented in Table 1. The tertiary care hospital, which was the sampling setting for the current study, is located in Federal Capital Islamabad and has a high influx of patients from the adjoining areas. Hence, the majority of the patients originated from Islamabad (33%) and Rawalpindi (27%) districts (P = 0.386). The most prevalent viral genotype detected in this cohort was 3a (94%). The alanine aminotransferase (ALT) ranges were higher in the NR group than in the R group and in the CI group than in the SR group, but the differences were statistically non-significant.
The total number of patients receiving anti-HCV therapy was 110 (Table 1). In this group, 62% (n = 68) of the patients were responsive (R) while 38% (n = 42) were non-responsive (NR). Moreover, 135 patients did not receive any anti-HCV therapy among whom, 73% (n = 99) were chronically infected (CI) and 27% (n = 36) recovered spontaneously (SR). Overall, 51% (n = 125) were positive for viral RNA. The average viral load was 41 × 105 IU/mL. The most prevalent viral genotype was 3a (95%), followed by 1b (2%) and 1a (1%), while 2% (n = 2) of the isolates were untypable (Table 1).
4.2. Clinical Presentation and Risk Factors
A range of clinical symptoms was observed among the patients. The most common symptoms were fatigue (56%), jaundice (47%), fever (40%), abdominal discomfort (38%), and anorexia (36%) (P = 0.162) (Supplementary File Appendix 1). The most common risk factors associated with HCV infection were the use of injection (100%), followed by intravenous infusions (59%), skin piercing (51%), barber visits (47%), dentist visits (45%), surgery (33%), blood transfusion (24%), and having a family member with HCV infection (24%) (P < 0.0001).
4.3. Distribution of SNPs in Responsive (R) and Non-Responsive (NR) Groups
The allele frequencies at three of the 20 studied SNPs varied significantly among the R and NR patients (Table 2). At HLA-DRB1 locus, the allele frequency of rs2308802 showed a significant variation among the patient groups (P = 0.010). At this locus, the C allele was more prevalent in the R group than in the NR group (63% vs. 43%) whereas the T allele was more frequently presented among the NR group than among the R group (56.9% vs. 37.2%; P = 0.01; OR = 2.23; 95% CI = 1.20 - 4.12). Likewise, the allele distribution of HLA-DQB1 -8447 significantly varied among the patient groups (P = 0.028). At this locus, the T allele was nearly two times higher in the R group than in the NR group (38% vs. 22%; P = 0.028; OR = 0.44; 95% CI = 0.21 - 0.93). At HLA-DQB1 -8471, the difference was statistically significant in the distribution of alleles between the R and NR groups (P = 0.036). Here, the G allele was more found in the NR group than in the R group (51% vs. 36%) while the A allele was more prevalent in the R group than in the NR group (64% vs. 47%; OR = 1.94; 95% CI = 1.04 - 3.63).
| Locus/SNP | Allele | Responsive | Non-Responsive | P Value | Odd Ratio | 95% CI |
|---|---|---|---|---|---|---|
| TNF-α | ||||||
| -238 G/A (rs361525) | G | 91 (91) | 67 (93) | Reference | ||
| A | 9 (9) | 5 (7) | 0.626 | 0.75 | 0.242 to 2.355 | |
| -308 G/A (rs1800629) | G | 94 (92) | 62 (91) | Reference | ||
| A | 8 (8) | 6 (9) | 0.819 | 1.14 | 0.376 to 3.438 | |
| -863 C/A (rs1800630) | C | 78 (72) | 44 (65) | Reference | ||
| A | 30 (28) | 24 (35) | 0.292 | 1.42 | 0.739 to 2.722 | |
| HLA-DRB1 | ||||||
| 6151 (T/C) (rs1064664) | T | 53 (50) | 28 (41) | Reference | ||
| C | 53 (50) | 40 (59) | 0.254 | 1.43 | 0.772 to 2.643 | |
| 6167 (A/C/T) (rs707957) | A | 72 (72) | 52 (76) | Reference | ||
| C | 9 (9) | 4 (6) | 0.435 | 0.62 | 0.179 to 2.107 | |
| T | 19 (19) | 12 (18) | 0.744 | 0.87 | 0.390 to 1.958 | |
| 6192 (C/T)c (rs776046212) | C | 102 (94) | 70 (97) | Reference | ||
| T | 6 (6) | 2 (3) | 0.375 | 0.49 | 0.095 to 2.477 | |
| 6228 (C/T) (rs2308802) | C | 64 (63) | 31 (43) | Reference | ||
| T | 38 (37) | 41 (57) | 0.010b | 2.23 | 1.204 to 4.122 | |
| 6231 (T/C/G) (rs3167799) | C | 40 (39) | 24 (34) | Reference | ||
| G | 27 (26) | 17 (24) | 0.904 | 1.05 | 0.476 to 2.313 | |
| T | 34 (33) | 29 (42) | 0.329 | 1.42 | 0.700 to 2.887 | |
| A | 1 (1) | 0 (0) | - | |||
| 6236 (A/C) (rs1059586) | A | 89 (84) | 60 (88) | Reference | ||
| C | 17 (16) | 8 (12) | 0.433 | 0.69 | 0.283 to 1.720 | |
| 6251 (A/T)c (rs397844204) | A | 97 (92) | 62 (91) | Reference | ||
| T | 9 (8) | 6 (9) | 0.939 | 1.04 | 0.353 to 3.075 | |
| HLA-DQB1 | ||||||
| -8471 (A/G/C) (chr6:32628910) | A | 69 (64) | 31 (47) | Reference | ||
| G | 39 (36) | 34 (51) | 0.036b | 1.94 | 1.038 to 3.627 | |
| C | 0 (0) | 1 (2) | - | |||
| -8465 (G/A/C) (rs9273552) | G | 93 (86) | 52 (79) | Reference | ||
| A | 14 (13) | 14 (21) | 0.158 | 1.78 | 0.791 to 4.041 | |
| C | 1 (1) | 0 (0) | - | |||
| -8447 (C/A/G/T) (chr:32628934) | C | 49 (50) | 42 (66) | Reference | ||
| A | 8 (9) | 4 (6) | 0.401 | 0.58 | 0.163 to 2.076 | |
| G | 3 (3) | 4 (6) | 0.574 | 1.55 | 0.329 to 7.351 | |
| T | 37 (38) | 14 (22) | 0.028b | 0.44 | 0.210 to 0.925 | |
| -8442 (G/C)c (rs34644981) | G | 81 (74) | 49 (74) | Reference | ||
| C | 29 (26) | 17 (26) | 0.929 | 0.96 | 0.483 to 1.944 | |
| -8362 (A/C/G)c (chr6:32629020) | A | 57 (53) | 34 (53) | Reference | ||
| C | 36 (34) | 19 (30) | 0.731 | 0.88 | 0.439 to 1.781 | |
| G | 13 (13) | 11 (17) | 0.449 | 1.41 | 0.571 to 3.519 | |
| -8344 (T/C) (chr6:32629038) | T | 84 (78) | 50 (76) | Reference | ||
| C | 24 (22) | 16 (24) | 0.758 | 1.12 | 0.543 to 2.308 | |
| -8331 (T/G) (chr6:32629051) | T | 66 (62) | 49 (74) | Reference | ||
| G | 40 (38) | 17 (26) | 0.104 | 0.57 | 0.290 to 1.127 | |
| -8307 (A/C/G) (rs9273588) | A | 48 (44) | 30 (45) | Reference | ||
| C | 16 (14) | 11 (17) | 0.834 | 1.1 | 0.450 to 2.687 | |
| G | 46 (42) | 25 (38) | 0.681 | 0.86 | 0.446 to 1.695 | |
| -8298 (C/G) (rs9273592) | C | 81 (76) | 45 (68) | Reference | ||
| G | 27 (24) | 21 (32) | 0.328 | 1.4 | 0.711 to 2.755 | |
| -8288 (C/G) (rs9273598) | C | 91 (83) | 53 (80) | Reference | ||
| G | 19 (17) | 13 (20) | 0.686 | 1.17 | 0.537 to 2.570 |
Allele Distribution of SNPs in the Studied Loci Among Responsive (R) and Non-Responsive (NR) Patientsa
Further analyses showed that the genotype frequencies of these 20 SNPs did not vary significantly between the R and NR groups of patients. The genotype frequencies of 4 out of 20 SNPs were concordant with the assumptions of HWE (Table 2). For multivariate analyses, genotypes were coded and the most common genotype was used as the reference genotype. Interestingly, HLA-DQB1 -8471 was detected to be a significant predictor of response to treatment though in the presence of HLA-DQB1 rs230880 while the overall model was highly significant (Table 3).
| Locus | Genotype | Responsive | Non-Responsive | P Value | Odd Ratio | 95% CI |
|---|---|---|---|---|---|---|
| HLA-DRB1 | ||||||
| 6228 (rs2308802) | C/C | 30 (33) | 14 (53) | - | Reference | |
| C/T | 4 (8) | 3 (8) | 0.565 | 1.67 | 0.3161 to 8.172 | |
| T/T | 17 (59) | 19 (39) | 0.058 | 2.40 | 0.9625 to 5.959 | |
| HLA-DQB1 (-8471) | A/A | 31 (57) | 13 (39) | - | Reference | |
| A/G | 7 (13) | 5 (15) | 0.426 | 1.70 | 0.456 to 6.364 | |
| G/C | 0 (0) | 1 (3) | 0.132 | 7.00 | 0.268 to 183.1 | |
| G/G | 16 (30) | 14 (42) | 0.133 | 2.09 | 0.794 to 5.486 | |
| Multivariate | ||||||
| HLA-DRB1 (rs2308802)b | 0.088 | 0.66 | 0.405 to 1.065 | |||
| HLA-DQB1 (-8471)b | 0.030c | 0.58 | 0.350 to 0.949 | |||
| _cons | 0.004c | 9.56 | 2.100 to 43.50 |
Genotype Frequencies of HLA-DRB1 rs2308802 and HLA-DQB1 -8471 in Responsive (R) and Non-Responsive (NR) Patients and the Result of Multivariate Logistic Regression for Treatment Responsea
4.4. Distribution of SNPs in Spontaneously Recovered (SR) and Chronically Infected (CI) Patients
The overall distribution of allelic polymorphisms at the 20 SNPs did not differ significantly between the SR and CI groups of patients (Supplementary File Appendix 2). However, at HLA-DQB1 -8471, the distribution of the A allele was relatively higher among SR patients than among CI patients (59% vs. 42%; P = 0.061) while the G allele frequency was found to be 57% in CI patients compared to 41% in SR patients (OR = 1.96; 95% CI = 0.96 - 3.97). Notably, at this locus, the genotype frequencies varied significantly between the SR and CI groups (Table 4). The genotype frequencies at 7 out of 20 SNPs were concordant with the assumptions of HWE (Supplementary File Appendix 2). Overall, multivariate analyses did not show a significant association between different genotypes and disease status of the patients.
| Locus | Genotype | Spontaneously Recovered | Chronically Infected | P Value | Odd Ratio | 95% CI |
|---|---|---|---|---|---|---|
| HLA-DQB1 (-8471) | A/A | 13 (59) | 16 (28) | - | Reference | |
| A/G | 0 (0) | 16 (28) | 0.002b | 27.0 | 1.479 to 493.0 | |
| G/G | 9 (41) | 25 (44) | 0.128 | 2.26 | 0.7845 to 6.493 | |
| Total | 22 | 57 |
Genotype Frequencies of HLA-DQB1 -8471 in Spontaneously Recovered (SR) and Chronically Infected (CI) Patientsa
4.5. Distribution of SNPs in Male and Female Patients
Significant differences in the allele frequencies of three SNPs were witnessed among male and female patients. For instance, at HLA-DRB1 (rs1064664), the T allele was more prevalent in female patients than in male patients (58% vs. 43%) while the C allele showed more frequencies among male patients than among female patients (52% vs. 42%) (P = 0.0135; OR = 0.59; 95% CI = 0.39 - 0.90). Similarly, at HLA-DRB1 (rs2308802), the C allele was more prevalent among male patients than among female patients (61% vs. 48%) while the T allele was more prevalent in women than in men (52% vs. 39%) (P = 0.014; OR = 1.70; 95% CI = 1.11 - 2.61). At HLA-DRBI (rs3167799), the C allele was observed to be more frequent among female patients than among male patients (75% vs. 51%) while the G allele was more common among male patients (55% vs. 49%). The T allele was found to be more prevalent in males than in females (65% vs. 48%) (P = 0.009; OR = 0.50; 95% CI = 0.30 - 0.84) (Supplementary File Appendix 3).
4.6. Identification of Novel SNPs and Haplotype Construction
Five novel SNPs were detected at HLA-DQB1, including -8331(T/G), -8344(T/C), -8447(C/A/G/T), -8471(A/G/C), and -8362(A/C/G) (Figure 1). The differences in the distribution of haplotypes generated for the three sets of SNPs in three loci were not statistically significant between different groups of patients including the R and NR groups and the CI and SR groups (Supplementary File Appendix 4). In addition, there were no gender-specific differences in the distribution of haplotypes. The estimates of linkage disequilibrium between the SNPs of the three genes showed a rather mosaic pattern (Supplementary File Appendix 5 - 7). The MAF and allele frequency estimates in the South Asian population are presented in Supplementary File Appendix 8.
5. Discussion
This study investigated the distribution of 20 SNPs in TNF-α, HLA-DRB1, and HLA-DQB1 among HCV infected patients. These immunological factors have critical roles in guiding immune responses by controlling the presentation of antigen to CD4 T-cells. The identification of polymorphisms associated with therapy responses could greatly help optimize virologic outcome and economic resources (6, 17). Gender plays an important role in the context of HCV infection and anti-HCV therapy outcomes. A number of studies have reported that men are much more prone to developing chronic liver diseases than women are (18). It has been established that women tend to have better responses against HCV infection than men do. Studies have also reported that spontaneous clearance and response to anti-HCV therapy are more common in women than in men (19).
Conflicting observations have also been reported. For instance, Samimi-Rad et al. witnessed no difference in the spontaneous clearance between male and female patients recruited from the Iranian population (20). The present study, likewise, showed that the clinical presentation of male and female patients was rather similar and the signs and symptoms of HCV infection were not significantly different between them (P = 0.162) (Supplementary File Appendix 1). Furthermore, the differences in the average viral load, viral genotypes, and ALT levels were not statistically significant between male and female patients. There were also no statistically significant differences between male and female patients respecting SR/CI and R/NR (P = 0.0691 and P = 0.525, respectively).
It is, nonetheless, pertinent to mention that in the current study, gender-based differences were evident in the allele distribution at three SNPs in HLA-DRBI. In SNP rs1064664, allele T was more prevalent in female patients than in male patients (58.1% vs. 42.6%) while allele C was more prevalent in males than in females (52.1% vs. 41.9%) (OR = 0.587). In SNP rs2308802, allele C was more prevalent among males than among females (60.8% vs. 47.7%) while allele T was more prevalent in females (52.3% vs. 39.2%; P = 0.014) (OR = 1.702). At SNP rs3167799, allele C was more prevalent in females while allele T was more prevalent in males (P = 0.008). Even though the clinical presentation, spontaneous clearance, and treatment response were not significantly different between male and female patients, it is quite likely that these SNPs had associations with other certain traits/infections or susceptibilities. This research area warrants further investigations.
In the current study, the allele frequencies at 3 out of 20 different SNPs varied significantly between the R and NR patients, including HLA-DRB1 rs2308802 (C/T), HLA-DQB1 -8447 (C/A/G/T), and HLA-DQB1 -8471. However, in the presence of HLA-DRB1 rs2308802, SNP HLA-DQB1 -8471 was witnessed as a significant predictor of response to treatment. Furthermore, analyses of locus HLA-DQB1 -8471 showed that allele G was more prevalent in the NR group than in the R group (51% vs. 36%) while allele A was more pronounced in the R group than in the NR group (64% vs. 47%; OR: 1.94; 95% CI: 1.04 - 3.63). It was further observed that the differences in the distribution of alleles at 20 different SNPs were not statistically significant between SR and CI patients. However, at locus HLA-DQB1 (-8471), genotypic frequencies varied significantly between the SR and CI groups of patients. A review of the published studies disclosed that different combinations of SNPs in the HLA cluster appear to be associated with HCV clearance or treatment response.
A certain SNP significantly associated with a patient group in a specific population may be non-significant in a patient group from another population. For instance, Ksiaa et al. (21) showed that in patients of Tunisian origin, DRB1*08 was associated with HCV clearance and DRB1*15 appeared to be a risk marker for viral persistence. Similarly, in a study carried out in Spain, de Rueda et al. (22) observed favorable treatment responses among the HCV-infected patients harboring the 𝐷𝑄𝐵∗0301 allele. Other studies, however, showed no significant differences in the allelic polymorphisms at DQBI between spontaneously recovered and chronically infected patients. Romero et al. (23) reported no association of HLA polymorphism DQB1*0301 with SR and CI groups. In a Romanian cohort of chronic HCV patients, Gheorghe et al. observed that HLA-DRB1*0301 had a high frequency (14.8%) in NR patients while alleles DRB1*0701 (11.1%), DRB1*11 (22.2%), and DRB1*0101 (16.7%) were prevalent in sustained virologic responders (SVR) (10). On the other hand, it was interesting that the SNPs in TNF-α were not associated with any patient category. Hence, the research findings in one population cannot be generalized to other population.
Single nucleotide polymorphisms in the promoter region are responsible for the differential expression of HLA genes, immunological outcome, and response to therapy. Here, for the first time, SNPs in HLA-DQB1 are reported to be associated with response to IFN/RBV therapy in a Pakistani population. Various other studies have investigated the association of SNPs in the promoter region of HLA-DQB1 with differential disease outcomes, such as systemic lupus erythematosus and autoimmune hepatitis (24). In the current study, the most common risk factors associated with HCV infection was injection use, intravenous infusion, and skin piercing. These findings are in concordance with other studies reported from Pakistan and demonstrate the importance of proper public awareness programs to reduce the prevalence of HCV infection in Pakistan (25-27). In a recent study carried out in Faisalabad, Pakistan, the most prominent risk factor was injecting drug use observed in 51% of HCV patients (27). Reker and Islam showed that surgery, transfusion, and age were the most important risk factors of HCV in an Egyptian population (28). In another study carried out in Italy, intravenous drug abuse and age of ≤ 60 years were associated with HCV (29).
In our study, multivariate analyses did not show any significant association between genotypes and infection status. This discrepancy between the univariate and multivariate results could be attributed to the small sample size and ethnic heterogeneity among patients. Further, one of the limitations of the study is that information was missing regarding lifestyle, smoking, dietary habits, and other physiological variables that could be confounding factors of morbidity. Additionally, haplotype analyses showed that the differences in the distribution of haplotypes were not significant between R/NR and CI/SR groups.
5.1. Conclusions
This study reported the allelic variations at 20 different SNPs in TNF-α, HLA-DRB1, and HLA-DQB1 in a cohort of HCV-infected patients of Pakistani origin. This cohort study also reported the distribution of five novel SNPs in the promoter region of HLA-DQB1. Further, a novel SNP HLA-DQB1(-8471) emerged as a predictor of positive response to anti-HCV therapy in HCV-infected Pakistani patients. Prescreening of this variant before therapy would benefit HCV patients.
