1. Background
Salmonella enterica serovar typhi infection is a worldwide bacterial disease and still remains a public health problem, and the host immune responses vary between individuals against the infection. Geographical, environmental, and racial factors may play an important role in the immunity with the addition of cell-mediated immune responses in bacterial clearance and disease prognosis. Sudanese and Chinese have more variation in culture, race, lifestyle, and geographical and environmental factors. The resistance to and defense against S. typhi infection and clearance of the bacteria may differ between Sudanese and Chinese populations, and the measurement and detection of the detailed antibody features to S. typhi and human leukocyte antigen (HLA) molecules only may be not sufficient to explain the variation in immunity between the two ethnic groups. For this purpose, we explore and distinguish the variation in immunity to S. typhi infection in Sudanese and Chinese populations using an artificial neural network. Salmonella typhi is the etiologic agent of typhoid fever, which is exclusively a human systemic disease and still endemic in many parts of the world, where it is a causative agent of febrile illness in crowded and low-income settings (1-3).
Cases of the disease among African children decrease, and increase in the acquisition of the antibody to start all complement-dependent killing of Salmonella, and subsequently, more effective blood phagocytes and opsonization (4-6). Measuring and detecting serum antibody markers in the clinical laboratory to evaluate a patient’s health status is an important and valuable issue (6-11). The affinity of an antibody to its antigen describes and characterizes the strength of the interaction between the antibody and the antigen and plays a critical role in the recovery of infection. In antibody affinity maturation, the production of antibodies with a higher affinity by B cells against the pathogen and a long period exposure to it leads to increase the efficiency of the host immune system (12-17). The cellular immune responses play an essential role against S. typhi infection, which are regulated by the major histocompatibility complex (MHC) molecules (18-20). A highly polymorphic property of HLA alleles explains the variation in the immune response among different populations (21-23).
Artificial neural network (ANN) as an artificial intelligence new method has been increasingly performed in biomedical research in diagnosis and clinical response predictions (24-27). Artificial neural network is a mathematical model, which stimulates the biological structure of neural networks. It possesses the features of parallel knowledge or information processing and storage distribution, strong self-learning and organizing, and a better adaptive ability (28-30). Radial basis function (RBF) is one of ANN methods having a better classification ability and mapping capability, faster concourse speed, and a unique optimal approximation. Also, it has a less neuron regarding the space of the input to be used in deciding the network’s output; therefore, learning features and performing a nonlinear mapping are the main characteristics of RBF (24, 30). Radial basis function has been applied to biomedical researches such as predicting risk for portal vein thrombosis (30), predicting mortality after bladder cancer cystectomy (31), Modeling and optimization of microbial productions (32), and evaluating the diagnosis of coronary artery disease (33) but rarely, RBF is used to evaluate the variation in immunity to S. typhi infection between two different ethnic populations.
2. Objectives
In the present study, the antibody features of S. typhi O antibody and HLA-DQB1 alleles were determined, measured, and analyzed; the variation in immunity to S. typhi infection was quantitatively evaluated using RBF method. Moreover, we aimed to determine the variation in immunity to S. typhi infection in Sudanese and Chinese as two different populations.
3. Methods
3.1. Subjects
Data from One-hundred and thirty-two serum samples of sixty-six Sudanese and sixty-six Chinese resolved patients with Salmonella were collected. All serum samples analyzed and checked for S. typhi O antibody, and the positive samples have equal Sudanese and Chinese individuals (male:female = 1:1; and age ranged from 16 to 50 years).
3.2. Specimen Treatment, Detection and Interpretation of the Reaction
Sudanese and Chinese serum samples were treated at first for standard reaction using phosphate buffer saline (PBS) solution without 8 mol/L urea and secondly, the reaction changed by using PBS with 8 mol/L urea and the agglutination reaction was detected using Widal test, the results were calculated and interpreted as described previously by Tamomh and Liu (34).
3.3. Salmonella typhi O Antibody Characteristics
3.3.1. Determination of Antibody affinity to Salmonella typhi O Antibody
The affinity of S. typhi O antibody was calculated according to that described by Tamomh and Liu (34) in which serum samples were serially diluted 20-, 40-, 80-, and 160-fold; then the reaction was measured under standard condition (PBS condition) and after changing the standard condition (urea condition). Finally, the values of these dilutions were analyzed using agglutination reaction method, and the corresponding agglutination reaction score values for each dilution were recorded and the value of each reaction condition calculated. The affinity to S. typhi O antibody was quantified by the division of the changed reaction condition values by the standard reaction condition values (34).
3.3.2. Determination of Antibody Activity to Salmonella typhi O Antibody
The activity of antibody to S. typhi O antigen was measured in the standard reaction condition of serially diluted set of PBS without 8 mol/L urea solution. The calculation was obtained according to the law of mass action as described previously by Tamomh and Liu (34), Liu et al. (16), and Han et al. (35). In which the measured value under standard reaction condition (PBS condition value) was used as the total antibody activity measurement value of the antibody.
3.3.3. Determination of total Protein Component of Salmonella typhi O Antibody
The antibody affinity and the total protein component together constitute the activity of the antibody, according to this principle, the total protein component calculated according to the results obtained from the affinity and the total antibody activity S. typhi O antibody as described by Tamomh and Liu (34), H. Liu et al. (16), and Han et al (35), in which the value of protein content (P) obtained from a division of total antibody activity (At) by affinity (aff). Thus,
At = aff × P
Where P denotes protein content of Ab. Therefore, P = At/aff.
3.4. DNA Extraction and HLA Typing
Genomic DNA was extracted according to the protocol of the manufacturer from whole blood using E.Z.N.A.® blood DNA kits (Omega Bio-Tek Company, Norcross, GA, USA). Then HLA typing was performed by PCR amplification with sequence-based typing (PCR-SBT). The identification of the HLA alleles, and the sequence data were processed with an allele typing software AccuTypeTM (Texas BioGene, TX, USA).
3.5. Statistical Analysis
The variation in affinity, protein quantity, and the activity of S. typhi O antibody between Sudanese and Chinese individuals were described in quartile values because of the non-normal distribution. Mann-Whitney U test was used to analyze the variation between the two groups. Binary logistic regression model analysis was used to screen independent variables in the two groups. The strength of the relationship between HLA-DQB1 alleles and the antibody was assessed using Spearman correlation. The calculation was performed using Windows Software for Social Sciences (SPSS 21.0). Data were considered to be statistically significant when the probability of type I error was 0.05 or less.
3.6. Neural Network Model Analysis
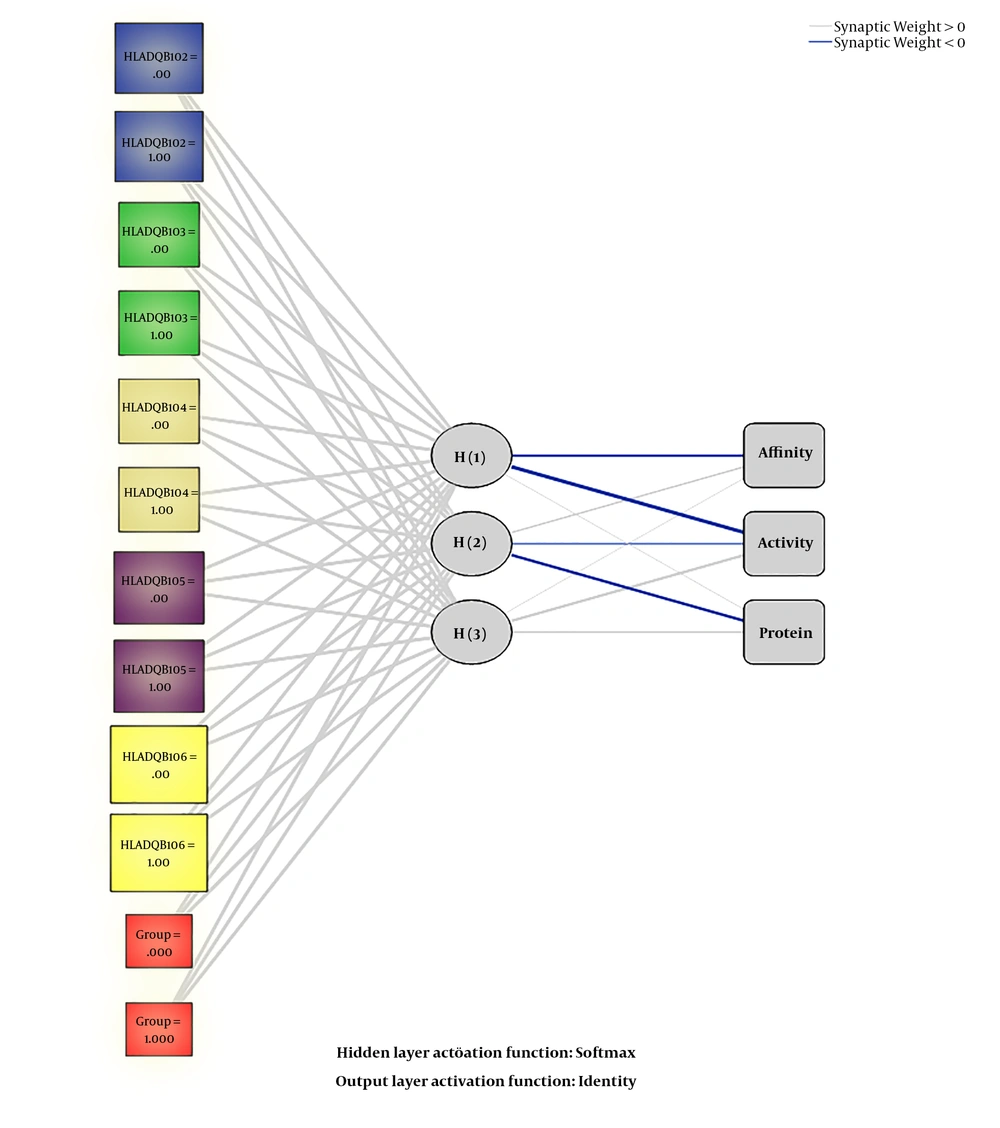
The variation in immunity to S. typhi between Sudanese and Chinese depending on the detailed features of S. typhi O antibody (affinity, protein quantity, and activity) and HLA-DQB1 alleles were quantitatively assessed and evaluated using SPSS 21.0 software (IBM SPSS Statistics, Chicago, IL, USA). Radial basis function as an ANN tool was built, with one input layer, one hide layer, and one output layer recognized, respectively and the synaptic connections linked each layer with the previous layer. The input layer constituted of six points, including the groups (Sudanese and Chinese), HLA-DQB1*02, HLA-DQB1*03, HLA-DQB1*04, HLA-DQB1*05, and HLA-DQB1*06. The unobservable nonlinear unit of a hidden layer, which is called RBF, includes two points. Finally, the output layer, which contains the target variables, interacts with the activation patterns that are used for the input. The method did not select the testing sample settings for evaluating the variation in immunity to S. typhi in the two groups for the importance of each variable or parameter in the system. In addition, learning features and performing a nonlinear mapping are the main characteristics of RBF.
4. Results
4.1. Detection of Quantitative Variables and Qualitative Variables for Each Group
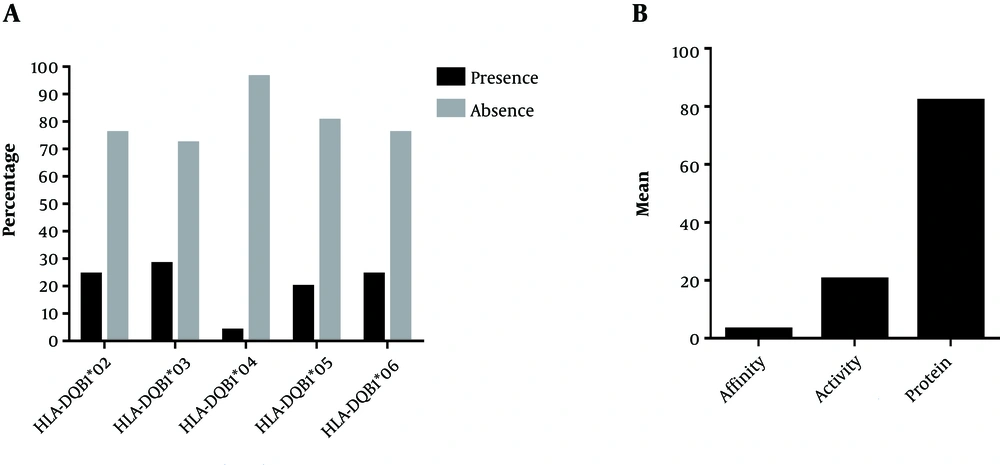
Detection of Antibody Parameters and HLA-DQB1 Alleles Among Sudanese Group: The detection of antibody parameters (affinity, activity and protein quantity) was expressed as Mean ± SD (2.97 ± 0.108), (20.25 ± 4.05), and (81.91 ± 47.20), respectively (Figure 1B). The detection or occurrence as presence or absence (P/A) of the five alleles of the HLA-DQB1 gene (HLA-DQB1*02, HLA-DQB1*03, HLA-DQB1*04, HLA-DQB1*05, and HLA-DQB1*06) is (24.2%/75.8%), (28%/72%), (3.8%/96.2%), (19.75%/80.3%), and (24.2%/75.8%) among Sudanese group, respectively (Figure 1A).
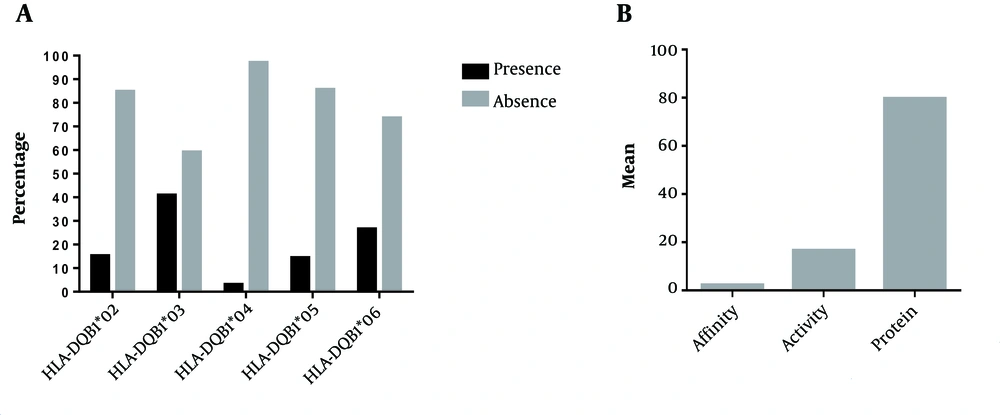
Detection of Antibody Parameters and HLA-DQB1 Alleles Among Chinese Group: The detection of antibody parameters (affinity, activity, and protein quantity) was expressed as Mean ± SD (2.21 ± 0.073), (16.50 ± 1.93), and (79.63 ± 20.11), respectively (Figure 2B). The detection or occurrence as presence or absence (P/A) of the five alleles of the HLA-DQB1 gene (HLA-DQB1*02, HLA-DQB1*03, HLA-DQB1*04, HLA-DQB1*05, and HLA-DQB1*06) is (15.2%/84.8%), (40.9%/59.1%), (3%/97%), (14.4%/85.6%), and (26.5%/73.5%) among Sudanese group, respectively (Figure 2A).
4.2. Determination of the Relationship Between Qualitative and Quantitative Variables for Each Group
Determination of the Relationship Between Antibody and HLA-DQB1 Alleles Among Sudanese group: The relationship of the five alleles of the HLA-DQB1 gene with the antibody among Sudanese group is described in Table 1. A high correlation of HLA-DQB1 alleles and antibody among Sudanese group was observed clearly in HLA-DQB1*05, protein quantity, and activity of the antibody (P < 0.05), but no correlation was found in HLA-DQB1*02, HLA-DQB1*03, HLA-DQB1*04, and HLA-DQB1*06 with the antibody among Sudanese group (P > 0.05).
| Parameters | Affinity | Activity | Protein Quantity | |||
|---|---|---|---|---|---|---|
| r | P Value | r | P Value | r | P Value | |
| HLADQB1*02 | -0.106 | 0.225 | -0.137 | 0.116 | -0.142 | 0.105 |
| HLADQB1*03 | -0.049 | 0.575 | -0.031 | 0.724 | 0.051 | 0.564 |
| HLADQB1*04 | 0.031 | 0.722 | -0.045 | 0.607 | -0.059 | 0.501 |
| HLADQB1*05 | 0.125 | 0.155 | 0.223 | 0.010 | 0.197 | 0.023 |
| HLADQB1*06 | 0.028 | 0.747 | -0.017 | 0.846 | -0.068 | 0.438 |
Determination of the Relationship Between the Antibody and HLA-DQB1 alleles Among Chinese Group: The relationship of the five alleles of the HLA-DQB1 gene with the antibody among Chinese group is described in Table 2. There was no correlation in HLA-DQB1*02, HLA-DQB1*03, HLA-DQB1*04, HLA-DQB1*05, and HLA-DQB1*06 with the antibody among Chinese group (P > 0.05).
| Parameters | Affinity | Activity | Protein Quantity | |||
|---|---|---|---|---|---|---|
| r | P Value | r | P Value | r | P Value | |
| HLADQB1*02 | -0.001 | 0.994 | 0.064 | 0.468 | 0.065 | 0.460 |
| HLADQB1*03 | -0.028 | 0.747 | -0.077 | 0.380 | -0.091 | 0.302 |
| HLADQB1*04 | -0.068 | 0.435 | -0.076 | 0.385 | -0.066 | 0.453 |
| HLADQB1*05 | 0.038 | 0.666 | 0.029 | 0.741 | 0.042 | 0.635 |
| HLADQB1*06 | 0.029 | 0.745 | 0.041 | 0.643 | 0.041 | 0.644 |
4.3. RBF and the Relation Between Quantitative Variables and Qualitative Variables in the Two Groups
The relationship between the two groups and the activity, protein quantity, and affinity to S. typhi O antibody are described in Table 3. A high variation between Sudanese and Chinese populations in affinity (P < 0.05), and no variations in activity and protein content (P > 0.05) to S. typhi O antibody, and the obvious variation was observed in which the antibody production parameters to the antibody of S. typhi O antigen were high in Sudanese populations. The relationship between the five alleles of the HLA-DQB1 gene and the antibody among the two groups is described in Table 4. The high correlation of HLA-DQB1 alleles and antibody in Sudanese and Chinese observed clearly in HLA-DQB1*05, protein quantity, and activity of the antibody (P < 0.05), but no correlation was found in HLA-DQB1*02, HLA-DQB1*03, HLA-DQB1*04 and HLA-DQB1*06 with the antibody between Sudanese and Chinese (P > 0.05). We further assessed whether HLA-DQB1 alleles are independent variables for Sudanese and Chinese with Binary logistic regression analysis; HLA-DQB1*02, HLA-DQB1*04, HLA-DQB1*05, and HLA-DQB1*06 were removed from the equation and only the HLA-DQB1*03 remained in the equation (P < 0.05) (Table 5).
| Parameters | Sudanese Group | Chinese Group | Z | P Value | ||||
|---|---|---|---|---|---|---|---|---|
| P25 | P50 | P75 | P25 | P50 | P75 | |||
| Affinity | 0.210 | 0.309 | 0.375 | 0.200 | 0.200 | 0.228 | -4.070 | < 0.001 |
| Activity | 18.00 | 19.50 | 23.50 | 15.00 | 17.00 | 18.00 | -1.694 | 0.090 |
| Protein | 49.00 | 70.72 | 92.65 | 0.275 | 0.304 | 0.344 | -0.488 | 0.626 |
| Parameters | Affinity | Activity | Protein Quantity | |||
|---|---|---|---|---|---|---|
| r | P Value | r | P Value | r | P Value | |
| HLADQB1*02 | -0.024 | 0.798 | -0.046 | 0.454 | -0.052 | 0.400 |
| HLADQB1*03 | -0.100 | 0.293 | -0.060 | 0.331 | -0.014 | 0.821 |
| HLADQB1*04 | 0.107 | 0.263 | -0.050 | 0.421 | -0.063 | 0.132 |
| HLADQB1*05 | -0.026 | 0.782 | 0.141 | 0.022 | 0.126 | 0.041 |
| HLADQB1*06 | 0.114 | 0.231 | 0.007 | 0.915 | -0.020 | 0.750 |
| Parameters | B | SE | Exp (B) | P Value |
|---|---|---|---|---|
| HLADQB1*02 | Remove in step 4 | - | - | - |
| HLADQB1*03 | -0.575 | 0.262 | 0.563 | 0.028 |
| HLADQB1*04 | Remove in step 2 | - | - | - |
| HLADQB1*05 | Remove in step 3 | - | - | - |
| HLADQB1*06 | Remove in step 1 | - | - | - |
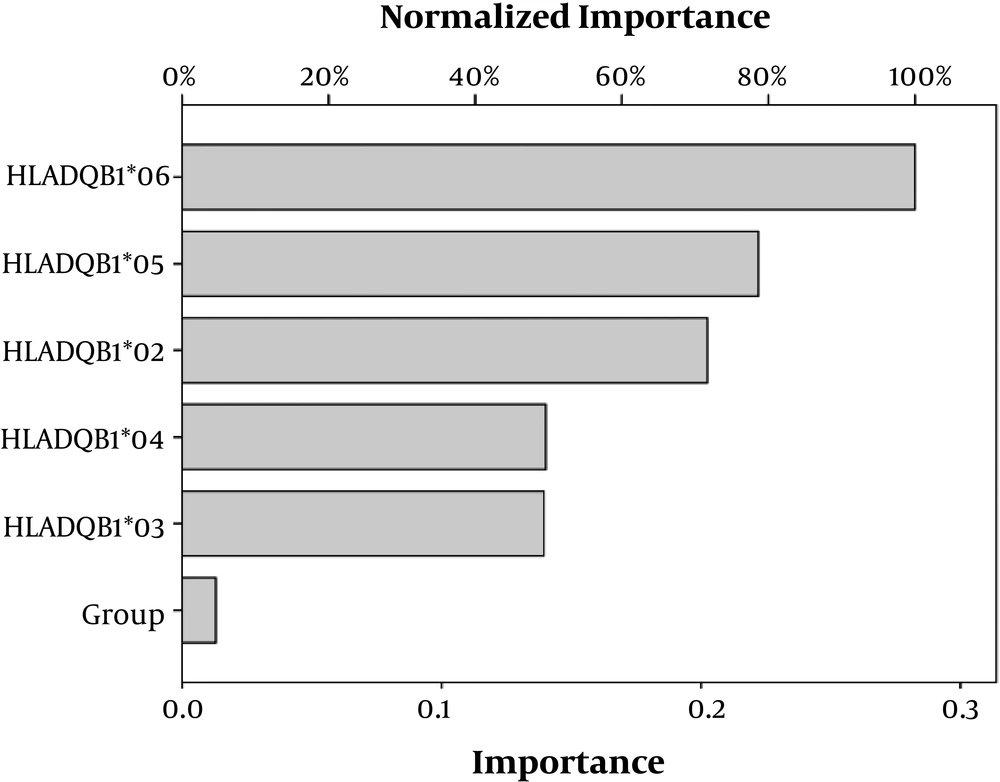
Artificial neural network was performed and the statistical importance and network information for each variable are summarized in Table 6. We used radial basis function as an ANN to evaluate the difference in immunity to S. typhi infection. We found in the training of RBF the protein content, activity, and HLA-DQB1*03 were the important variables among all variables. Figure 3 shows the architecture of the RBF neural network model. The quantitative assessment outcome of the importance of HLA-DQB1 alleles on the variation in immunity to S. typhi infection among the two different ethnic populations is shown in Figure 4. The importance of standardizes percentage distinguishes clearly the high variation between Sudanese and Chinese depending on the variation of the HLA-DQB1 gene.
| Items | Parameters |
|---|---|
| Number of input layer | 1 |
| Number of units in Input layer | 6 |
| Number of hidden layer | 1 |
| Number of units in hidden layer | 3 |
| Activation function in hidden layer | Softmax |
| Number of output layer | 1 |
| Number of units in output layer | 3 |
| Activation function in output layer | Identity |
| Error function | Sum of squares |
5. Discussion
Artificial neural networks are intelligent learning tools, which have been developed and include multiple training models, such as Hopfield learning, back-propagation learning, and radial basis function (RBF). In fact, RBF neural network characteristics are good approximation, simple structure, and faster in learning, when compared with other ANNs (24, 30). Radial basis function stimulated from the human brain, in which has a network structure reciprocally receiving area; therefore, RBF was a kind of network, and had a less neuron regarding the space of the input to be used in deciding the network’s output (30-33). Artificial neural network is a supposition structure of an adaptive system, thus more statistical methods or models can be processed by an ANN without requiring the relationship or any association between variables. The relationships during the learning process, and the inputs and outputs must be in a clear form and this is related to ANN way. The existence of any relationship in the network should be presented in a smooth structure in the linking of synaptic weights and synaptic neurons (36-38). The quantitative evaluation of the immunity to S. typhi in Sudanese and Chinese is the first work applied by RBF artificial neural network among the two ethnic populations.
In the present study, our primary detection results values of antibody parameters showed a high difference in Sudanese (Figure 1B) and among Chinese (Figure 2B). The high antibody parameters usually develop at the end course period of infection leading to the clearance of antigens (16, 34, 35). In addition, our findings showed a high variation of the HLA-DQB1 alleles among Sudanese (Figure 1A) and in Chinese (Figure 2A). A highly polymorphic property of HLA alleles explains the variation in the immune response among different populations (21-23). Our analysis revealed a high correlation of HLA-DQB1 alleles and antibody among Sudanese and observed clearly in HLA-DQB1*05 with the protein quantity, and activity of the antibody (Table 1). On the other hand, our primary analysis also explained no correlation between HLA-DQB1 alleles and antibody among Chinese group (Table 2).
In the present work, our finding showed a high variation in affinity to S. typhi O antibody between Sudanese and Chinese groups. The bacterial antigen clearance results from high-affinity products at the end of the infection (15, 37). Other findings revealed no variation in protein quantity and activity, but showed a higher increase among Sudanese than Chinese populations. A variation in affinity may result from the change in protein quantity or the activity. Our study indicates the variation in immunity to S. typhi for the detailed antibody production features to S. typhi O antibody among Sudanese and Chinese populations (Table 3). We further assessed whether the five alleles of HLA-DQB1 are independent variables for the variation in immunity to S. typhi between the two different ethnic populations by binary logistic regression analysis.
Our findings indicated that the HLA-DQB1*03 allele was in the equation, while the other alleles were removed, resulting the HLA-DQB1*03 allele reflected the variation in immunity to S. typhi, was an independent variable for the two different ethnic groups (Table 4). The variation in HLA-DQB1 alleles results from polymorphic sites of HLA molecules in the two groups. The relationship analysis showed that there was a correlation between the HLA-DQB1*05 with the activity and protein content to S. typhi O antibody (Table 5); the correlation between the HLA-DQB1 and the antibody with the variation in antibody parameters and HLA-DQB1 alleles in Sudanese and Chinese populations were not sufficient to evaluate the variation in immunity, therefore, a conventional statistical methods may be not adequate to display the value of our data. For further analysis in the variation of immunity to S. typhi, RBF as an ANN was constructed, and statistical network information are explained in Table 6. To distinguish and explain the variation in immunity to S. typhi and the importance of HLA-DQB1 and the antibody in the two groups the approximation of the model would perform and correct automatically. Our results explained the importance of HLA-DQB1 alleles in the variation in immunity to S. typhi in Sudanese and Chinese two different populations (Figure 4). This finding, which was obtained from ANN, clearly approximated from the statistical conventional analysis model and proposed a firm result.
In recent years, learning machine and data mining tools have been developed as new methods based on extractions characteristic in biomedicine, such as kernel learning, Bayesian learning networks, and back-propagation learning (26, 30, 39). In the present study, An ANN was used and performed based on SPSS add-on module neural network, close computer software used by a laboratory researcher or investigator. Studies of antibody productions of S. typhi O antibody and HLA molecules with a clear variation between Sudanese and Chinese populations in ethnicity, lifestyle, geographic, and environmental factors deeply may contribute to explain the variation in immunity to S. typhi. We hypothesize that the different values for the analysis and investigation of the detailed features of antibody productions to S. typhi O antibody and HLA-DQB1 gene are still efficient and important in the clinical laboratory to distinguish and understand the variation in immunity to S. typhi between different ethnic populations. Further studies should be done by using new methods of machine learning to explain deep characteristics of immunity to S. typhi.
5.1. Conclusions
We indicated a clear variation in immunity to S. typhi between Sudanese and Chinese as two different ethnic populations. Radial basis function as an artificial neural network was used as a new method to evaluate the variation of the independent variables to distinguish the difference in immunity to S. typhi from a complex of traditional nonlinear methods. The high variation in HLA-DQB1 alleles between the two different ethnic populations may be associated with the variation in immunity in Sudanese and Chinese against S. typhi infection, RBF as one of ANNs should be applied to explore and retrieve a useful knowledge of information.
