


1. Background
Currently, micronutrients are essential in maintaining health and preventing disease (1, 2). Micronutrients also increase the body's immunity, reduce susceptibility to infections (3, 4), and enhance the body's ability to sarcoma viruses (5). Vitamin D is an anti-inflammatory and protects respiratory health against bacteria and viruses (6-8). Vitamin C strengthens the body's immune system and reduces the normal function of the body's immune system and the speed of virus reproduction as an effective antioxidant (8). Studies have indicated that the consumption of micronutrients creates good immunity against disease and reduces the severity of the disease (8-11).
Epidemiology is a data-driven science, and one of the primary roles of epidemiologists is to organize a data set for disease modeling. Today, the explosion in the use of the Internet and mobile phones has led to a new type of epidemiology known as digital epidemiology (12). Digital epidemiology uses data from the global Internet and outside the public health system (5, 13). The Internet and its data are now recognized as an alternative tool for collecting data on disease patterns and population estimates in epidemiology (14, 15). Google is the largest search engine used in the world. The phrases searched on Google and their trends can help understand the public's views on a specific issue regarding the spread of diseases (16). This information source's usefulness in epidemiological research has been shown in many studies (16-18).
Evaluating Internet searches is a way to investigate changes in health events in the community. The Internet and its data are now recognized as an alternative tool for collecting data on disease patterns and population estimates in epidemiology (14, 15). The phrases searched on Google and their trends can help understand the public's views on a specific issue and the spread of diseases (16). Google is the largest search engine used in the world.
2. Objectives
This study aimed to evaluate the trend of micro-brain searches two years ago and during the COVID-19 pandemic using GT.
3. Methods
This ecological study was conducted in the GT database. First, users’ specified search terms related to “COVID-19,” “corona (Iranian COVID-19-19),” “vitamin-D,” “vitamin-C,” and “Neurobion” were searched among all searches performed using GTs from January 2017 to 2023. The volume ranges from 1 to 100, where 100 represents the peak of popularity, and a score of 0 indicates that the phrase is below 1% of its peak (19). Then, Spearman's correlation coefficient was used to check the correlation between the keywords of Micronutrients with the words COVID-19 during different years.
3.1. Data Analysis
Statistical analyses were conducted using SPSS software version 16, and Microsoft Excel; Spearman's correlation coefficient was used to examine the correlation between micronutrient keyword searches and the keyword of COVID-19 over time. The interests were reviewed over time using the data and the GT visuals.
4. Results
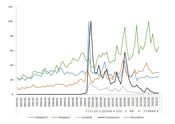
Trends of “vitamin D, vitamin C, Neurobion, COVID-19 and corona (COVID-19 Iranian)” from January 2017 to 2023. In general, an increasing trend could be observed in all keyword searches since 2017. However, corona (Iranian COVID-19) and vitamin D were the most searched in 2020 as a peak, and there was a decreasing trend after that. Neurobion had three peaks in 2021 and 2022. COVID-19 had the least number of searches among keywords. The search peak of all keywords corresponds to the peak of COVID-19 in Iran (Figure 1).
 of search terms vitamin D, vitamin C, Neurobion, COVID-19, corona (COVID-19 Iranian), and (1-8 COVID-19 waves in Iran) from 2017 to 2022.")
Frequency (RSV Google Trends) of search terms vitamin D, vitamin C, Neurobion, COVID-19, corona (COVID-19 Iranian), and (1-8 COVID-19 waves in Iran) from 2017 to 2022.
Figure 2 shows that all the keywords of micronutrients experienced a sharp peak at the same time as the start of the COVID-19 pandemic. The COVID-19 pandemic historically affected the desire to consume micronutrients (Figure 2).

The historical effect of the COVID-19 pandemic on the desire to consume micronutrients in Iran.
The keywords most searched are vitamin D in Ilam and Lorestan province, Neurobion in Kermanshah, corona, COVID-19in Kerman, and vitamin C in Kohgiluyeh Va Boyer Ahmad (Figure 3).

Search frequency of keywords in Google Trends in different provinces.
4.1. Correlation Between Micronutrients and COVID-19 and Corona (Iranian COVID-19)
There was a high and objective correlation coefficient between COVID-19 and vitamin C (R2 = 0 .73, P = 0.001) and Neurobion (R2 = 0.63, P = 0.001). However, no correlation was observed with vitamin D (R2 = 0.18, P = 0.12) (Table 1).
| Letter Name | Vitamin D | Vitamin C | Neurobion |
|---|---|---|---|
| COVID-19 a | |||
| R2 | 0.18 | 0.73 | 0.63 |
| P-value | 0.12 | 0.001 | 0.001 |
| 2019 | |||
| R2 | 0.23 | 0.42 | 0.58 |
| P-value | 0.47 | 0.16 | 0.04 |
| 2020 | |||
| R2 | 0.24 | 0.47 | 0.33 |
| P-value | 0.44 | 0.12 | 0. 28 |
| 2021 | |||
| R2 | 0.50 | 0.70 | 0.28 |
| P-value | 0.09 | 0.01 | 0.37 |
| 2022 | |||
| R2 | 0.04 | 0.42 | 0.16 |
| P-value | 0.89 | 0.14 | 0.59 |
| Corona (COVID-19 Iranian) a | |||
| R2 | 0.16 | 0.73 | 0.62 |
| P-value | 0.17 | 0.0001 | 0.0001 |
| 2019 | |||
| R2 | 0.23 | 0.42 | 0.58 |
| P-value | 0.047 | 0.16 | 0.04 |
| 2020 | |||
| R2 | 0.6 | 0.40 | 0.8 |
| P-value | 0.83 | 0.19 | 0.79 |
| 2021 | |||
| R2 | 0.39 | 0.39 | 0.66 |
| P-value | 0.19 | 0.20 | 0.01 |
| 2022 | |||
| R2 | -0.014 | 0.30 | 0.39 |
| P-value | 0.71 | 0.31 | 0.17 |
a The total (four years).
4.2. Time Series Correlation Coefficients for Four Years Displaying Relationships Search Terms
The correlation trend of vitamin C with COVID-19 increased from 2019 to 2021, peaked in 2021, and then decreased. The trend of vitamin D and COVID-19 peaked in 2021 and then fell. The correlation coefficient between Neurobion and COVID-19 decreased over time (Figure 4).

Time series correlation coefficients for four years displaying relationships between search terms vitamin D, vitamin C, Neurobion, and COVID-19 from 2019 to 2022.
The keywords most searched are vitamin D in Ilam and Lorestan province, Neurobion in Kermanshah, corona, COVID-19 in Kerman, and vitamin C in Kohgiluyeh Va Boyer Ahmad (Figure 5).

Search frequency of keywords in Google trend in different provinces.
5. Discussion
This study evaluated the trend of the general tendencies of Iranian society toward micronutrients before and during the COVID-19 pandemic. The trend for all three micronutrients (vitamin D and C and Neurobion) were strongly growing since 2020, consistent with the search trend of the keywords of COVID-19 and coronavirus and the waves of COVID-19 in Iran and increased their tendency towards micro-brains. Peaks were observed for vitamin D in 2020 (first wave of COVID-19), vitamin C in 2021 (fifth wave), and Neurobion in 2022 (seventh and eighth waves). In addition, in Lorestan, Kermanshah, and Ilam provinces, which are cold with little sunlight in winter, vitamin D was the highest but was the lowest in the areas in the arid and dry region (Qom, South Khorasan) (18, 20).
A positive and significant correlation was observed between vitamin C, COVID-19, and corona. This correlation reached its peak in 2021 and then decreased. These results were consistent with that of Somagutta (2022) et al., who investigated the consumption of micronutrients globally using Google Trends (18). The frequency of vitamin C search was the highest in Kohkiloyeh, Boyer Ahmad, and Ilam and the lowest in Azariaijan East, Golestan, and Ardabil. Low-income and middle-income groups need more supplements than high-income groups due to nutritional conditions (21).
Neurobion correlation with COVID-19 and coronavirus was positive and significant, but it peaked in 2020 and then decreased may be due to the policies of prescribing Neurobion to people with COVID-19 in Iran.
Despite the increasing use of digital data, the quality of these data sources has been largely overlooked. Data quality is a multidimensional concept that refers to the ability of data to be used quickly and effectively to inform and evaluate decisions. Issues with data quality, such as high measurement error, may affect parameter estimation and create inefficiencies.
Internet access still exists in some places, not widely, but limited, so rural areas have more limited access than urban areas. Google is the most dominant search engine, but some may use other tools like Yahoo (22).
Specific subpopulations and cultural differences may not be addressed by Google Train. Additionally, Google Trends data only shows searches made on Google (23-25). Despite a simple and low-cost alternative to a national screening database, Google Trends is still not sufficient to describe the characteristics of screening behavior at the global level and should be compared with other sources of information, such as the volume of referrals for screening and better conclusion (26, 27).
5.1. Conclusions
Based on the results, the search for micronutrients in Iran increased significantly during the COVID-19 pandemic. Public interest may reflect behavior and consumption. However, more detailed epidemiological studies were needed to consume micronutrients during the COVID-19 pandemic in Iran. Finally, GT is a helpful tool for epidemiologists to understand the interests and trends of the general population.
