


1. Context
Mechanical ventilation plays a crucial role in intensive care units, delivering effective care and treatment with confidence (1). The respiratory system's primary function is gas exchange, which relies on maintaining an open airway. In specialized care units, healthcare providers commonly employ endotracheal intubation and mechanical ventilation to enhance gas exchange and alleviate respiratory strain (2, 3). Recent healthcare advancements, notably the advent of ventilators, have significantly contributed to preserving patients’ health and saving lives amid acute respiratory challenges. However, there is an urgent need to acknowledge both the benefits and the complications of this technology (4).
Mechanical ventilation poses potential risks to various bodily systems, including cardiovascular, respiratory, digestive, and skeletal-muscular, impacting water and electrolyte balance and influencing the patient’s psychological well-being. The long-term use of mechanical ventilation can elevate healthcare costs, encompassing ventilation-related expenses. This extended exposure also heightens the risk of adverse outcomes, such as increased mortality, ventilator-associated pneumonia, airway trauma, elevated sedative requirements, and dissatisfaction among patients, families, and healthcare personnel (5, 6). According to existing studies, these complications contribute to prolonged mechanical ventilation, extending ICU and hospitalization durations by four, four, and nine days, respectively (2, 7).
Prolonged mechanical ventilation has negative implications for both patients and the healthcare system (4). Individuals dependent on mechanical ventilation require specialized care, continuous monitoring, and extended stays in dedicated units, albeit at an increased cost. As a result, specialized care units are more important than ever to meet the demand for services that are growing (5, 7). Developing countries face the critical challenge of insufficient beds and ventilation facilities in intensive care units, demanding urgent attention (8). In addition, 40% of a patient’s time on a ventilator is spent on the weaning process, emphasizing the necessity for prompt ventilation discontinuation (8, 9).
Specialists hold varying opinions on determining the optimal timing for successful ventilator weaning with minimal complications (4, 10). Success in weaning from mechanical ventilation is contingent upon factors such as age, absence of underlying diseases, nutritional status, muscle strength, and overall lung function (11, 12). A comprehensive and distinct set of weaning criteria is beneficial for predicting ICU outcomes (4). Weaning protocols typically encompass three key components: Assessing the patient’s readiness, selecting the weaning method, and evaluating the patient for tracheal tube removal. The first part involves assessing readiness based on clinical factors, which vary across protocols. The second component provides a structured guide for reducing device support and choosing the weaning method. The third component includes a checklist outlining the criteria for deciding to remove the endotracheal tube (4, 7).
Diverse extubation methods exist, including pressure support ventilation (PSV) and automatic tube compensation (ACT). In pressure support ventilation, patients with regular breathing efforts but insufficient ventilation per minute receive pressure support from the device regardless of their breathing effort. On the other hand, ACT is a recently introduced ventilation method, part of advanced modes, specifically designed to address challenges in the artificial airway, making spontaneous breathing and weaning more demanding for the patient (13).
3. Method
Following the Preferred Reporting Items for Systematic Reviews and Meta-Analyses (PRISMA) guidelines (14), databases were systematically searched, relevant documents were screened, and predetermined criteria were applied for study selection. Then, the data were analyzed, and a comprehensive report was compiled for integration into the present research agenda.
3.1. Search Strategy
This search encompassed three Iranian databases (IranMedex, MagIran, and SID) using Iranian keywords and four international databases (Science Direct, Scopus, ISI Web of Science) employing English keywords. Additionally, the Google Scholar search engine was examined using English keywords. The chosen keywords were derived from published primary studies and Medical Subject Headings (MESH Terms) in the reviewed databases, aligning with the PECO criteria after meticulously examining the study questions (15).
3.2. Inclusion and Exclusion Criteria
The purpose of this study was to enrich our research on ventilator weaning by incorporating diverse studies. The focus was observational studies, randomized controlled trials, and clinical trials that provided complete text, including details on sample size and weaning criteria. Case reports, case series, and reference studies were intentionally excluded as part of the commitment to quality research.
3.3. Selection and Extraction of Studies
The authors conducted comprehensive reviews upon compiling the retrieved studies in EndNote software. These assessments were both independent and collaborative. Initially, two researchers scrutinized the title and abstract of articles based on predefined entry criteria. Any research discrepancies within a study were impartially resolved by a third party, ensuring a fair and accurate final decision. Subsequently, the full text of studies approved in the initial evaluation underwent a thorough review based on criteria defined according to the PECO criteria.
3.4. Qualitative Evaluation of Studies
The methodological quality of confirmed observational studies underwent assessment in prior stages using the Strobe list (16). This list systematically evaluates various aspects of study reporting, including title clarity, topic description, study type, population statistics, sampling method, appropriate sample size, definitions and procedures, data collection tools, statistical analysis methods, and findings. It comprises 32 items, each scored on a scale of 0 to 32.
Given the inclusion criteria for this systematic review, which focused on high or medium-to-high-quality studies, the authors chose articles with a score of 16 and above. Studies scoring below 16 were deemed unsatisfactory and consequently excluded from the analysis.
3.5. Checklist for Quality Assessment
A specific checklist tailored to the type of study was used to validate and assess the quality of articles, especially clinical trials. In this case, the CONSORT checklist was employed, a widely recognized tool for evaluating intervention studies (17). The CONSORT checklist encompasses six general scales/sections: Title, abstract, introduction, methods, results, and discussion, which consists of 37 items covering various methodological aspects.
A maximum score of 37 was possible for the qualitative assessment using the CONSORT checklist. A score of 17 was set as the cutoff point, designating articles with scores of 17 and above as having high or moderate methodological quality. Scores below 17 indicated poor methodological quality, leading to the exclusion of such articles from the study.
3.6. Data Extraction
Valuable data were meticulously collected using pre-designed forms, encompassing critical criteria such as the number of individuals on mechanical ventilation and demographic information, including the author’s name, publication year, country, continent, study population, and average age. Each detail was methodically entered into the designated forms.
4. Results
Based on the PRISMA guidelines, this systematic review examined the information from studies conducted in Iran on weaning from the ventilator without a time limit until April 2022. Based on the initial search in the target databases, 1103 possible relevant articles were identified and transferred to the information management software (EndNote). Out of the total number of 1103 identified studies, 235 studies were duplicates and were excluded. In the screening stage, 457 articles were eliminated by studying the title and abstract based on the inclusion and exclusion criteria out of the remaining 868 studies. Then, in the merit evaluation stage, 402 articles were removed by studying the full text of the article based on the inclusion and exclusion criteria because irrelevant were removed from the remaining 411 studies. In the eligibility assessment stage, no article was excluded due to poor methodological quality from the remaining nine studies through reading the full text of the article and based on the score obtained from the STROBE checklist. Finally, nine studies were included in the final analysis (Figure 1).
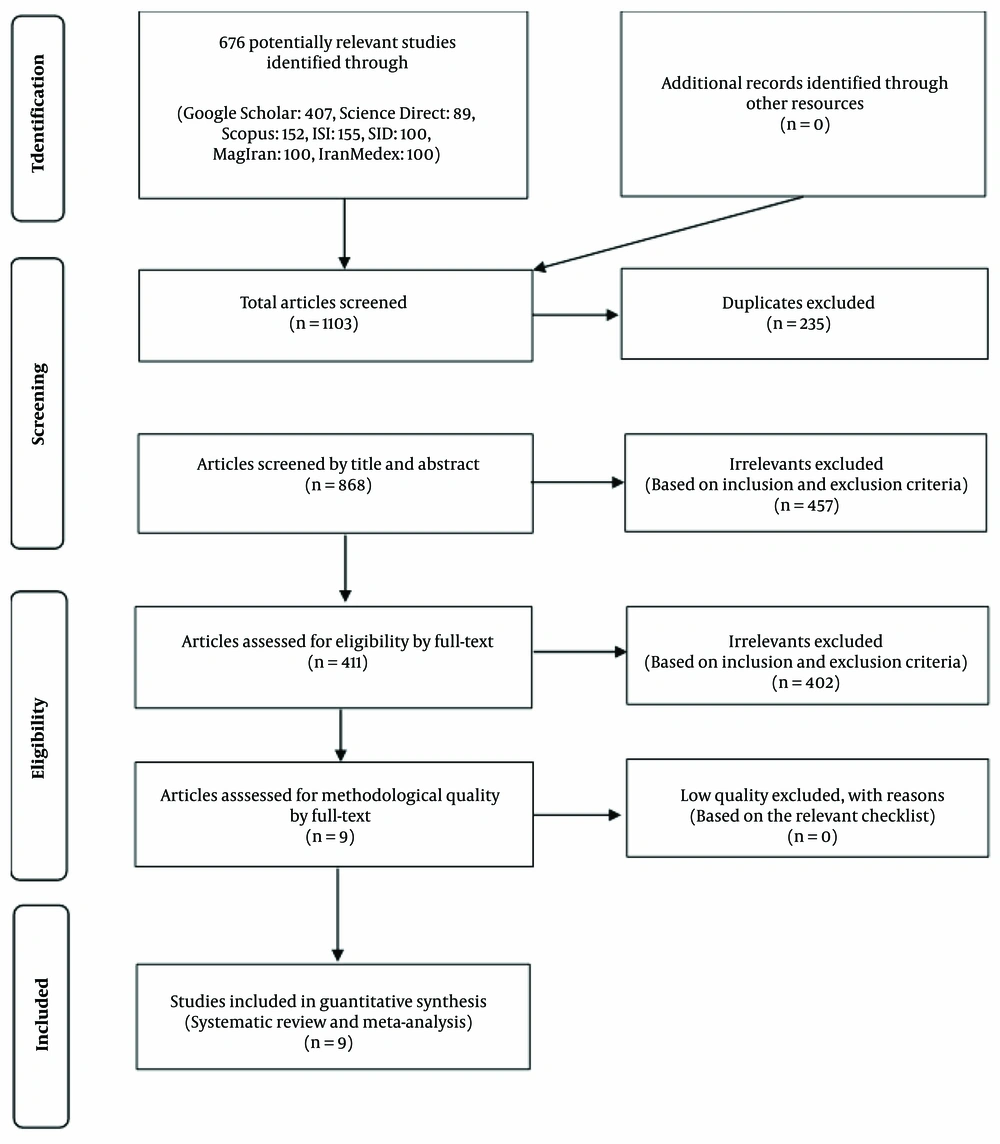
Figure 1.
PRISMA flow chart
A total of 9 studies were included in the systematic review process. These studies were conducted between 2012 and 2018. Among these, four studies were conducted by descriptive method (18-21) and other studies by clinical trial method (22-25). The study sample size was between 44 and 300 people in different studies. Most of the study participants were hospitalized in special wards for adults. Only one study examined children admitted to the pediatric intensive care unit (24).
The studies were conducted with different objectives and used various tools and methods. A study (20) used the SOFA score tool to predict patients' mortality rate and length of stay in intensive care units. This study's results indicated a significant relationship between the SOFA scores on arrival and the mortality rate and length of stay in intensive care units. In addition, using the sofa tool in admitting patients is appropriate, and the result is satisfactory. In another study (18), the APACHE II standard form was used to check the weaning results from the ventilator and ICU patients. The results of this study showed that increasing the score of the APACHE II tool in the first 24 hours increases the mortality rate, which was statistically significant.
Another study (21) investigated the relationship between respiratory indicators and the effective weaning process in patients. The results indicated that respiratory indicators such as patients' respiration rate, spontaneous tidal volume, the fraction of inspired oxygen (FIO2), arterial oxygen saturation (SaO2), The peak inspiratory pressure (PIP), the ratio of respiratory rate to tidal volume, and the ratio of the arterial oxygen saturation to the fraction of inspired oxygen have a significant relationship with the outcome of weaning from mechanical ventilation. In other words, paying attention to the respiratory criteria for the correct isolation of patients is imperative.
Some studies have investigated the effect of different protocols and guidelines for the duration of mechanical ventilation. In a study (26), researchers discussed the effect of sedation instructions on the duration of the patient's connection to mechanical ventilation. The results of this study showed that sedation instructions reduce the duration of connection to the mechanical ventilation device and the patient's stay in intensive care units in patients under mechanical ventilation and needing sedatives. In another study (22). Structured protocols and weaning tools were used compared to conventional methods to reduce the duration of mechanical ventilation and increase the weaning success rate. The results indicated that the structured protocols shorten the duration of mechanical ventilation and the patient's stay in the ward, reducing the number of failed extubations. In another study (19), researchers examined the factors related to the duration of separation from ventilation. The results of this study indicated that the variables of gender and level of wakefulness based on the Ramsey sedation scale had a significant effect on the duration of mechanical ventilation. Still, age and the cause of the connection to the mechanical ventilation device did not affect the duration of mechanical ventilation.
Another group of studies has examined and compared different weaning methods from the ventilator in Mahmoudi et al. (25).The effect of two weaning methods, "patient's effort to continue breathing" and "simultaneous intermittent forced ventilation," was measured based on the physiological indicators of patients. The results of these studies indicated that the "patient's effort to continue breathing" method improved systolic and diastolic blood pressure, heart rate, arterial blood oxygen pressure, and patient's level of consciousness. In another study (23), researchers compared three automatic tube compensation weaning methods and pressure support ventilation with five and eight centimeters of airway pressure water. The results indicated that weaning from the ventilator had more successful statistics than other weaning methods in patients who were automatically subjected to mechanical ventilation under tube compensation mode.
The remaining study examined the population of children hospitalized in the pediatric intensive care unit (PICU). The results (24) showed no statistically significant difference between the CPAP and Humidifier groups. However, such a device is highly recommended based on the difference in mortality, re-intubation rate, hospitalization rate, stay in PICU and the easy availability and low cost of blender-humidifiers. (Tables 1 and 2).
Table 1.Details of the Studies Were Ultimately Incorporated into the Systematic Review
| First Author, Year | Study Type | The Purpose of the Study | The Research Community | Number of People Studied, Average Age, Gender (No. %) | Criteria Used |
|---|---|---|---|---|---|
| Mahboobi Poor, 2013 (20) | Descriptive | The practical application of this system in intensive care units involves predicting the mortality rate and length of stay for patients. | Individuals admitted to the intensive care unit at Al-Zahra Hospital in Isfahan, Iran. | Sample size (N) = 107, mean age: 52.20 ± 21.52, women (n = 65, 60.7%), men (n = 42, 39.3%) | SOFA score tool |
| Babamohammadi, 2017 (26) | Clinical trial | Evaluating the effect of sedation protocols on the duration of a patient's connection to the mechanical ventilation device and their length of stay in the intensive care unit. | All patients undergoing abdominal surgery with a vertical incision can impact the respiratory condition of the patients. | (n = 50) In the case group: Total cases (n = 25), mean age: 50.1 ± 18.8, women (n = 6, 24%), men (n = 19, 76%)/ in the control group: Total cases (n = 25), - mean age: 52.6 ± 12.2, women (n = 6, 24%), men (n = 19, 76%) | Richmond Agitation Sedation Scale (RASS): Evaluating patient agitation. Acute Physiology and Chronic Health Evaluation II, APACHE II (APACHE II): Assessing acute clinical conditions. |
| Ramazani, 2014 (18) | Descriptive-analytical | Investigating the effectiveness of the APACHE II system in predicting outcomes related to ventilator weaning and overall outcomes for ICU patients. | Patients were admitted to the ICU of Imam Ali Bojnoord Hospital and the PACU of Farabi Hospital in Mashhad, Iran. | Sample size (N): 300, age range: 2 - 97 years, women (n = 132, 44%), men (n = 168, 56%) | APACHE II standard form |
| Mahmoudi, M, 2016 (25) | Clinical trial | Analyzing the predictive capability of the APACHE II system for ventilator weaning outcomes and overall results in ICU patients. Additionally, the effects of two weaning methods, "patient's effort to continue breathing" and "simultaneous intermittent forced ventilation," were compared on the physiological indicators of patients under mechanical ventilation. | Patients admitted to the special care departments of a hospital in Arak, Iran. | In the case group: Total cases (n = 22), women (n = 16, 63.6%), men (n = 6, 36.4%)/in the control group: Total cases (n = 22), women (n = 7, 31.8%), men (n = 15, 68.2%) | Examining the effect of the patient's effort to continue breathing versus simultaneous forced ventilation on respiratory outcomes. |
| Kashefi, 2017 (23) | Clinical trial | Evaluating the success rates of separation from the device in three automatic tube compensation methods compared to pressure support ventilation with five and eight centimeters of water pressure in the airway. | Patients admitted to the intensive care unit of Al-Zahra Hospital, Isfahan, Iran. | N = 105 → ATC (n = 35), 52.6 ± 14.5, women (n = 15, 42.8%), men (n = 20, 57.1%)/PSV5, pressure support = 5 (n = 35), 57.6 ± 19.1, women (n = 11, 31.4%), men (n = 24, 68.5%)/PSV8, pressure support = 8 (n = 35), 55.3 ± 18.9, women (n = 7, 20%), men (n = 28, 80%) | Pressure support ventilation mode with PS = 5, pressure support ventilation mode with P = 8, and automatic tube compensation (ATC) mode. |
| Bilan, 2014 (24) | RCT | Comparing the effectiveness of continuous positive airway pressure (CPAP) with a Blender-Humidifier in the weaning process. | PICU patients | Sample size, N = 102, mean age = 22.5 ± 4.5 (month), women (n = 36, 35.2%), men (n = 66, 64.7%) | Evaluating the efficacy of continuous positive airway pressure (CPAP) compared to a Blender-Humidifier. |
| Ghanbari, 2018 (19) | Sectional -analytical study | Identifying factors associated with the duration of weaning from mechanical ventilation in intensive care units. | Individuals undergoing mechanical ventilation and admitted to a Rasht, Iran educational-therapeutic hospital. | N = 65, women (n = 15, 23.1%), men (n = 50, 76.9%) | The Burns Wean Assessment Program (BWAP) score and the Ramsay Sedation Scale. |
| Salmani, 2013 (22) | RCT | Investigating the effect of a weaning protocol on the duration of mechanical ventilation in patients within intensive care units. | Individuals admitted to the special care department of Al-Zahra Hospital in Isfahan, Iran, who were on mechanical ventilation for over 48 hours. | N = 50 → case (n = 25), women (n = 9, 36%), men (n = 16, 64%)/ control (n = 25), women (n = 6, 24%), men (n = 19, 76%) | The score was generated by the Burns Wean Assessment Program (BWAP). |
| Khooby, 2015 (21) | Descriptive-cross-sectional | Analyzing the correlation between key respiratory indicators during the weaning process and assessing the significance of each indicator in predicting the successful removal of patients from mechanical ventilation. | All individuals were admitted to the special care unit at the educational, research, and treatment center of Shahid Rajaei in Tehran, Iran. | N = 251 | Not mentioned |
Table 2.Information of the Final Studies Imported to the Systematic Review
| First Author, Year | Result | Conclusion | Description |
|---|---|---|---|
| Mahboobi Poor, 2012 (20) | The SOFA scoring system showed a direct and significant correlation between admission scores and intensive care unit stay duration. However, there was no significant relationship between scores on subsequent days and length of stay. In addition, there is a significant difference in SOFA scores between initial admission and patient mortality, with higher mortality during admission than subsequent days. | The SOFA scoring system effectively predicts patients' length of stay and mortality rate in special care units. | The P-values for the SOFA score at admission and death are 0.001, with standard errors of 0.015. Similarly, the P-value is 0.001, with a standard error of 0.001 for the SOFA score in the following days and death. |
| Babamohammadi, 2017 (26) | In the control group, the mean duration of mechanical ventilation was 220.8 ± 91.4 hours, significantly longer than the case group (116.4 ± 96.4 hours) with a P-value of < 0.001. Additionally, patients in the control group had a more extended ICU hospitalization (414.2 ± 339.9 hours) compared to the case group (206.2 ± 91.5 hours) with a P-value of < 0.001. The amount of morphine received in the control group (98.56 ± 76.6 mg) was higher than in the case group (42.88 ± 34.6 mg) with a P-value of 0.004. | Sedation instructions for mechanically ventilated patients needing sedatives contribute to reduced duration of mechanical ventilation and shorter hospitalization in the special ward. | Connection time to the device (hours) for the test group was 116.6 ± 96.4, while the control group had a duration of 220.8 ± 91.4 hours. In the test group, the patient's stay in the intensive care unit lasted 206.2 ± 91.5 hours, compared to the control group with a 414.2 ± 339.9 hours duration. The test group received 42.88 ± 36.6 mg of morphine, whereas the control group received 98.56 ± 76.6 mg. The test group received 25.80 ± 15.9 mg of midazolam, while the control group received a comparable amount. |
| Ramazani, 2014 (18) | There was a significant contrast in the average APACHE II score during the initial 24 hours of admission based on the disease outcome (survived or deceased) across the two examined hospitals. A significant distinction was also evident in the serum creatinine levels between the surviving and deceased groups. Furthermore, the rise in APACHE II score within the initial 24 hours of admission exhibited a significant correlation with heightened patient mortality in both hospitals. | Patients' initial 24-hour APACHE II score exhibits a robust correlation with their outcome, indicating that higher scores are more likely to face increased mortality than those with lower scores. | In the surviving group: Serum potassium: 4 ± 0.6, serum creatinine: 1.22 ± 0.8, white blood cells: 9968.6 ± 5002.5/ In the group of deceased patients: Serum potassium: 3.9 ± 1, Serum creatinine: 1.66 ± 1.1, white blood cells: 11385.5 ± 6111.7 |
| Mahmoudi, 2016 (25) | In the intervention group, employing the "patient's effort to continue breathing" method for ventilator weaning significantly decreased the number of breaths per minute, heart rate per minute, and systolic blood pressure from 9 to 12 o'clock. Conversely, these indicators increased in the control group. Additionally, the indices of arterial blood oxygen relative pressure, arterial blood oxygen, level of consciousness, and diastolic blood pressure in the intervention group increased. In contrast, these indices decreased in the control group. | The "patient's effort to continue breathing" method has shown improvement in systolic and diastolic blood pressure, heart rate, arterial blood oxygen pressure, and the patient's level of consciousness. | --- |
| Kashefi, 2017 (23) | The success rates for weaning patients from the ventilator in the three groups—ventilation with automatic tube compensation mode and pressure support ventilation with five and eight centimeters of water—were 88.6%, 57.1%, and 85.7%, respectively. The significant difference between these three groups is notable. | Patients under mechanical ventilation with automatic tube compensation mode demonstrated a higher success rate in ventilator weaning than in other modes. | Under automatic tube compensation (ATC): Success in weaning: 31 out of 88 cases, average weaning time: 7.3 ± 9.6, length of stay in the intensive care unit: 5.11 ± 0.5/ under pressure support ventilation with 5 cm of water (PSV5): Success in weaning: 30 out of 85 cases, average weaning time: 6.10 ± 1.7, length of hospitalization in the intensive care unit: 5.7 ± 8.7/under pressure support ventilation with 8 cm of water (PSV8): Success in weaning: 20 out of 57 cases, average weaning time: 4.6 ± 9.8, length of hospitalization in the intensive care unit: 3.10 ± 3.14 |
| Bilan, 2014 (24) | Coughing was the most common complaint during patient visits (35%), followed by hyperventilation and respiratory distress (21.6%)., Hospital stay:, - Humidifier group: 23 ± 14 days, - CPAP group: 20 ± 12 days, PICU stay:, - Humidifier group: 15 ± 11 days, - CPAP group: 20 ± 11 days, , Re-intubation rate:, - Humidifier group: 16.2%, - CPAP group: 33.5%, Mortality rate:, - Humidifier group: 8.4%, - CPAP group: 21.5% | While there was not a statistically significant difference between the two groups, considering the variations in mortality rate, re-intubation need, and lengths of hospital and PICU stay, coupled with its easy availability and low cost, the recommendation leans towards using a Blender-Humidifier. | Under the Humidifier group: Hospital stay: 23 ± 14 days, - PICU stay: 15 ± 11 days, re-intubation rate: 16.2%, mortality rate: 8.4%/ under the CPAP group: Hospital stay: 20 ± 12 days, - PICU stay: 20 ± 11 days, - Re-intubation rate: 33.5%, mortality rate: 21.5% |
| Ghanbari, 2018 (19) | The average duration of mechanical ventilation, utilizing the Burns Wean Assessment Program (BWAP) for weaning, was approximately 33.46 ± 11.75 hours. Additionally, the study revealed that gender and the level of consciousness, as assessed by the Ramsay sedation scale, significantly influenced the duration of mechanical ventilation. However, age and the cause for connection to the mechanical ventilation device did not significantly impact the duration of mechanical ventilation. | Factors such as gender and level of consciousness must be considered when assessing a patient's readiness for weaning from the mechanical ventilator. These two variables should also be considered when employing imaging tools for evaluation. | The study aims to explore the impact of age, gender, education, cause of attachment, and Ramsay sedation score on the duration of weaning, utilizing the Burns Wean Assessment Program (BWAP)/ Duration of mechanical ventilation for trauma-related cases: 85.29 ± 24.114, Duration of mechanical ventilation for non-trauma cases: 123.62 ± 17.54, Ramsay sedation score for levels 1 and 2 wakefulness: 32.34 ± 58.122, Ramsay sedation score for level 3 awakening: 72.20 ± 97.91 |
| Salmani, 2013 (22) | The intervention group exhibited a significantly lower average duration of mechanical ventilation than the control group. Additionally, the average patient stay in the ICU was markedly reduced in the intervention group compared to the control group. Moreover, there was a statistically significant difference in the unsuccessful extubation rate between the intervention and control groups. | Utilizing structured protocols and weaning tools in intensive care units, as opposed to conventional methods, has been shown to reduce the duration of mechanical ventilation and the patient's hospitalization in the ward. This approach also contributes to a decrease in the number of failed extubations. | Under the intervention: Duration of mechanical ventilation: Six days (SD 4), Length of stay in the special ward: 3.10 days (SD 1.7)/under the control group: Duration of mechanical ventilation: Seven days (SD 1), Length of stay in the special ward: 5.16 days (SD 5.1) |
| Khooby, 2012(21) | Various factors, including patients' respiration rate (P ≤ 0.0001), spontaneous breathing tidal volume (P ≤ 0.0001), the fraction of inspired oxygen (P = 0.014), arterial blood oxygen saturation (P = 0.006), maximum inspiratory pressure (P ≤ 0.0001), respiratory rate to tidal volume ratio (P ≤ 0.0001), and arterial blood oxygen to inhaled oxygen fraction ratio (p≤0.0001), showed a significant relationship with the outcome of weaning from mechanical ventilation., However, there was no significant correlation between minute ventilation indices (P = 0.75) and positive end-expiratory pressure (PEEP) (P = 0.20) with the weaning outcome from the ventilator. | Respiratory signs had the most crucial impact in predicting the weaning outcome from mechanical ventilation. | In the successful weaning group:, - Respiration rate: 2.3 ± 17, - Current breathing volume: 98.6 ± 368.3, - The fraction of inspired oxygen: 58.5 ± 5.3, - Maximum positive inspiratory pressure: 23.1 ± 3.3, - Arterial oxygen saturation: 3 ± 95.9, - Minute ventilation: 6.2 ± 1.8, - Positive pressure at the end of exhalation: 3.8 ± 1.6, - The ratio of breathing rate to tidal volume: 14.5 ± 50.1, - Arterial blood oxygen ratio to the fraction of inspired oxygen: 54.8 ± 182/in the failed weaning group:, - Breathing rate: 25.4 ± 3.5, - Current breathing volume: 59.5 ± 245.1, - Inhaled oxygen fraction: 9.3 ± 60.9, - Maximum positive inspiratory pressure: 16.8 ± 1.9, - Arterial oxygen saturation: 92.4 ± 8.4, - Minute ventilation: 6.1 ± 1.5, - Positive pressure at the end of exhalation: 4.1 ± 1.5, - The ratio of breathing rate to tidal volume: 44.1 ± 112.2, - The ratio of arterial blood oxygen to the fraction of inspired oxygen: 41.2 ± 137.5 |
5. Discussion
The process of withdrawing mechanical ventilation is crucial for patients in intubation care. However, there is no consensus on the optimal approach for weaning patients from ventilators. The day of extubation was a pivotal point for ICU patients, and even when meeting weaning criteria, 10 - 20% of extubation attempts were unsuccessful, with a significant mortality rate ranging from 25 - 50% (27-29).
The process of withdrawing children from ventilators presented more complexities compared to adults. Research on pediatric weaning from ventilators and intubation is commonly divided into two groups: (1) those detailing the procedure, often in a PICU setting (30-33), and (2) those retrospectively attempting to identify factors predicting successful intubation (13, 31, 34).
An article published in Urmia, Iran, analyzed the relationship between tidal volume respiratory rate and ventilator isolation outcomes in patients under mechanical ventilation. It is stated that there is a statistically significant relationship between the value of the rapid respiratory index and the outcome of ventilator isolation (35). Several studies have investigated the effects of respiratory rate, along with other relevant factors, on the outcome of isolation from mechanical ventilation (35). Even though the accuracy of predicting the outcome of weaning from mechanical ventilation has been criticized in some articles, scientific sources state that this ratio is accurate in patients under mechanical ventilation. There is a high probability that isolation from the mechanical ventilation device has been successful if the respiratory rate to tidal volume is less than 80. A message about isolation from the mechanical ventilation device may or may not be successful in patients with respiratory rates between 80 and 100 (36). In addition, in patients whose ratio (number of breaths to tidal volume) is more than 100, the result of isolation from the mechanical ventilation device was likely unsuccessful (36).
While adhering to a weaning protocol for ventilator withdrawal results in faster and better outcomes in adults, the evidence supporting this approach for children is limited (37). A study involving 16 PICUs in the United States provided valuable insights into intubation and extubation methods, revealing a 6.2% failure rate for extubation (re-intubation within 24 hours) among 1459 patients intubated for at least 48 hours and mechanically ventilated for 3 to 7 days. Risk factors for failed extubation included being 24 months old, having dysgenetic or syndromic status, chronic respiratory or neurological disorders, and the need for endotracheal tube replacement during admission (33).
The available data emphasize that crucial elements in successful weaning from the ventilator and avoiding unnecessary prolonged mechanical ventilation include timely recognition of weaning readiness and extubation (38, 39). Inadequate decision-making regarding preparation for weaning and intubation poses risks. Increased work of breathing during ventilatory support reduction for weaning can lead to respiratory and cardiac failure (37, 40). A study revealed that reintubation due to respiratory failure after extubation escalates mortality by 2.5 to 10 fold compared to patients who do not require re-intubation (29).
5.1. Limitations
The systematic review faced limitations due to the restricted population studied in Iran, resulting in a small number of final studies included. Additionally, the investigation of various weaning methods from the ventilator was limited due to the constraints within the available studies. The scattering of quantitative data further prevented the conditions for conducting a meta-analysis.
5.2. Conclusions
The results show that recognizing and implementing strategies to enhance successful mechanical ventilation weaning is a priority for research and quality improvement. While the present study has reviewed evidence on strategies for successful ventilator weaning in Iran, more studies are needed to investigate the effectiveness of these weaning strategies thoroughly.
