


1. Background
Sleep problems are a significant public health issue that can increase the mortality rate among people and impose a substantial financial burden on society from an economic perspective (1). Sleep problems are prevalent among adolescents and young adults (2, 3), including a wide range, including insomnia, reduced total sleep time, increased sleep onset latency, nighttime awakenings (4), reduced sleep quality, delayed sleep onset, sleep efficiency, sleep cycle disturbances, sleep fragmentation, sleep medications, and daytime sleepiness (5). Nightmares can also be considered as part of sleep problems (6). Sleep problems are associated with mental disorders such as depression and post-traumatic stress disorder (PTSD) (7) as risk factors for self-harming and suicidal behaviors (8, 9) and contribute to the development of physical problems and diseases such as heart disease and diabetes (10, 11). Furthermore, sleep problems make a person susceptible to poor metabolic health and weight gain (12), affecting systemic inflammation (13).
Studies have indicated that sleep problems are complex issues, which should be understood (14). Furthermore, sleep problems may lead to potentially life-threatening symptoms, which are the consequences of this and primary triggers of other diseases (15). Thus, more comprehensive studies are needed to explore these problems. In addition, natural or social crises always have consequences that affect social, family, and psychological life (16), including the COVID-19 pandemic, which has adverse social and economic consequences and health threats. Therefore, these conditions may have affected people’s sleep health. Studies have shown that sleep problems increased during the COVID-19 pandemic, and these problems have had consequences for people (17-19). A study showed that sleep problems play a role in the prevalence and persistence of PTSD and depression in university students during the COVID-19 pandemic (20). A longitudinal study also showed that sleep problems had a significant relationship with the increase in suicide during the COVID-19 pandemic (21).
Many studies have addressed risk factors for sleep problems (22-25). The results of one study indicated that alcohol consumption, inadequate physical activity, and current smoking are risk factors for the occurrence of sleep problems (26). However, these studies seem insufficient, especially in the young population. A review of previous research indicates that studies on the prevalence of sleep problems in Iran have been previously conducted (27-30). However, some of these studies are from more than a decade ago (27, 29), during which significant social changes have occurred. Issues such as the COVID-19 pandemic create the need to gather new information. A study on the adolescent population (28) highlighted the need to investigate the prevalence of sleep problems in the young population. Some other studies (29, 30) have only examined the severity of insomnia, but we have explored various dimensions of sleep problems in this study.
In recent decades, Iran has faced rapid social, economic, and demographic changes. Currently, the urban population in this country is over 70%, and young people constitute a significant part of the country’s population (31). Effective planning to provide mental health services to the community requires basic information, epidemiological studies, and an understanding of the magnitude of the problem. Hence, studying the epidemiology of mental disorders can raise the awareness of health, educational, and medical officials and workers about the importance and scale of mental disorders and contribute to providing essential mental health services to citizens in the country (32) as a case for sleep problems. Thus, identifying the severity of health problems for public health planning is one of the vital requirements of the public health system. Considering the importance of the young population in the development of society and the role of sleep quality in young people's health, this study aims to investigate the quality of sleep and sleep problems among Iranian young people.
2. Methods
2.1. Study Design
This study was conducted using a descriptive cross-sectional design.
2.2. Study Population and Sample
The research population consisted of all young people aged 18 to 35 living in Kermanshah, Sanandaj, Ilam, and Hamadan (western Iran) in 2020. A total of 5000 questionnaires were distributed in these cities among people who met the inclusion criteria, of whom 4748 persons with an average age of 27.58 years were selected as the participants in the research sample. About 60.4% of the participants were men.
The inclusion criteria were: (1) Willingness to participate in the study; (2) being in the age range of 18 to 35 years; (3) living at least five years in the western cities of Iran; and (4) having no chronic physical diseases such as diabetes, cardiovascular diseases, respiratory diseases, and thyroid problems. Besides, the exclusion criteria included having (1) non-Iranian nationality, (2) an incurable disease, (3) chronic mental disorders, especially personality disorders, and (4) an addiction to all kinds of drugs.
2.3. Procedure
A notice containing general information about the research objectives and the research procedure was posted on online social networks and channels allowed in Iran, such as WhatsApp and Instagram, from October 2020 to March 2021 to invite people to participate in this study. A total of 5452 persons who volunteered to participate in the study were identified. The questionnaires and informed consent forms were sent to 5000 persons who met the criteria for entering the study. Finally, 4748 questionnaires were returned, and the data from these questionnaires were used for analysis.
2.4. Instruments
2.4.1. Pittsburgh Sleep Quality Inventory
This 19-item instrument was developed by Buysse et al. (1989). Pittsburgh Sleep Quality Inventory (PSQI) is a standard questionnaire with 18 items scored from 0 to 21. A higher score indicates a poorer quality of sleep. A score higher than 5 indicates poor sleep quality. The reliability of the PSQI was assessed using Cronbach’s alpha, and its value was 0.83 (33). A meta-analysis study showed that the inventory is a suitable tool for screening sleep problems (14). In the current study, Cronbach’s alpha of this inventory was 0.91.
2.4.2. Insomnia Severity Index
This instrument was used to measure the severity of insomnia with seven items that assess the severity of sleep onset, sleep maintenance, early morning awakening problems, sleep dissatisfaction, interference of sleep difficulties with daytime functioning, and distress caused by sleep difficulties. Each item is scored from 0 to 4 depending on the severity of insomnia, and a respondent’s total score equals the sum of the scores given to the seven items (34). In the current study, Cronbach’s alpha for Insomnia Severity Index (ISI) was 0.92.
2.4.3. Nightmare Questionnaire
The intensity of nightmares was measured using the question: “Have you had any scary dreams and nightmares in the last six months?” The participants were asked to choose one option: Never (1), rarely (2), some nights (3), often (4), most of the nights (5), and almost every night (6). This assessment had been used in a similar study (8).
2.5. Data Analysis
The collected data were analyzed using SPSS software version 22. The mean and standard deviation were used to describe the data, and the frequencies were compared using the chi-square test. Pearson’s correlation test was used to check the relationship between the variables after establishing the statistical assumptions. Moreover, a one-way analysis of variance (ANOVA) was used to compare the group’s means. Logistic regression analysis was also used to predict sleep problems.
3. Results
The participants were 4748, of whom 2866 persons (60.4%) were men and 1882 persons (39.6%) were women. The participants’ ages ranged from 18 to 35 years, with a mean age of 27.58 ± 5.27. Table 1 shows the participants’ demographic characteristics
| Variables | No. (%) |
|---|---|
| Sex | |
| Male | 1882 (39.6) |
| Female | 2866 (60.4) |
| Age (y) | |
| 18 - 35 | 1740 (36.6) |
| 25 - 30 | 1178 (24.8) |
| 30 - 35 | 1830 (38.5) |
| Marital status | |
| Single | 1420 (29.9) |
| Married | 2934 (61.8) |
| Others | 394 (8.3) |
| Education | |
| Under diploma | 812 (17.1) |
| Diploma | 1854 (39) |
| Bachelor's degree | 1528 (32.2) |
| Higher | 554 (11.7) |
| Occupation | |
| Unemployed | 842 (17.7) |
| Student | 1324 (27.9) |
| Employed | 2582 (54.4) |
| Smoking | |
| Yes | 770 (16.2) |
| No | 3978 (83.8) |
| Alcohol use | |
| Yes | 936 (19.7) |
| No | 3812 (80.3) |
3.1. Sleep Problems Reported by the Participants
Table 2 shows the descriptive statistics for the sleep quality subscales (sleeping problems in the last month) and the severity of insomnia by gender.
| Domains | Total | Female | Male | F | P-Value |
|---|---|---|---|---|---|
| Subjective sleep quality | 1.07 ± 0.77 | 1.01 ± 0.77 | 1.11 ± 0.78 | 19.96 | 0.001 |
| Sleep latency | 0.89 ± 0.78 | 1.03 ± 0.89 | 0.79 ± 0.70 | 107.64 | 0.001 |
| Sleep duration | 0.38 ± 0.78 | 0.43 ± 0.87 | 0.36 ± 0.72 | 9.91 | 0.002 |
| Sleep efficiency | 0.25 ± 0.74 | 0.40 ± 0.90 | 0.15 ± 0.58 | 135.56 | 0.001 |
| Sleep disturbances | 1.22 ± 0.66 | 1.18 ± 0.68 | 1.25 ± 0.64 | 13.32 | 0.001 |
| Sleeping medication | 0.82 ± 0.82 | 0.63 ± 0.80 | 0.95 ± 0.81 | 183.44 | 0.001 |
| Daytime dysfunction | 1.04 ± 0.20 | 1.03 ± 0.18 | 1.04 ± 0.21 | 3.01 | 0.08 |
| Sleep quality (total) | 5.26 ± 2.67 | 5.71 ± 2.95 | 5.66 ± 2.46 | 0.47 | 0.49 |
| Insomnia Severity Index | 6.19 ± 4.33 | 6.75 ± 5.82 | 5.82 ± 3.95 | 980.31 | 0.001 |
Table 2 indicates that the total mean score for sleep problems among the Pittsburgh Sleep Quality Inventory participants was 5.68 ± 2.67, showing no significant difference between the male and female participants. However, this value confirmed the poor sleep quality among the participants. Furthermore, there were significant differences between the male and female participants regarding the sleep quality subscales, except for daytime dysfunction. However, insomnia was more severe in the female participants than the male participants. Table 3 shows the prevalence of sleep problems reported by the participants.
| Variables | Total | Female | Male | P-Value |
|---|---|---|---|---|
| Sleep Quality | 0.40 | |||
| 0 - 5 (good sleeper) | 2638 (55.6) | 1060 (56.3) | 1578 (55.1) | |
| 6 - 21 (poor sleeper) | 2110 (44.4) | 822 (43.7) | 1288 (44.9) | |
| Insomnia severity | 0.001 | |||
| 0 - 7 (normal) | 3344 (70.4) | 1226 (65.1) | 2118 (73.9) | |
| 8 - 14 (subthreshold) | 1168 (24.6) | 524 (27.8) | 644 (22.5) | |
| 15 - 21 (moderate severity) | 194 (4.1) | 110 (5.8) | 84 (2.9) | |
| 22 - 28 (severe) | 42 (0.9) | 22 (1.2) | 20 (0.7) | |
| Nightmare | 0.001 | |||
| Has not experienced | 928 (19.5) | 512 (27.2) | 416 (14.5) | |
| Rarely happened | 1654 (34.8) | 596 (31.7) | 1058 (36.9) | |
| Experienced some nights | 1378 (29) | 504 (26.8) | 874 (30.5) | |
| Experienced a lot | 482 (10.2) | 162 (8.6) | 320 (11.2) | |
| Happened most nights | 148 (3.1) | 40 (2.1) | 108 (3.8) | |
| Experienced every night | 158 (3.3) | 68 (3.6) | 90 (3.1) |
As shown, 44.4% of the participants reported poor sleep quality and suffered from sleep problems. However, there was no significant difference between the male and female participants regarding the prevalence of sleep problems. Table 3 also presents that 4.1% of the participants had moderate insomnia, and 0.9% reported severe insomnia. Moderate and severe insomnia was reported by 5.8% and 1.2% of the female participants, and the corresponding values were 2.9% and 0.7% for the male participants, indicating significant differences between the male and female participants with insomnia being more severe in the women.
As shown in Table 3, in the last six months, 29% of the participants have nightmares on some nights, 10.2% have a lot of nightmares, 3.1% have nightmares most nights, and 3.3% have nightmares every night. The data also confirm a significant difference between the male and female participants in the intensity of nightmares and scary dreams in the last six months, with a higher frequency of nightmares among men. Table 4 presents the prevalence of sleep complaints throughout life.
| Group | Total | Female | Male | P-Value |
|---|---|---|---|---|
| With sleep problem | 2090 (44) | 864 (45.9) | 1226 (42.8) | 0.02 |
| Without sleep problem | 2658 (56) | 1018 (54.1) | 1640 (57.2) |
As shown in Table 4, 44% of the participants reported sleep problems such as insomnia, nightmares, hypersomnia, apnea, sleepwalking, etc. during their lifetime. Moreover, 45.9% of the female and 42.8% of the male participants reported sleep problems, indicating a significant difference between the men and women.
3.2. Prediction of Sleep Problems
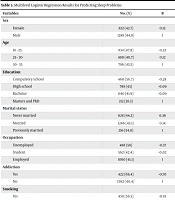
Multilevel logistic regression was used to predict sleep problems in the participants, as shown in Table 5.
| Variables | No. (%) | B | OR (95% [CI]) | P-Value |
|---|---|---|---|---|
| Sex | ||||
| Female | 822 (43.7) | 0.12 | 1.13 (0.99 - 1.30) | 0.064 |
| Male | 1288 (44.9) | 1 | 1 | - |
| Age | ||||
| 18 - 25 | 834 (47.9) | -0.22 | 0.80 (0.69 - 0.94) | 0.005 |
| 25 - 30 | 480 (40.7) | 0.12 | 1.12 (0.96 - 1.31) | 0.146 |
| 30 - 35 | 796 (43.5) | 1 | 1 | - |
| Education | ||||
| Compulsory school | 460 (56.7) | -0.28 | 0.75 (0.59 - 0.96) | 0.024 |
| High school | 798 (43) | -0.09 | 0.92 (0.74 - 1.13) | 0.431 |
| Bachelor | 640 (41.9) | -0.09 | 0.92 (0.74 - 1.13) | 0.416 |
| Masters and PhD | 212 (38.3) | 1 | 1 | - |
| Marital status | ||||
| Never married | 628 (44.2) | 0.36 | 1.43 (1.11 - 1.84) | 0.005 |
| Married | 1266 (43.1) | 0.14 | 1.15 (0.911 - 1.45) | 0.242 |
| Previously married | 216 (54.8) | 1 | 1 | - |
| Occupation | ||||
| Unemployed | 488 (58) | -0.37 | 0.69 (0.57 - 0.83) | 0.001 |
| Student | 562 (42.4) | -0.02 | 0.98 (0.86 - 1.14) | 0.790 |
| Employed | 1060 (41.1) | 1 | 1 | - |
| Addiction | ||||
| Yes | 422 (69.4) | -0.70 | 0.50 (0.36 - 0.68) | 0.001 |
| No | 1562 (40.4) | 1 | 1 | - |
| Smoking | ||||
| Yes | 458 (59.5) | -0.19 | 0.83 (0.69 - 1) | 0.053 |
| No | 1652 (41.5) | 1 | 1 | - |
| Alcohol use | ||||
| Yes | 536 (57.3) | -0.25 | 0.78 (0.66 - 0.92) | 0.003 |
| No | 1574 (41.3) | 1 | 1 | - |
| Cell phone | ||||
| Never | 66 (45.8) | 0.54 | 1.72 (1.18 - 2.49) | 0.004 |
| Some times | 352 (37.4) | 0.55 | 1.73 (1.45 - 2.06) | 0.001 |
| Most nights | 890 (41.6) | 0.35 | 1.41 (1.22 - 1.64) | 0.001 |
| Every night | 802 (52.6) | 1 | 1 | - |
| Sleep problem (in past) | ||||
| Yes | 1132 (54.2) | -0.54 | 0.58 (0.52 - 0.66) | 0.001 |
| No | 978 (36.8) | 1 | 1 | - |
Abbreviations: B, unstandardized coefficient; OR, odds ratio.
The logistic regression analysis showed that the participant’s age, education, marital status, occupation, drug abuse, alcohol consumption, use of mobile phones and the internet, and a history of previous sleep problems played a role in predicting sleep problems during the COVID-19 pandemic (P < 0.05). The data indicated that sleep problems were more prevalent in younger people, people with lower education, single and unemployed people, people who consumed alcohol, and those who had more substance abuse. Furthermore, the results indicated those with a previous history of sleep problems were probably more involved in sleep problems.
4. Discussion
Young people experienced poor sleep quality during the COVID-19 pandemic. Specifically, 44.4% of the participants reported unfavorable sleep quality and encountered sleep-related problems. However, there was no significant difference in the prevalence of sleep problems between women and men. Sleep disorders are common in the general adult population and are associated with various adverse effects (35). One study categorized sleep problems in adults into three groups: Difficulty falling asleep, behavioral and movement disorders during sleep, and excessive sleepiness during the day (35). Sleep problems are widespread, affecting 9 - 20% of adults in the United States and 7% in Europe (36). These results show a significant difference in the prevalence of sleep problems in the present study, which was estimated to be higher than 44%.
A study conducted on young people aged 17 to 24 years (37) showed that sleep problems are highly prevalent in this population. The prevalence of sleep problems measured by the PSQI was higher than 60%. The results also indicated that sleep and wake times were delayed on weekends, and participants frequently used prescribed, over-the-counter, and psychoactive drugs to alter sleep/wakefulness (37). The prevalence of sleep problems reported in this study (37) was significantly higher than the values estimated in the present study. Another study reported the frequency of sleep problems was about 7% in people aged 19 to 33 years (38). Another study reported the prevalence of sleep problems to be 22.3% (39). These conflicting findings can be attributed to sociocultural and economic issues, differences in the research sample, and time. However, studies conducted during the COVID-19 pandemic also reported different rates of sleep problems. For example, a study showed that the prevalence of sleep problems was about 30% among the young population during the COVID-19 pandemic (40), which was lower than the prevalence rate reported in the present study.
The present study showed that 4.1% of the participants had moderate insomnia, and 0.9% had severe insomnia, which was 34.9% in another study (41). A further study showed that almost 41% of the young population suffered from severe insomnia during the COVID-19 pandemic (42).
The data in this study revealed that 29% of the participants had nightmares some nights in the last six months, 10.2% had a lot of nightmares in the last six months, 3.1% had nightmares most nights, and 3.3% of them had nightmares every night. The data also confirmed a significant difference between the male and female participants in the intensity of nightmares and scary dreams in the last six months, with over 45% of the participants having nightmares in the previous six months. A study (43) showed that 45.2% of the participants reported nightmares at least once in the last month, and 7.9% had nightmares at least once a week. However, contrary to the present study, girls reported more nightmares than boys (43). A few studies have addressed the prevalence of nightmares in young people, so it is difficult to draw general conclusions.
The age below 25 years, lower education levels, being single, unemployment, drug abuse, alcohol consumption, excessive use of mobile phones and the internet, and having a history of previous sleep problems accounted for sleep problems among young people during the COVID-19 pandemic. However, another study addressing the factors related to sleep problems among young people during the COVID-19 pandemic showed that factors such as age over 24 years, higher education, and negative attitudes towards COVID-19 could predict sleep problems (44). Another study revealed that exercise, alcohol, and caffeine consumption and stability of sleep schedule are not significant predictors of sleep quality in young people (37). These results were not consistent with the findings of the present study. However, one study showed that alcohol consumption is related to sleep problems (45), and another study reported that smoking is related to sleep problems, such as maintaining sleep, breathing problems during sleep, and difficulty in sleep onset (46), as was confirmed in the present study.
The results of the present study concerning the role of using mobile phones and surfing the internet (before sleep) in sleep problems are contradictory because the prevalence of sleep problems in people who have never used a mobile phone an hour before sleep was higher than those who used mobile phones “some nights” and “most nights.” However, sleep problems were less prevalent in these people than those who used mobile phones every night. Therefore, drawing solid conclusions about the role of using mobile phones in sleep problems is not possible. Nevertheless, contrary to previous studies, those who used mobile phones every night reported more sleep problems. A review study showed that screen time has a negative relationship with sleep outcomes (mainly a shorter sleep time and sleep latency) in 90% of studies (3). Another study found that dependence on mobile phones is related to poor subjective sleep quality and latency (47). These results have been confirmed in another study (48). Thus, further research is needed to explore this issue.
4.1. Conclusions
Based on the results, there was a high prevalence of sleep problems among Iranian young people during the COVID-19 pandemic, but there was no significant difference between men and women regarding the prevalence of sleep problems. The data in this study showed that age below 25 years, lower education levels, being single, unemployment, drug abuse, alcohol consumption, excessive use of mobile phones and the internet, and having a history of previous sleep problems can account for sleep problems among young people during the COVID-19 pandemic.
4.2. Suggestions
(1) This study was conducted using a cross-sectional design, and the data were collected through self-report instruments, which could affect behaviors such as sleep. Thus, future studies need to use other instruments.
(2) The present study was conducted on people living in urban areas in western Iran. Thus, we need to be cautious in generalizing the results to other groups and populations. Furthermore, these variables should be addressed in other societies as well.
(3) The participants in this study were selected from people living in urban areas. Thus, it is also necessary to conduct similar studies in rural populations.
(4) Following the present study's findings, effective planning is needed to improve sleep quality and reduce sleep problems among young people.
