1. Background
Cancer is a chronic disease that plagues all human societies (1). Acute lymphoblastic leukemia is most prevalent around the age of four years and accounts for one of the leading causes of death under the age of 15 years. About 15% of people under 15 have this disease (2). Patients with advanced cancer currently receive chemotherapy as their primary treatment option, but resistance to chemotherapy (intrinsic and acquired) is the most common problem, which limits its effectiveness (3).
Programmed cell death protein 1 (PD-1) is a membrane protein of T and B lymphocytes, natural killer cells (NK), and monocytes (4). Preventing the interaction of PD-1 and Programmed death ligand-1 (PD-L1) in cancer cells causes apoptosis and cell cycle arrest. Thus, developing inhibitors of such interaction is one of the most critical advances in treating advanced malignancies (4, 5). Metabolites like glutamine, fatty acids, sugars, and amino acids fortify and support the growth of cancer cells and are used as raw materials in the reactions of hexosamine (HBP) production (6). Glutamine-fructose amidotransferase (GFAT1), which is the rate-limiting enzyme in the HBP pathway, produces uridine diphosphate N-acetylglucosamine (UDP-GlcNAc) from glutamine and fructose-6-phosphate. GlcNAc is a key substrate for O and N glycosylation, stabilizing protein structures (7), and its role in many vital cellular facets, including cell transformation, is now accepted (8, 9).
Studies have shown the effect of Metformin in inhibiting cancer cells (10). Ramos Penafiel et al. reported that people with ALL who took metformin concomitantly with chemotherapy experienced fewer relapses than others (11). Cancer mortality rates have also been shown to be lower in metformin users (12).
Various anticancer effects of Orlistat have been reported in studies, including inhibiting the fatty acid synthesis complex, increasing AMPK activity and production of reactive oxygen species, inhibiting cell proliferation, and inducing apoptosis (13) in various cell lines, including pancreas (14), prostate (15), ovary (16) and endometrium (13).
The monosaccharide D-mannose has been combined with chemotherapy drugs to increase cell mortality and enhance the innate pathway of apoptosis. For instance, Gonzalez et al. investigated the effects of cisplatin and doxorubicin along with mannose on cancer cell lines and mice and found that their combination significantly reduced cell growth and strengthened the apoptotic pathway via affecting the levels of anti-apoptotic proteins of the Bcl-2 family, reducing Bcl XL and Mcl-1, led to susceptibility to cell death (17). In addition, patients with high serum levels of D-mannose have shown better survival than patients with low levels of D-mannose (18).
2. Objectives
In this study, the effect of Metformin, Orlistat, Mannose, mannose-metformin, and mannose-orlistat combination on apoptosis and survival of the Nalm-6 cell line were addressed, which have not been investigated in other studies. This effect was also examined on the expression of PD-1 and GFAT1 genes, the products of which support the survival of cancer cells and play a significant role in the occurrence of drug resistance.
3. Methods
3.1. Cell Culture
The Nalm-6 cell line was obtained from the Cell Bank of Pasteur Institute (Iran) and maintained in RPMI1640 (Gibco, USA) added with 10% Fetal bovine serum (FBS) (Gibco, USA), 1% penicillin-streptomycin and L-glutamine (Sigma, USA) and incubated in an incubator with moistened environment at 37°C and 5% CO2.
D-Mannose powder (Merck) was solubilized in ethanol 96% (Merck, Germany). Orlistat powder (Karen, Iran) was solubilized in dimethyl sulfoxide (DMSO), and Metformin (Chemidarou, Iran) was prepared in phosphate-buffered saline (PBS) and passed through a filter with a pore size of 0.22 µm. The required dilutions were prepared using RPMI culture medium and kept at -20°C.
3.2. Cell Viability Test
3-(4,5-dimethylthiazol-2-yl) -2,5- diphenyltetrazolium bromide (MTT) (Sigma, USA) was used in the conventional method to evaluate the effect of the studied materials on cell death. Thus, 1 × 10⁶ cells were cultured in a 96-well plate and exposed to diverse amounts of metformin (50 - 200 mM), mannose (50 - 800 mM), orlistat (20 - 80 µM), and their combination. After 48 hours of exposure, 20µl of MTT solution (5 mg/mL) was added and incubated for another 4 hours. The plate was then centrifuged, and the surface was drained using a sampler. Next, DMSO was added to the wells in 100 µL, and their absorbance was recorded at 570 nm.
3.3. The Combination Index (CI)
CompuSyn software was used according to the Chou–Talalay approach to detect the presence or absence of a synergistic effect between mannose and metformin or mannose and orlistat (19) and to calculate the combined CI index. Accordingly, synergism was considered CI < 1.0 and antagonism CI > 1.0. A synergistic dose at fa = 0.5 was used to continue the experiments.
3.4. 4′,6-diamidino-2-phenylindole (DAPI) Staining
Treatment with 5% DMSO was considered a positive control. Based on a preceding description, calm-6 cells were implanted at 1 × 10⁵ cells in each well in a 96-well plate (20). The cells were then cultured for 48h with IC50 drug concentrations (orlistat 33.49 µM, metformin 28.06 mM, doxorubicin 114.4 nM, mannose 460.1 mM). All contents of each cell were collected in a sterile Falcon and centrifuged at 1500 rpm for 10 minutes. The surface was carefully and quickly eliminated. In the following steps, 1000 µL Paraformaldehyde (PFA) (4%) and 300 µL Triton X-100 (1%) were added. Then, 20 μL of DAPI dye was added to the precipitate in the dark. Finally, 20μl of the stained cell was placed on a slide and covered with a slide. The morphology of the cell nucleus and the changes resulting from the treatment were examined in a fluorescence microscope (carl Zeiss, Jena, Germany).
Normal and damaged cells were counted randomly from the corner of the slide. About 20 photos were taken by fluorescence microscope from each group. Then, the mean cell death in each group was calculated using Excel. Finally, the difference between the groups was assessed via a one-way analysis of variance and the Tukey test.
3.5. Gene Expression Analysis
3.5.1. RNA Extraction
RNA extraction from the treated (48 h) cells (5 × 10⁵) was achieved by the RNX- Plus kit (SinaClon BioScience, Iran) based on the procedure in the kit. The absorption ratio of 260 to 280 nm read by the nanodrop device (BioTek BOX 998, U.S.A) was calculated to determine the purity and quantity of RNA obtained.
3.5.2. cDNA Synthesis
The cDNA was synthesized by cDNA synthesise kit (Yekta Tajhiz, Iran), which was consistent with the producer’s instructions.
Real-time PCR was performed based on the SYBER green mode and using reagents provided by Yekta Tajhiz, Iran. All experiments were accomplished in duplicate. Here, β-actin was adopted as the housekeeping gene. Glutamine--fructose-6-phosphate transaminase (GFAT1) Accession: NM_001244710.2, Programmed cell death 1 (PD-1) NM_005018.3, and the corresponding sequence for β-actin were reached from NCBI (National Center for Biotechnology Information). Gene runner package (version 6.0) was utilized to achieve primers (Table 1). Lastly, planned primers were blasted against NCBI to confirm their validity.
| Primer | Nucleotide Sequence | mRNA Length |
|---|---|---|
| β-actin | Forward: 5’-CCTCCTGAGCGCAAGTAC-3’ | 87 |
| Reverse: 5’-CTGCTTGCTGATCCACATC-3’ | ||
| GFAT1 | Forward: 5’-AGGGTGATGTGAATGGATAGATG-3’ | 116 |
| Reverse: 5’-CTGGTGTAGAAGAAGAGAGAGG-3’ | ||
| PD-1 | Forward: 5’-ACGAGGGACAATAGGAGCCA-3’ | 150 |
| Reverse: 5’-GGCATACTCCGTCTGCTCAG-3’ |
The Sequence of Primers for GFAT1, PD-1, and β-Actin Used in Real-time PCR
3.6. Statistics
Statistical analyses were conducted with the GraphPad Prism software program (version 8). ANOVA and Tukey's tests compared the differences between exposed and control groups.
4. Results
4.1. Cell Viability Assay
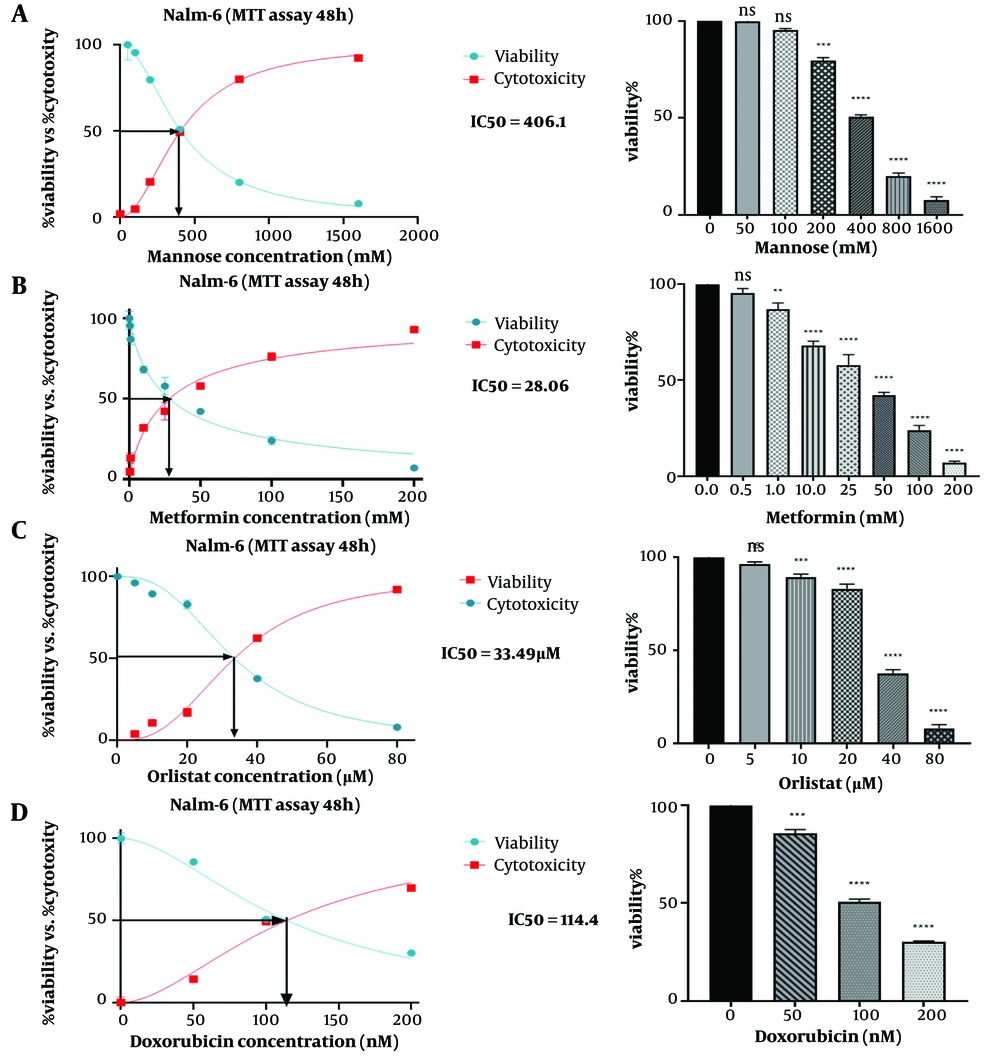
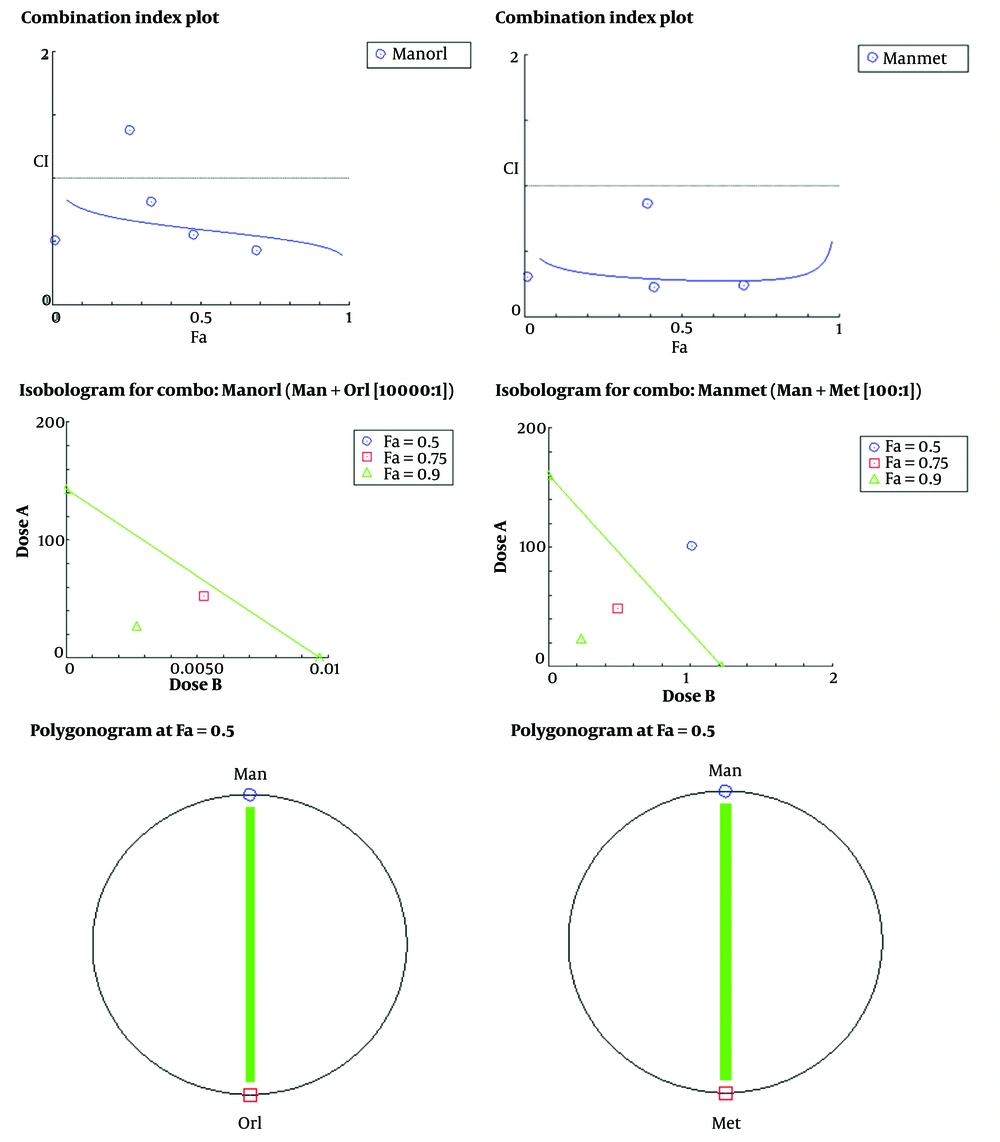
Nalm-6 cell viability was evaluated using the MTT test. Different concentrations of drugs metformin (0.05, 1, 10, 20, 50, 100, and 200 mM), orlistat (0, 5, 10, 20, 40, 80 μM), mannose (0, 50, 100, 200, 400, 800 mM), and doxorubicin (0, 50, 100, 200 nM) were used as separate treatments. The dose-response curve was plotted, and the concentration used in the following experiments was selected. In this study, untreated cells were considered negative controls, and doxorubicin-treated cells were considered positive controls. According to the presented graphs (Figure 1), the examined compounds meaningfully reduced the proliferation rate of the studied cell line, so this effect was related to the concentration of the tested substance (P ≤ 0.05). Finally, the IC50 dose of the drugs was calculated. The results showed that IC50 was 28.06 (mM) for metformin, 33.49 (µM) for orlistat, 406.1 (mM) for mannose, and 114.4 (nM) for doxorubicin (Figure 1). According to the results obtained in the MTT test for orlistat, mannose and metformin, the amounts of (50, 100, 200, 400, 800 mM) of mannose, (5 × 10⁻³, 1 × 10⁻², 2 × 10⁻², 4 × 10⁻², 8 × 10⁻² mM) of orlistat, (0.5, 1, 4, 10 mM) of metformin and (50, 100, 400, 1000 mM) of mannose were chosen to evaluate their combined effect. The results of this investigation for the combination of orlistat-mannose and metformin-mannose are indicated in a combination index plot, polygonogram, and isobologram (Figure 2).
The synergistic effect of mannose compounds (Man + Met and Man + Orl) on inhibiting the growth of the Nalm-6 cell line. The Combination Index (CI) was determined via an isobologram test based on the Chou-Talalay approach. Combination Index < 1, synergistic effect; CI = 1, additive effect; CI > 1, antagonistic effect. Data depicted are after three independent trials. The green line in the polygonogram shows the effect of synergy at the combined concentration of Fa = 0.5. Man, Mannose; Orl, orlistat; Met, metformin.
4.2. Drugs Prompted DNA Damage in Nalm-6 Cells
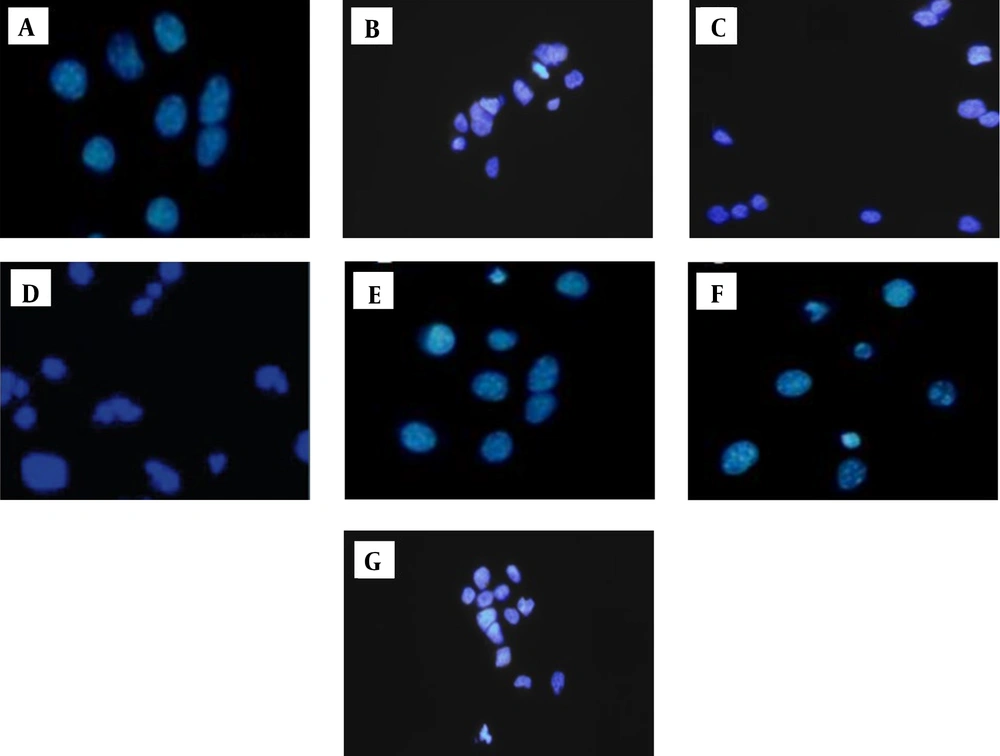
The cells stained with DAPI and DNA damage were evaluated to confirm the apoptosis-inducing impact of drugs upon Nalm-6 cells. The results indicated that in contrast to untreated cells (control), drug-treated cells (metformin, orlistat, mannose, and also metformin-mannose and orlistat-mannose combinations) experienced DNA damage as evident from the greater density of white color nuclei, membrane blebbing, and nuclear fragmentation (Figure 3).
4.3. Glutamine-Fructose Amidotransferase Expression
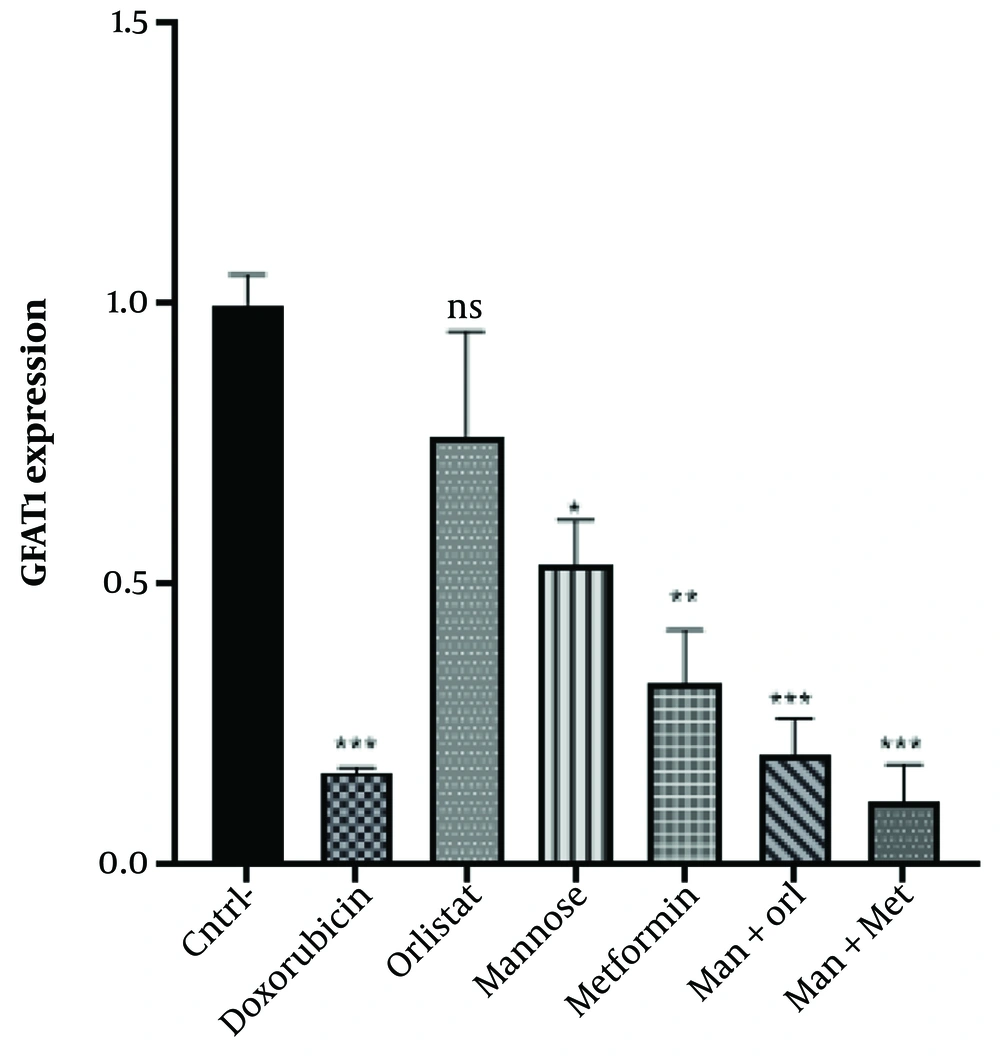
The results revealed a substantial decrease in GFAT1 transcript upon drug treatment (P < 0.001). Glutamine-fructose amidotransferase expression decreased in the treated groups compared to the untreated group (negative control). However, GFAT expression was higher in all groups except those treated with mannose + metformin than in the doxorubicin group (positive control). No remarkable difference was observed amid the positive control group and orlistat (P = 0.0694), metformin (P = 0.3068), mannose+metformin (P = 0.9770), and mannose+orlistat (P = 0.9988). However, a significant difference was shown in the group treated with mannose, with the positive control (P = 0.0079). In this regard, the most significant decrease in expression was observed in the mannose+metformin group (Figure 4).
Comparison of GFAT1 gene expression in the groups under study. The Mean ± SD of the findings is shown in the graph. One-way ANOVA and Tukey's multiple range post-hoc tests were used to evaluate the difference between groups. P-value < 0.05 has been used as the criterion of the significance of disagreements; ns, not significant. * P < 0.05, ** P < 0.01, *** P < 0.001. Asterisks indicate significant differences. cntrl, control; Man, mannose; Orl, orlistat; Met, metformin.
4.4. PD-1 Expression
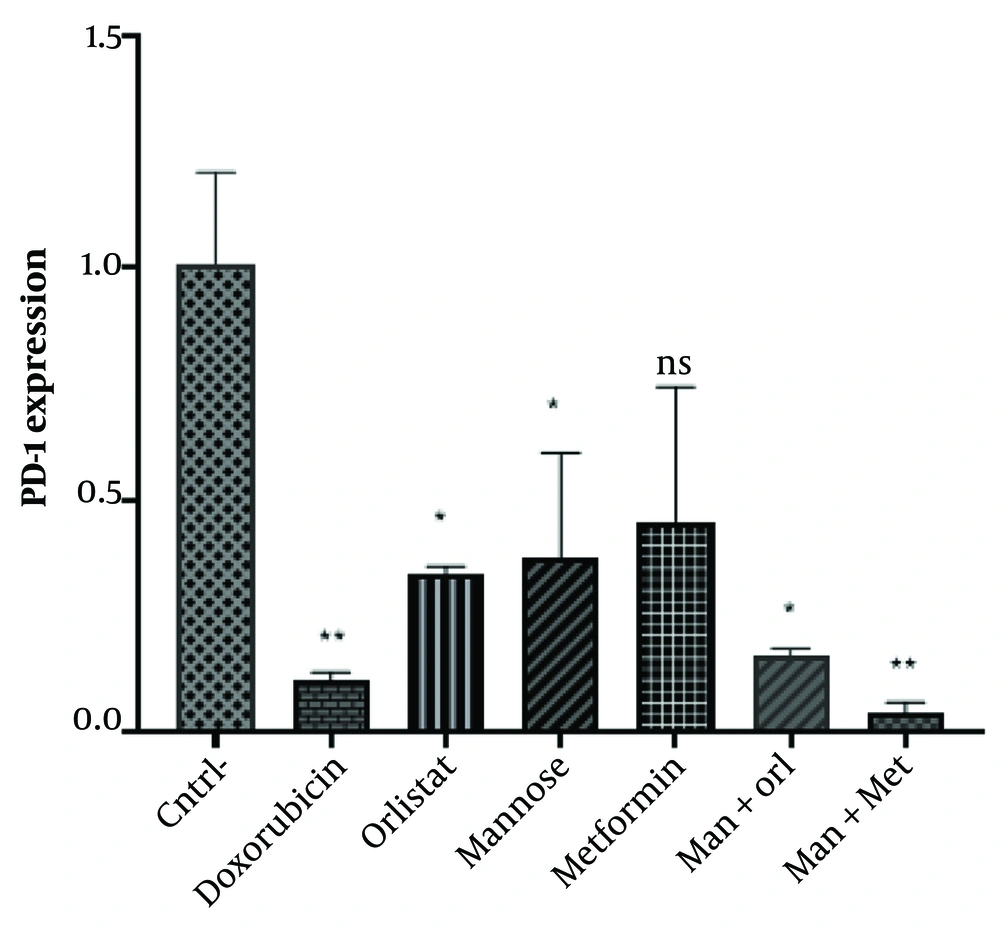
Analysis of gene expression by One-way ANOVA showed a significant difference between the negative control and the other five groups (except metformin) (P < 0.05). Continued use of the TUKEY post hoc test showed that administration of Doxorubicin (P = 0.0078), Mannose (P = 0.0476), Orlistat (P = 0.0368), Mannose-Orlistat (P = 0.0109) and Mannose-Metformin (0.0050) significantly decreased PD-1 expression in Nalm-6 cells; the relative expression of PD-1 gene in metformin group was 0.0854, which is not significantly different from control group.
The gene expression in the group exposed to the studied compounds decreased compared to the group that did not receive exposure. However, PD-1 expression was higher in all groups except the mannose-metformin group than the doxorubicin group (positive control). No remarkable discrepancy was observed amid the positive control groups of orlistat (P = 0.7658), mannose (P = 0.6527), metformin (P = 0.4112), mannose-metformin (P = 0.9988) and mannose-orlistat (P = 0.9998). The highest decrease was observed in the treated groups in the mannose-metformin group (Figure 5).
5. Discussion
The findings showed that treating the Nalm-6 cell line with mannose alone or in combination with metformin or orlistat decreased viability and induced apoptosis in a concentration-dependent manner. In addition, the expression of GFAT1 and PD-1 genes was reduced.
Recent research has shown the direct inhibitory effect of mannose on the growth of cancer cells both in the cell culture medium and in the oral intake of mannose (21). Treatment with mannose causes the accumulation of mannose-6-phosphate in the cell, which in turn inhibits glucose metabolism in glycolysis and the Krebs cycle, resulting in a decrease in energy production and inducing endoplasmic reticulum stress and apoptosis (17, 22).
Mannose alone or in combination with 5-fluorouracil (5-FU) inhibits cell growth in a dose-dependent manner in human colorectal cancer (CRC) cell lines and demonstrated a synergistic effect with 5-FU in all tested cancer cell lines. This study reported decreased dehydrogenase activity of the pentose phosphate pathway, oxidative stress enhancement, and DNA damage induction (23).
Mannose also reduces the production of NADPH by lowering the isocitrate dehydrogenase 2 (IDH2) level, inhibiting the proliferation of breast cancer cell lines and increasing their sensitivity to oxidant agents. This effect is attributed to the activation of AMPK and the subsequent increase in the expression of E3 ligase, which leads to the destruction of IDH2 (24). In addition, treatment with mannose leads to defects in glycosylation reactions with the accumulation of mannose 6-phosphate in the cell (17). Impaired protein glycosylation activated the ATF6 arm of the unfolded protein response (UPR) and subsequent reduction of fatty acid oxidation, accumulation of polyunsaturated fatty acids (PUFA), lipid peroxidation, and cell death through ferroptosis in treatment-resistant AML cells (25).
In this study, treatment with metformin alone or combined with mannose decreased the viability of the Nalm-6 cell line and decreased GFAT1 gene expression. In addition, metformin, in combination with mannose, decreased PD-1 gene expression.
The reuse of metformin as part of adjuvant therapy for treating several diseases, including various types of cancer, has been widely investigated (26). Evidence has shown that Slc5A9 carries out the entry of mannose into mammalian cells. The expression of Slc5a9 is induced by metformin (27, 28). The synergistic effect of metformin with mannose has been shown to correct the synthesis of lipid-linked oligosaccharides and N-glycosylation in Ia cells. This study concluded that AMP-dependent protein kinase may play a role in regulating mannose metabolism (28). Metformin treatment with cellular metabolic reprogramming inhibited tumor growth by inhibiting mitochondrial oxidative phosphorylation (OXPHOS) in an AMPK-dependent and AMPK-independent manner (26). The inhibitory effect of metformin on acute lymphoblastic leukemia cells is partially attributed to its inhibitory effect on the mTOR/Akt signaling pathway by AMPK (29). The study has shown that the activation of AMPK by 2-deoxyglucose, as a mannose analog, (30) with GFAT1 phosphorylation and its inactivation reduced protein N-glycosylation, induced endoplasmic reticulum stress and subsequently inhibited the growth of pancreatic cancer cells. This effect is synergistically enhanced by metformin through AMPK activation (22). Since exposure to mannose also activates AMPK (24), combining metformin with mannose is expected to strengthen each other's effect.
In this study, treatment with orlistat alone or combined with mannose decreased the viability of the Nalm-6 cell line and decreased PD-1 gene expression. In addition, Orlistat, in combination with mannose, reduced the expression of the GFAT1 gene.
An increasing number of studies in recent years have shown that orlistat has an antitumor effect on various cancer cells (31-33). Regarding mechanism, orlistat suppresses fatty acid synthase activity and thus reduces free fatty acid production (34), which also inhibits the activity of fatty acid-binding protein (FABP1) (35) and interferes with the tumor cell cycle and causes cell death by inducing apoptosis and ferroptosis (36).
Orlistat can reduce palmitoylation and activation of AKT and prevent liver tumorigenesis by limiting palmitic acid (PA) synthesis or suppressing AKT modification (37). Fatty acid synthase (FASN) is highly expressed in leukemic cancer, and its inhibition impairs angiogenesis (38, 39). Orlistat has been shown to decrease PDL-1 and PD-1 levels significantly, and the decrease in PDL-1 levels is associated with FASN inhibition (40).
In the present study, a decrease was observed in the expression of GFAT1. GFAT1 expression is often increased in cancer cells (41). Inhibiting the hexosamine pathway reduces the production of UDP-GlcNAc and glycosylation reactions. In this regard, inhibition of GFAT1 leads to endoplasmic reticulum-related apoptosis by disrupting protein N-glycosylation in pancreatic cancer cells (41). According to some studies, including a survey conducted on lung cancer cells, inhibition of GFAT1 decreases the stability of the PD-L1 protein (42).
In this study, a decrease was also observed in PD-1 gene expression. Programmed cell death protein 1 is an N-glycosylated protein, and the glycosylation process plays a role in determining its stability and expression on the surface of T lymphocytes and its interaction with the corresponding ligand, PD-L1. As lymphocytes and tumor cells activate, glycosylation pathways become more active (25). In this regard, 2-deoxy-D-glucose, as a mannose analogue, can inhibit the biosynthesis of N-glycosylated compounds in the pancreatic adenocarcinoma tumor model and strengthen immunotherapy (30). Overall, this study showed that treatment with mannose, metformin, and orlistat decreases cell survival, induces apoptosis in Nalam-6 cells, and decreases the expression of GFAT1 and PD-1 genes. In addition, combining mannose with metformin and mannose with orlistat synergistically inhibited cell growth.

