

1. Background
The human foot is the most specialized structure, which is combined with complex biomechanics to allow the functions of displacement and maintain balance as a critical element in the proper distribution of time over the musculoskeletal system, reflected in both static and dynamic conditions (1). Gait is a basic requirement for daily activities (1), which is considered to be the most universal and complex human activity (2). As such, gait has attracted the attention of numerous researchers over the years, especially in the field of biomechanics.
The measurement of plantar pressure provides an indicator of ankle and foot function while walking and in other functional activities since the foot and ankle provide the support and flexibility required to tolerate and transfer weight during various activities and physical exercise (3-5). Although the data on plantar pressure are recognized as an inherent element in the assessment of individuals with diabetes and peripheral neuropathy, the information derived from plantar pressure data could also be helpful in determining and managing the impairments associated with various musculoskeletal, integumentary, and neurological disorders (6). Furthermore, the examination of the plantar pressure while walking plays a key role in the anticipation, depiction, treatment, and correction of the problems associated with discomfort in the foot region, which may progress into abnormalities in the sole of the feet in the future (6).
Several studies have demonstrated the effects of various sports activities on the foot architecture and structure (1), as well as the effects of the patterns of plantar pressure distribution in various athletes (7-11). For instance, Aydos (7) measured foot pressure in 27 Turkish national team wrestlers, reporting that the peak pressure values in the wrestlers were located below the thumb, second metatarsal bone, heel, third to fifth metatarsal bones, first metatarsal bone, and second toe, while the least pressure was detected in the midfoot and third to fifth toes. In another research, Zvonar et al. (11) compared the distribution of plantar pressure in karate performers exercising on soft (tatami) and hard floor (solid), and the obtained results indicated a difference in the formation of the longitudinal and transverse arch between the study groups. In addition, Lee and Hertel (10) evaluated the distribution of pressure in the hind foot, midfoot, and forefoot areas in the runners who had been injured during their sports activities, reporting a significant correlation between the injuries caused by overexertion and increased pressure in the heel region.
In another study, Uzun et al. (9) investigated the effects of soccer on the parameters of the contact surface and maximum force in the foot of female football players and non-athlete healthy females while walking. The findings of the mentioned study indicated significant differences in some parameters of plantar pressure distribution in some anatomical regions between the football players and non-athletes (12, 13). Accordingly, the contact area in the right foot (lateral heel and midfoot regions) and left foot (medial and lateral heel regions) was significantly different between the athletes and non-athletes (14). Furthermore, the maximum force in the right foot was significantly different between the athletes and the non-athletes in the lateral heel and midfoot regions, as well as the midfoot and forefoot (toe bones) regions and second to fourth fingers of the left foot (9).
According to the literature, plantar pressure patterns are associated with various structural and functional factors, as well as injuries in athletes. Among the structural factors, significant and positive correlations have been reported between the peak pressure, maximum force, contact area, and contact time with height and weight in wrestlers (except in the heel area) (8). In addition, the total peak pressure and weight while walking have been shown to be correlated (15), while a positive and non-significant correlation has also been denoted between the body mass and maximum plantar pressure in the lateral area (16) and medial front area of the foot (17). A positive association has also been reported between the velocity of gait and peak plantar pressure (12), as well as treadmill velocity and slopes with the peak plantar pressure at the heel, toe, and medial leg edges (14).
Weightlifting is a complex and explosive field, requiring athletes to force weight and pressure beyond their weight on the limbs (especially the sole), which is often twice as high as the body weight of the athlete (1). Due to the deviation of the center of gravity from its normal alignment during weight and barbell lifting, the maximum force and pressure on the foot shift toward the other side of the anatomical area, which is not in accordance with the normal pattern of the distribution of pressure and force on the sole. It is believed that the distribution pattern of plantar pressure in weightlifters differs from the patterns observed in the athletes of other sports and non-athlete, healthy individuals as mentioned in the previous studies in this regard. Therefore, it is of utmost importance to evaluate the pattern of plantar pressure distribution and determine the areas that are exposed to excessive pressure and force in order to design proper footwear and insole fitting these patterns, which could in turn prevent the damages caused by the excessive force and spot pressure on various areas of the foot.
There is a consensus regarding the impact of various sports on the foot architecture and structure, and it has been well established that different sports activities have different affect the foot structure and gait pattern (1, 7-11). Moreover previous findings have demonstrated variations in the role and morphology of the foot depending on the age, gender, race, occupation, and field and level of sports activities (1).
2. Objectives
The present study aimed to compare the peak pressure, maximum force, contact area, and contact time between the right and left foot in elite weightlifters.
3. Methods
This study was conducted on 12 elite weightlifters with the minimum seven years of weightlifting experience and mean age of 23.2 ± 2.26 years, mean weight of 95.27 ± 2.95 kilograms, and mean height of 178.4 ± 7.5 centimeters. Written informed consent was obtained from all the participants. According to the self-report questionnaire completed by the subjects, none of the athletes had structural abnormalities and history of surgery in the lower extremities and had experienced no injuries within the past six months.
The Emed platform (AT-2 Novel GmbH, Munich, Germany) was used to measure the plantar pressure, the reliability of which has been confirmed (18). To do so, the Emed platform was placed at the center of a corridor with the length of 10 meters, and the subjects were asked to walk along the corridor at a normal pace. If the subjects placed their foot in the center of the platform without changing their normal walking pattern, the repetition was recorded as successful. Three successful repetitions were required for each foot, based on which the mean value was obtained using the average of data.
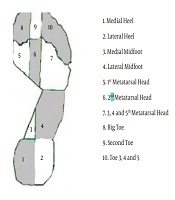
The AutoMask software was used to divide the sole of each foot into 10 anatomical regions (Figure 1), including M01 (medial heel), M02 (lateral heel), M03 (medial midfoot), M04 (lateral midfoot), M05 (first metatarsal head), M06 (second metatarsal head), M07 (third, fourth, and fifth metatarsal heads), M08 (big toe/thumb), M09 (second toe), and M10 (toes 3 - 5).

Position of anatomical regions of feet
The calculated parameters in each region using the MultiMask evaluation software included the peak pressure (kPa), maximum force (%BW), contact area (cm2), and contact time (ms). In addition, pressure (p) was defined as the force (f) per unit area or region (a) (i.e., P = f/a) (6). When measured using a force platform, the force was considered as the net result of the three components of the ground reaction or resultant force acting on the foot (6), with the area referring to the amount of the surface contact between the plantar surface of the foot and sensor (6).
3.1. Statistical Analysis
The obtained data were expressed as mean and standard deviation. Data normality was assessed using the Kolmogorov-Smirnov test, and paired t-test was applied to compare the parameters between the right and left foot in each anatomical region. Moreover, the correlations between the variables were determined using the Pearson’s correlation-coefficient at the significance level of P ≤ 0.05.
4. Results
Table 1 shows the descriptive data, including the mean values of the pressure distribution variables (peak pressure, maximum force, contact area, and contact time) of the right and left foot of the subjects. Accordingly, the maximum force in the right and left foot was highest in region seven (third, fourth, and fifth metatarsal heads), while the least maximum force was observed in the right foot in region nine (second toe) and left foot in region 10 (toes 3 - 5) (Table 1).
| Anatomical Area | Peak Pressure, kpa | Maximum Force, BW% | Contact Area, cm2 | Contact Time, ms |
|---|---|---|---|---|
| Mask 1 | ||||
| Right foot | 257 ± 55.28 | 29.97 ± 7.75 | 19.32 ± 3.09 | 555.27 ± 52.10 |
| Left foot | 281 ± 61.25 | 30.15 ± 5.33 | 19.16 ± 2.81 | 536.03 ± 63.20 |
| Mask 2 | ||||
| Right foot | 262.5 ± 45.27 | 26.03 ± 4.94 | 19.26 ± 3.15 | 557.17 ± 55.25 |
| Left foot | 279 ± 52.25 | 27.61 ± 6.23 | 19.1 ± 2.96 | 536.02 ± 63.18 |
| Mask 3 | ||||
| Right foot | 126 ± 36.08 | 3.6 ± 4.68 | 10.15 ± 7.60 | 519.02 ± 93.33 |
| Left foot | 139 ± 41.48 | 3.43 ± 4.07 | 9.07 ± 5.92 | 497.12 ± 80.53 |
| Mask 4 | ||||
| Right foot | 156 ± 55.65 | 22.08 ± 6.62 | 30.15 ± 6.87 | 645.75 ± 69.15 |
| Left foot | 165 ± 74.81 | 23.08 ± 9.52 | 31.07 ± 6.73 | 450.74 ± 53.75 |
| Mask 5 | ||||
| Right foot | 205 ± 56.45 | 16.44 ± 7.73 | 16.65 ± 4.03 | 693.18 ± 65.5 |
| Left foot | 214 ± 101.5 | 16.42 ± 7.13 | 16.87 ± 3.93 | 659.36 ± 61.72 |
| Mask 6 | ||||
| Right foot | 360 ± 100.95 | 24.35 ± 7.27 | 15.20 ± 4.16 | 732.16 ± 55.08 |
| Left foot | 369 ± 113.13 | 23.84 ± 4.63 | 15.18 ± 3.65 | 698.32 ± 51.09 |
| Mask 7 | ||||
| Right foot | 407 ± 183.06 | 45.63 ± 10.71 | 27.14 ± 2.09 | 745.62 ± 53.59 |
| Left foot | 362.5 ± 108.77 | 47.57 ± 16.91 | 28.00 ± 2.77 | 724.30 ± 43.71 |
| Mas 8 | ||||
| Right foot | 222 ± 114.08 | 13.94 ± 6.76 | 12.30 ± 2.59 | 602.18 ± 120.1 |
| Left foot | 244 ± 97.20 | 13.53 ± 3.19 | 11.81 ± 1.84 | 591.03 ± 102.49 |
| Mask 9 | ||||
| Right foot | 120.5 ± 66.39 | 2.19 ± 0.72 | 5.10 ± 1.19 | 519.11 ± 130.04 |
| Left foot | 129.5 ± 46.87 | 2.81 ± 0.58 | 5.34 ± 0.87 | 510.40 ± 66.9 |
| Mask 10 | ||||
| Right foot | 78.5 ± 30.73 | 2.52 ± 1.16 | 8.15 ± 2.18 | 562.8 ± 152.59 |
| Left foot | 84 ± 31.95 | 2.68 ± 1.30 | 8.1 ± 2.55 | 570 ± 100.2 |
Descriptive Data Including Mean and Standard Deviation of Peak Pressure, Relative Maximum Force, Contact Area and Contact Time in Right and Left Feeta
According to the obtained results, the peak pressure was highest in the left and right foot in region seven (third, fourth, and fifth metatarsal head), while the lowest value was observed in region 10 (toes 3 - 5) the (Table 1). On the other hand, the contact area was highest and lowest in the right and left foot in region four (lateral midfoot) and region nine (second toe), respectively (Table 1). Moreover, the highest contact time in the right and left foot was observed in region seven (third, fourth, and fifth metatarsal heads), while the lowest value was denoted in the right foot in region three (medial midfoot) and left foot in region four (lateral midfoot) (Table 1).
Table 2 shows the correlations between the pressure distribution variables with the height and weight of the athletes. Overall, a significant correlation was observed between the body weight and contact time in most of the anatomic regions in the feet, while a significant correlation was denoted between the body weight and maximum force in few of the anatomical regions. Furthermore, significant correlations were observed between the height, contact area, and contact time in the highest and lowest number of the anatomical regions (Table 2).
| Anatomical Area | Peak Pressure, kpa | Maximum Force, BW% | Contact Area, cm2 | Contact Time, ms | ||||
|---|---|---|---|---|---|---|---|---|
| Height | Weight | Height | Weight | Height | Weight | Height | Weight | |
| Mask 1 | ||||||||
| Right foot | 0.44 ± -0.119 | 0.29 ± -0.126 | 0.36 ± -0.123 | 0.21 ± -0.350 | 0.08 ± 0.776c | 0.0 ± 0.929c | 0.97 ± 0.553 | 0.06 ± 0.798c |
| Left foot | 0.05 ± -0.044 | 0.06 ± 0.187 | 0.18 ± -0.084 | 0.8 ± -0.102 | 0.06 ± 0.796c | 0.01 ± 0.879c | 0.06 ± 0.542 | 0.1 ± 0.763d |
| Mask 2 | ||||||||
| Right foot | 0.57 ± -0.020 | 0.12 ± -0.040 | 0.82 ± -0.311 | 0.94 ± -0.558 | 0.09 ± 0.769c | 0.01 ± 0.869c | 0.72 ± 0.592 | 0.02 ± 0.841c |
| Left foot | 0.54 ± -0.067 | 0.61 ± 0.159 | 0.00 ± -0.140 | 0.6 ± -0.111 | 0.07 ± 0.786c | 0.01 ± 0.878c | 0.06 ± 0.542 | 0.1 ± 0.763d |
| Mask 3 | ||||||||
| Right foot | 0.11 ± 0.535 | 0.14 ± 0.431 | 0.90 ± 0.306 | 0.18 ± 0.353 | 0.28 ± 0.419 | 0.16 ± 0.529 | 0.83 ± 0.574 | 0.10 ± 0.765c |
| Left foot | 0.40 ± 0.501 | 0.51 ± 0.489 | 0.00 ± 0.140 | 0.44 ± 0.219 | 0.82 ± 0.311 | 0.63 ± 0.478 | 0.81 ± 0.576 | 0.05 ± 0.8c |
| Mask 4 | ||||||||
| Right foot | 0.005 ± 0.806c | 0.06 ± 0.793c | 0.1 ± 0.768c | 0.97 ± 0.553 | 0.07 ± 0.768c | 0.12 ± 0.751d | 0.08 ± 0.539 | 0.34 ± 0.669d |
| Left foot | 0.37 ± 0.504 | 0.5 ± 0.331 | 0.85 ± 0.375 | 0.23 ± 0.129 | 0.24 ± 0.702d | 0.72 ± 0.592 | 0.48 ± 0.636d | 0.1 ± 0.765d |
| Mask 5 | ||||||||
| Right foot | 0.91 ± -0.305 | 0.34 ± 0.03 | 0.85 ± -0.571 | 0.93 ± -0.370 | 0.4 ± 0.221 | 0.06 ± 0.437 | 0.04 ± 0.090 | 0.66 ± 0.474 |
| Left foot | 0.95 ± -0.094 | 0.58 ± 0.396 | 0.37 ± -0.662d | 0.14 ± -0.235 | 0.89 ± 0.373 | 0.65 ± 0.602 | 0.51 ± 0.330 | 0.36 ± 0.665 |
| Mask 6 | ||||||||
| Right foot | 0.96 ± 0.302 | 0.46 ± 0.495 | 0.55 ± -0.021 | 0.34 ± 0.076 | 0.4 ± 0.654d | 0.1 ± 0.762d | 0.53 ± 0.114 | 0.21 ± 0.425 |
| Left foot | 0.98 ± 0.444 | 0.33 ± 0.674d | 0.13 ± 0.356 | 0.34 ± 0.671d | 0.05 ± 0.809c | 0.04 ± 0.810c | 0.05 ± 0.543 | 0.03 ± 0.825 |
| Mask 7 | ||||||||
| Right foot | 0.11 ± 0.761d | 0.0 ± 0.967c | 0.7 ± 0.319 | 0.82 ± 0.252 | 0.8 ± 0.460 | 0.38 ± 0.660d | 0.15 ± 0.182 | 0.81 ± 0.460 |
| Left foot | 0.83 ± 0.459 | 0.63 ± 0.607 | 0.7 ± 0.155 | 0.84 ± -0.1 | 0.75 ± 0.203 | 0.2 ± 0.351 | 0.96 ± 0.446 | 0.10 ± 0.762d |
| Mas 8 | ||||||||
| Right foot | 0.71 ± -0.059 | 0.35 ± -0.507 | 0.61 ± -0.064 | 0.77 ± -0.583 | 0.01 ± 0.882c | 0.25 ± 0.518 | 0.21 ± 0.350 | 0.91 ± 0.371 |
| Left foot | 0.82 ± 0.101 | 0.1 ± 0.237 | 0.33 ± -0.173 | 0.80 ± -0.379 | 0.10 ± 0.764d | 0.73 ± 0.589 | 0.49 ± 0.165 | 0.90 ± 0.372 |
| Mask 9 | ||||||||
| Right foot | 0.62 ± 0.478 | 0.02 ± 0.847c | 0.70 ± 0.106 | 0.18 ± 0.084 | 0.62 ± 0.393 | 0.06 ± 0.798c | 0.92 ± 0.144 | 0.01 ± 0.548 |
| Left foot | 0.70 ± 0.471 | 0.01 ± 0.870c | 0.04 ± -0.297 | 0.02 ± -0.241 | 0.92 ± -0.05 | 0.21 ± 0.179 | 0.86 ± 0.052 | 0.17 ± 0.181 |
| Mask 10 | ||||||||
| Right foot | 0.57 ± 0.212 | 0.66 ± 0.474 | 0.03 ± 0.363 | 0.18 ± 0.289 | 0.55 ± 0.622 | 0.40 ± 0.654d | 0.22 ± 0.082 | 0.98 ± 0.552 |
| Left foot | 0.48 ± 0.637d | 0.01 ± 0.765c | 0.28 ± -0.033 | 0.87 ± 0.146 | 0.50 ± 0.402 | 0.72 ± 0.591 | 0.06 ± 0.437 | 0.88 ± 0.454 |
Pearson Correlation Coefficient Between Height and Weight with Peak Pressure, Maximum Force, Contact Area and Contact Time in the Right and Left Feet of the Subjectsa
Table 3 shows the comparison of peak pressure, maximum force, contact area, and contact time between the right and left foot of the athletes. Accordingly, the right and left foot had a significant difference in terms of the maximum force in region nine (second toe), as well as the maximum pressure in region three (medial midfoot) (Table 3). However, no significant differences were observed between the right and left foot in terms of the contact area and contact time in the anatomical regions of the sole (Table 3).
| Anatomical Area | Peak Pressure, kpa | Maximum Force, BW% | Contact Area, cm2 | Contact Time, ms | ||||
|---|---|---|---|---|---|---|---|---|
| T | Sig (2-taild) | T | Sig (2-taild) | T | Sig (2-taild) | T | Sig (2-taild) | |
| Mask 1 | -2.03 | 0.55 | -0.41 | 0.91 | 0.18 | 0.52 | 1.99 | 0.00 |
| Mask 2 | 1.03 | 0.23 | -1.56 | 0.77 | 0.17 | 0.92 | -1.60 | 0.39 |
| Mask 3 | -2.48 | 0.23a | 0.76 | 0.79 | -1.10 | 0.23 | 1.20 | 0.53 |
| Mask 4 | 0.44 | 0.68 | -0.69 | 0.58 | -1.21 | 0.91 | -0.79 | 0.53 |
| Mask 5 | -0.02 | 0.70 | 0.18 | 0.86 | 0.44 | 0.67 | 2.20 | 0.63 |
| Mask 6 | 0.34 | 0.75 | 0.81 | 0.85 | 0.31 | 0.76 | -2.26 | 0.53 |
| Mask 7 | 0.99 | 0.44 | -0.11 | 0.56 | 1.31 | 0.87 | 1.78 | 0.49 |
| Mask 8 | 0.78 | 0.77 | 0.08 | 0.65 | 1.21 | 0.34 | -0.04 | 0.96 |
| Mask 9 | -0.57 | 0.28 | 2.78 | 0.35a | 0.93 | 0.06 | 0.88 | 0.80 |
| Mask 10 | 0.33 | 0.07 | 0.25 | 0.81 | -0.70 | 0.93 | 0.69 | 0.70 |
The Results of t-test Between the Right and Left Feet of the Subjects in the Variables of Peak Pressure, Maximum Force, Contact Area and Contact Time
5. Discussion
The present study aimed to compare the peak pressure, maximum force, contact area, and contact time between the right and left foot of elite weightlifters. The previous studies have demonstrated the preference of the dynamic state versus the static state using plantar pressure measurement devices (8, 19, 20).
The findings of the current research indicated significant differences between the right and left foot in terms of the maximum force in region nine (second toe) and peak pressure in region three (medial midfoot), the values of which were higher in the left foot compared to the right foot. Since we could not find a similar study conducted on weightlifters to compare the results, we referred to similar studies focused on other sports fields. In the present study, the pattern of maximum force in the right and left foot was the same, with the highest force observed in the thumb compared to the other toes. On the other hand, the pattern of maximum force increased in the forefoot, midfoot, and heel regions from the inside to the outside, and the change was considered significant in the metatarsal bones. In addition, the highest maximum force was denoted in region seven (third, fourth, and fifth metatarsal heads), while the lowest force value was in toes 2 - 5.
According to the current research, the pattern of pressure distribution in the right and left foot of the subjects was identical, so that the highest pressure was applied to the third to fifth metatarsal bones in both feet, and the lowest amount was observed in toes 3 - 5. In the studies by Memar and Noori (8) and Aydos (7) on wrestlers, the lowest pressure was reported on toes 3 - 5, which is consistent with the current research. On the other hand, the studies conducted on non-athletic healthy individuals have reported the lowest pressure on the midfoot and the highest pressure on the thumb (21), while some findings have also indicated the highest pressure to be on the heels (22), which is inconsistent with our findings. This discrepancy could be due to the effects of physical exercise on the pattern of gait in athletes, which in turn affects the pattern of plantar pressure distribution as well. Moreover, other studies have demonstrated significant differences between elite athletes and healthy non-athletes (beginners) in terms of the factors associated with the plantar pressure distribution pattern (9, 23).
According to the results of the present study, the pattern of pressure increase was mainly in the midfoot, as well as the metatarsal bones from the inside to the outside. In the heel region, almost the same pressure was applied to the medial and lateral regions. As for the toes, the thumb, second toe, and toes 3 - 5 tolerated the highest pressure, respectively. This is in line with the findings of Memar and Noori (8) and Aydos (7). In the current research, the highest and lowest contact area was observed in the midfoot and second toe, respectively. Furthermore, the contact area in the medial heel was higher compared to the lateral heel, and a significant increase was observed in the lateral midfoot relative to the medial midfoot. In the metatarsal bone region, the second and first metatarsals showed the highest contact area, followed by the third to fifth metatarsal bones. The contact area was also highest in the thumb, toes 3 - 5, and at the end of the second toe.
Contact time is an important parameter to indicate different walking conditions and foot problems (24). According to the results of the present study, the contact time was highest in the region of the third to fifth metatarsal bones, while the lowest value was observed in the medial midfoot of the right foot and lateral midfoot of the left foot. The higher contact time in the forefoot could be attributed to the higher flexibility of the medial longitudinal arch, as well as the weakness of the ligaments in this region (25) due to the degree of flatfoot present in all athletes to some extent. On the other hand, the low contact time in the midfoot could be due to the rapid passage of the body weight after the heel from the midfoot (regions three and four) to the forefoot (metatarsal bones) (26, 27).
In some sports, feet may not have the same function, and there might be no dominant and non-dominant foot in performing the skills of a particular sport. As a result, the differences in the pattern of the plantar pressure distribution between the dominant and non-dominant foot is quite expected. In this regard, Wong et al. (28) evaluated the distribution of the plantar pressure between the dominant and non-dominant foot of soccer players in exclusive moves, and the results indicated a difference in the distribution of the pressure between the dominant and non-dominant limbs. On the other hand, Memar and Noori (8) compared the right and left food patterns of plantar pressure distribution in elite wrestlers, reporting a significant difference only in the contact area of the lateral midfoot between the right and left foot, while the maximum force, peak pressure, and contact time had no significant differences. In the present study, the feet showed very close patterns in terms of the distribution of the maximum force, peak pressure, contact area, and contact time in the right and left foot, which could be due to the lack of a dominant foot and identical movement pattern of the feet in wrestling.
In the current research, we also investigate the correlations between the maximum force, peak pressure, contact area, and contact time with the height and weight of the athletes, observing positive, significant correlations between height and weight with the peak pressure, maximum force, contact area, and contact time in right and left foot; only the maximum force had an inverse association with height in region four (lateral midfoot). These findings are consistent with the studies by Memar and Noori (8) and Aydos (7) in wrestlers. In addition, Uzun et al. (9) compared female soccer players and non-athlete healthy females, reporting positive, significant associations between height, weight, and contact area. Similarly, Hennig and Milani (16) and Snow et al. (17) denoted a positive correlation between the body weight and peak pressure in the lateral region of the foot and medial forefoot, which is consistent with the findings of the current research.
5.1. Conclusions
According to the results, feet have the same function and pattern of motion in weightlifting, which leads to the emergence of the same pattern of force and pressure distribution on the plantar of both the right and left foot. The pattern obtained in the present differed from the pattern observed in non-athlete healthy subjects, as well as the studies focused on other sports, which confirms the effects of various sports activities on the pattern of plantar pressure distribution. Since clinical evaluation is one of the goals of measuring the distribution of plantar pressure, it is recommended that insoles designers pay special attention to the reduction of the point load under the third to fifth metatarsal bones in the design of shoes for weightlifters in order to prevent complications such as metatarsalgia and other complications associated with increased point pressure on the plantar of foot in the long run.
