


1. Background
The elderly constitute a substantial proportion of the global population, with over 20% expected to be over 65 by 2030 (1). About one-third of older adults fall annually, costing over $34 billion (2, 3). Declines in neuromuscular function, balance, strength, vision, and cognition increase fall risk (4). Mental fatigue — linked to mild cognitive impairment (5) — disrupts gait and posture via impaired neural control (6). It stems from prolonged mental effort and reduces energy, motivation, and cognitive capacity (7, 8). Early detection of mental fatigue may help reduce fall risk in the elderly (1).
Mental fatigue assessment employs three primary methods. First, questionnaires like the Psychomotor Vigilance Test (PVT), Visual Analog Scale (VAS), and Checklist Individual Strength (CIS) (9) are simple and cost-effective but rely on subjective responses and lack real-time monitoring. Second, behavioral detection methods analyze head position and eye-blink rates (10) via cameras, enabling real-time assessment but being sensitive to lighting. Third, physiological signal methods — EEG, EOG, EMG, ECG, and BPM (11, 12) — measure bioelectric activity (e.g., brain waves via EEG) for real-time detection but require specialized equipment (e.g., electrode caps), limiting practicality for continuous use. Gait analysis, detecting mental fatigue through kinematic changes (13), offers advantages: Remote assessment via video without body sensors. While 3D gait analysis needs specialized lab equipment and markers, identifying key gait components linked to mental fatigue could enable diagnosis using standard cameras combined with AI pose estimation tools like Open Pose and Open Cap, simplifying assessment while maintaining accuracy (14).
Given the important role of cognition in balance control and the negative impact of mental fatigue on cognitive ability, the high prevalence of mental fatigue may put individuals at risk of injuries resulting from loss of balance and falls. Therefore, sensitivity to the mental fatigue factor as an inherent risk factor for falls in the elderly and its identification are essential to provide effective interventions to reduce the likelihood of falls and subsequent injuries.
2. Objectives
This study employed laboratory gait analysis methods to identify key gait components in the elderly before and after mental fatigue (AMF), induced by clinically validated techniques. A machine learning-based model was utilized to explore the feasibility of diagnosing mental fatigue through motor signals, emphasizing the potential for simple and cost-effective approaches. The approach of the present study, provides the basis for the design of a mental fatigue warning system with available equipment and without too complex calculations to prevent one of the factors of falls in the elderly.
3. Methods
3.1. Subjects
A total of 30 elderly subjects (19 males and 11 females, 67.0 ± 4.3 years, mean weight 74.5 ± 17.7 kg, and mean height 168 ± 7.7 cm) were selected to participate in the study. The selected sample size is consistent with previous machine learning-based fatigue studies and was reinforced by intra-subject data augmentation to ensure model validity. To assess the cognitive status of elderly participants, the Mini-Mental State Examination (MMSE) was administered, with a maximum score of 30, where a score below 24 was considered indicative of cognitive impairment. The inclusion criteria for the study comprised individuals aged 60 - 75 years, a documented history of falls, and the ability to walk independently on a treadmill without assistive devices. Conversely, exclusion criteria included diagnosed orthopedic or neurological disorders, an MMSE score below 24, and a history of recent surgeries or injuries that could affect gait quality.
3.2. Procedure
Participants wore sports attire and initially acclimated to treadmill walking (HP Cosmos, Mercury Germany) until their gait resembled natural floor walking. Their preferred speed was determined by incrementally adjusting the treadmill speed (0.1 km/h every 5 seconds) until subjective comfort was reached (15). Spatiotemporal gait data were collected using a motion capture system (OptiTrack v120 Duo, USA; 120 Hz), with pelvic and heel markers tracking movement. After calibration, three one-minute gait trials were recorded at preferred speed with rest periods to minimize fatigue effects.
3.3. Mental Fatigue Protocol
To induce mental fatigue, participants performed a 60-minute Stroop test on a 27-inch computer monitor. During the test, they were shown color names printed in mismatched ink colors (e.g., the word 'red' displayed in blue) with stimuli changing every second. Participants were instructed to identify the color of displayed text while ignoring semantic word content. Baseline fatigue levels were assessed pre-test using an 18-item VAS evaluating fatigue and energy subscales (0 - 100), with post-test fatigue reassessed immediately afterward (16) While a score of 50/100 is widely adopted as the fatigue threshold in prior research (9), this study defined the cutoff at 70/100. If participants failed to meet this threshold, the Stroop task was extended iteratively in 10-minute increments until the criterion was achieved. If the fatigue threshold wasn’t met, the Stroop test was extended in 10-minute increments until the threshold was achieved. Following the intervention, pretest data collection procedures were repeated identically to evaluate the effects.
3.4. Data Analysis
The subjects' gait cycle was determined using the position of the two markers placed on the heels and their relationship to the pelvic position.
Spatiotemporal gait factors including stride length, stride width, cadence, step symmetry, stride time, double support time, stance phase percentage, and gait speed were extracted for each gait cycle. Also, the range, maximum, and minimum values, as well as the integral and derivative of the values in each of the 5 consecutive cycles were calculated (equation 1):
In these equations, χ and χ1-5 represent, respectively, the value of each spatiotemporal gait parameter in a single cycle and the average across five consecutive cycles. The terms Range, Max, and Min denote the range of variation, maximum, and minimum values across the five cycles, respectively. Additionally, Int refers to the integral (area under the curve) of the values over five cycles, and Diff indicates the derivative of that integral.
Given the importance of gait changes as an important indicator in studies related to falls (17), the variability of the spatiotemporal component was also calculated. For this purpose, the dispersion of the data of 5 consecutive gait cycles of individuals was obtained using equation 2:
In this Equation, xi xi represents each component and x ̃ represents the average of 5 consecutive cycles. Thus, a total of 56 initial components were extracted for input into the machine learning algorithm (Table 1).
| Variables | Mean | Var | Range | Max | Min | Int | Diff |
|---|---|---|---|---|---|---|---|
| Stride length (m) | 1 | 9 | 17 | 25 | 33 | 41 | 49 |
| Step width (m) | 2 | 10 | 18 | 26 | 34 | 42 | 50 |
| Cadence (step/min) | 3 | 11 | 19 | 27 | 35 | 43 | 51 |
| Step symmetry (%) | 4 | 12 | 20 | 28 | 36 | 44 | 52 |
| Double support time (s) | 5 | 13 | 21 | 29 | 37 | 45 | 53 |
| Stride time (s) | 6 | 14 | 22 | 30 | 38 | 46 | 54 |
| Speed (m/s) | 7 | 15 | 23 | 31 | 39 | 47 | 55 |
| Stance phase percent (%) | 8 | 16 | 24 | 32 | 40 | 48 | 56 |
Abbreviations: Var, variability; Range, range of variation; Max, maximum; Min, minimum; Int, integral; Diff, derivative of 5 consecutive cycles.
The study faced limited training data from 30 subjects, which was insufficient for robust machine learning model training. To address this, a moving average method was applied to augment the dataset. For each subject providing at least 10 consecutive 5-cycle gait data series, this technique expanded 30 original observations into 300 pre-fatigue and 300 post-fatigue data points. To develop a parsimonious mental fatigue detection model while preventing overfitting, the analysis distilled 3 key components from an initial set of 56 spatiotemporal gait parameters. The combinatorial formula
4. Results
Figure 1 shows the analysis of 27,720 ternary combinations of the 56 components considered as input to the machine learning model. As can be seen, the highest validation accuracy is achieved when the three components numbered 6, 33, and 40 are selected.

Validation of three input components of a machine learning model; the large circle indicates the best combination of 3 components.
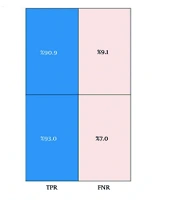
These three features included the average stride time, minimum stride length, and minimum stance phase percentage for 5 consecutive cycles, which was able to show an accuracy of 92% on the training data. Figure 2 shows the confusion matrix for validating the machine learning algorithm. As can be seen, 90.9% of the data labeled as BMF were correctly predicted, and 9.1% of the data were incorrectly labeled BMF. For AMF data, 93% of the predictions were correct, and 7% of the data were incorrectly labeled as AMF. These values demonstrate the algorithm's high accuracy and minimal error in detecting the presence or absence of mental fatigue in older adults, outperforming comparable studies in the field.

Confusion matrix for machine learning model validation
The results of the analysis of the test data, which included 15% of the total data that did not participate in the training phase, showed that using the three components of average stride time, minimum stride length, and minimum stance phase percentage was able to predict the presence or absence of mental fatigue with an accuracy of 92.2% (95% CI: 86.7% - 97.8%).
The present study proposes a method through which mental fatigue can be detected with desired accuracy from the gait pattern of elderly people. To validate the proposed method for selecting the best features for diagnosing mental fatigue, its accuracy was compared with three common feature selection methods: (1) Principal component analysis (PCA), (2) feature selection based on statistical methods (t-test), and (3) forward-backward feature selection. Table 2 shows the selected features and the accuracy of training and testing of these three conventional methods.
| Method | Selected Features | Training Accuracy (%) | Testing Accuracy (%) |
|---|---|---|---|
| PCA | First three components (80.2%, 15.5%, and 1.7% variance) | 78.4 | 73.3 |
| t-test statistical test | Mean, maximum, and Integral of cadence | 72.4 | 60.0 |
| Forward-backward feature selection | Average cadence, maximum gait speed, and integral of stride length | 87.6 | 82.2 |
| Current method | Average stride time, minimum stride length, and minimum stance phase percentage | 92 | 92.2 |
Abbreviation: PCA, principal component analysis.
To features selection, the method proposed in this study demonstrates several advantages over traditional techniques. Unlike PCA, which alters features and may overlook critical factors, the current approach examines all possible states without changing the features. It also accounts for the overlap and interactions between selected features, which is a limitation of the t-test method. Additionally, this method achieves higher classification accuracy compared to Forward-backward Feature Selection, with training and testing accuracies significantly surpassing those obtained through PCA and the t-test. Specifically, the current method is particularly effective for small datasets, allowing for the selection of principal components with a limited number of features. Overall, this study presents a robust alternative for accurately diagnosing mental fatigue, emphasizing the importance of considering feature interactions and maintaining component integrity
5. Discussion
This study aimed to identify key gait features in the elderly for detecting mental fatigue. Previous research has shown varied effects of cognitive load and mental fatigue on gait, influenced by task type, duration, and attentional allocation. The parallel information processing model (18) and perceptual narrowing perspective suggest that mental fatigue impairs dual-task performance by diverting attention from optimal task execution. Supporting this, van der Linden et al. (19) found that mental fatigue compromises focus, response preparation, and adaptive strategies. Conversely, the CRUNCH model (20) posits that older adults compensate for cognitive decline in moderately difficult tasks but struggle with highly demanding ones. Dubost et al. (21) reported reduced stride speed and increased variability under cognitive load in older adults, though their findings partially contrast with the current study’s results.
McAuley et al. (17) demonstrated that cognitive load impacts spatiotemporal gait parameters in older adults, linking reduced stride length and stride time to declines in perceptual attention and processing speed. They proposed that decreased stride length may serve as an early marker of cognitive load and elevated fall risk, preceding other neuropsychological and gait changes. These findings align with the present study, indirectly identifying stride length and stride time as mental fatigue indicators. Verlinden et al. (22) further noted that mental fatigue slows brain processing speed, manifesting in gait timing variables like cadence, stride time, and stance/swing phases. They highlighted that optimal movement speed depends on coordinated limb movements (e.g., stride width, double support), while executive functions govern stride length and gait speed. The current study builds on these insights by pinpointing three key diagnostic components of mental fatigue: Minimum stride length, average stride time, and minimum stance phase duration. These metrics reflect how mental fatigue alters processing speed and executive function in older adults — dual factors that collectively heighten fall risk.
This study proposes a practical method for detecting mental fatigue — a major fall risk factor in older adults — using three gait parameters measurable via a simple 2D camera over five gait cycles. Unlike subjective questionnaires or complex brain signal measurements (EEG/EOG), this approach offers an objective, low-cost solution suitable for non-laboratory environments.
While the study demonstrates promising accuracy, it has notable limitations, including a small sample size and a lack of overground walking data. To address these issues, data augmentation techniques were applied — such as transforming existing datasets, combining transformations, and generating synthetic data — alongside treadmill-based data collection after participant familiarization to simulate natural gait patterns. However, it is important to note that although treadmill acclimation aimed to approximate natural gait, inherent differences between treadmill and overground walking may still exist. Furthermore, the model’s performance in real-world environments remains untested, which limits the generalizability of the findings. These gaps underscore the need for cautious interpretation of the results and highlight critical directions for future research. Subsequent studies should prioritize validation against objective neural measures (e.g., EEG) to strengthen physiological correlations, comparative validation of gait parameters using affordable AI-based imaging systems versus gold-standard precision motion capture tools, and expanding sample sizes while employing advanced optimization algorithms to enhance the robustness of complex models. Despite these limitations, this work represents a meaningful advancement in developing accessible tools for monitoring elderly health, bridging technological innovation with practical clinical applications. Future validation in diverse, real-world settings will be essential to confirm its broader utility.
