


1. Background
Type 2 diabetes mellitus (T2DM) is a chronic illness that can be largely prevented and is one of the four primary non-communicable diseases (1). Diabetes is a widespread endocrine disorder and a major global health issue. According to the latest statistics, approximately 9.3% (463 million adults) were diagnosed with diabetes in 2019. The number of people with impaired glucose tolerance worldwide is projected to increase to 700 million (10.9%) by 2045 (2). In Iran, from 2014 to 2020, diabetes and pre-diabetes affected 15% and 25.4% of the population, respectively (3).
Excess obesity can lead to the development of hypertension, dyslipidemia, and diabetes (4). In the cardiovascular system, excess adipose tissue results in the release of free fatty acids from fats (5). Activation of the diacylglycerol-protein kinase C pathway may result in the accumulation of lipids in cells, which could lead to insulin resistance (6). Insulin resistance is a contributing factor to changes in lipid metabolism and the development of atherogenic dyslipidemia. Inhibition of microsomal triglyceride transfer protein and lipoprotein lipase activation in insulin resistance results in hypertriglyceridemia (7). Blood lipids, including cholesterol, triglycerides, and lipoproteins, are considered the most important indicators of metabolic control in diabetic patients (8). Android excess fat mass is associated with high triglyceride levels and low high-density lipoprotein cholesterol (HDL) in men, and high low-density lipoprotein cholesterol (LDL) and low HDL cholesterol levels in women. In men, there is a positive correlation between excess gynoid fat mass and total cholesterol (TC) and TG, and HDL cholesterol in women (9).
Anthropometry is a method of quantitatively measuring the physical characteristics of the body (10). Since the structural characteristics of the human body vary under the influence of factors such as age, gender, and type of nutrition, and since the data of each population is specific to that population, anthropometric databases have been established in advanced countries (11). Anthropometric information from each region can be used for diagnostic and treatment purposes for the same population (12).
Body Mass Index (BMI), waist circumference (WC), and waist-to-height ratio (WHtR) as anthropometric indicators are strongly linked to diabetes (13). New anthropometric indices have been developed to overcome the limitations of BMI. Body Shape Index (ABSI), Body Roundness Index (BRI), and Body Adiposity Index (BAI) are important factors for estimating body fat distribution (14, 15). One limitation of older anthropometric indices is that they cannot determine the amount of fat or differentiate between weight components (16). They also cannot distinguish visceral adipose tissue from subcutaneous adipose tissue because they measure BMI and WC (17). The risk of T2DM can be influenced by the location of fat accumulation in the body relative to the total body fat volume (18). Visceral adipose tissue is a hormonally active component of body fat, and the risk of developing diabetes is higher in people with this type of obesity, with or without visible obesity (19, 20).
There is also a strong significant relationship between liver enzymes, including alanine aminotransferase (ALT) and aspartate aminotransferase (AST), and BMI, blood serum lipids, lipoproteins, glucose, insulin, and blood pressure (21).
Considering the importance of diabetes and its relationship with anthropometric indicators, various studies have shown different predictive factors for diabetes across different races and countries, indicating that the cut-off points related to anthropometric indices vary for different ethnic groups (22, 23).
2. Objectives
This study aimed to identify the optimal cut-off values of anthropometric measures and their relationship with cardiometabolic and hepatic indices to predict T2DM in southwest Iran.
3. Methods
3.1. Research Design and Participants
This cross-sectional study analyzed data from the first phase of the Hoveyzeh Cohort Study, conducted from 2016 to 2018. The study selected adult males and females from Hoveyzeh city, focusing on a population-based sample from an Arab community in southwest Iran (24). To be eligible for this study, participants had to be between the ages of 35 and 70 and express a desire to take part. However, the study excluded pregnant or lactating women, individuals with diets under 800 kcal or over 4200 kcal, those with incomplete demographic, anthropometric, or biochemical information, individuals who had undergone surgery, lost weight in the past year following special diets, or were taking special medications, those with a BMI less than 18.5 kg/m² or more than 40 kg/m², and those who consume alcohol.
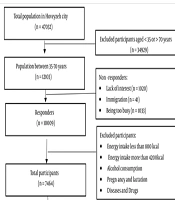
Figure 1 shows that 34,929 individuals were selected from a total of 47,032 people. After excluding individuals who lacked interest, were too busy, or had immigrated, the study included a total of 10,009 participants. Finally, the study included 7,300 participants (1,607 with T2DM and 5,693 healthy individuals).

Flow chart of participant selection
3.2. Anthropometric, Blood Pressure, and Heart Rate Assessment
Weight (measured with an accuracy of 0.1 kg) and height (measured with an accuracy of 0.1 cm) of participants were determined after an overnight fast using a standard scale (Seca). Waist circumference (WC) was measured using a constant tension tape at the end of a normal exhale, with the arms relaxed at the sides. The measurement was taken at the midpoint between the lower part of the lowest rib and the highest point of the hip on the mid-axillary line. BMI was estimated by dividing the weight (kg) by the height (m²).
Participants' systolic and diastolic blood pressure and heart rate (HR) were measured twice in a seated position using a Reister manometer cuff and stethoscope on both arms.
The following formulas were used to calculate the anthropometric indices (14, 15, 25):
AVI (Abdominal Volume Index) = (2 cm (waist)2 + 0.7 cm (waist-hip)2)/1000
BRI (Body Roundness Index): (364.2 - 365.5) × (1-[(WC/2π)2/ (0.5 × height)2] (1/2))
3.3. Biochemical Assessments
After fasting for 12 hours, a laboratory expert drew a 10 cc blood sample from the participants. The blood samples were centrifuged at 3000 rpm for 10 minutes to extract the serum. Venous blood samples were collected to assess mean corpuscular volume (MCV), fasting blood sugar (FBS), lipid profile, ALT, AST, gamma-glutamyl transferase (GGT), and alkaline phosphatase (ALP).
The following formulas were used to calculate the metabolic and hepatic indices:
VAI (Men) = (WC/ [39.68 + 1.89 × BMI]) × ([TG (mmol/L)]/1.03) × (1.31/ [HDL (mmol/L)])
VAI (Women) = (WC/ [36.58 + 1.89 × BMI]) × (TG/0.81) × (1.52/HDL)
HIS = 8 × (ALT/ [AST ratio]) + BMI (+2, if female; if diabetes mellitus)
ANI: ALD/NAFLD Index = -58.5 + 0.637 (MCV) + 3.91 (AST/ALT) -0.406 (BMI) + 6.35 for male gender
3.4. Statistical Methods
The data was analyzed using IBM SPSS Statistics software (Version 24) from IBM SPSS Statistics in Armonk, USA. The Kolmogorov-Smirnov test was used to assess the normality of the variables. Quantitative variables between the healthy and diabetic groups were compared using the Independent t-test or the Mann-Whitney test, while qualitative variables were compared using the chi-square test. Pearson's correlation coefficients were employed to assess the correlations among anthropometric, hepatic, and cardiometabolic indices.
A logistic regression test was conducted to evaluate the association between anthropometric, hepatic, and cardiometabolic indices and T2DM risk in both males and females, calculating the odds ratio (OR) and 95% confidence interval. Receiver-operating characteristic (ROC) analysis was used to determine the sensitivity, specificity, and area under the curve for anthropometric indices. A P-value of less than 0.05 was considered statistically significant.
4. Results
Table 1 presents the basic characteristics of the individuals who participated in the study. The patients with T2DM had a mean age of 53.14 years (SD = 9.25), while healthy participants had a mean age of 47.86 years (SD = 9.03). In diabetic individuals, the average weight, height, wrist measurement, systolic and diastolic blood pressure, MCV, ALT, GGT, TG, energy intake, and physical activity were higher in men compared to women. Conversely, diabetic women had higher average BMI, WC, hip circumference (HC), HR, TC, HDL, LDL, and ALP levels than diabetic men. Except for height, HDL, MCV, AST, physical activity, and energy intake, all parameters were higher in individuals with T2DM compared to healthy participants, as shown in Table 1.
| Characteristics | T2DM | P a | Healthy | P b | P c | ||||
|---|---|---|---|---|---|---|---|---|---|
| Total (N = 1607) | Male (n = 620) | Female (n = 987) | Total (N = 5693) | Male (n = 2219) | Female (n = 3474) | ||||
| Age (y) | 53.14±8.96 | 53.30±8.94 | 53.04±8.97 | 0.574 | 47.86 ± 9.03 | 48.72 ± 9.27 | 47.31 ± 8.83 | < 0.001 | < 0.001 |
| Weight (cm) | 77.89 ± 13.26 | 82.72 ± 13.12 | 74.85 ± 12.43 | < 0.001 | 76.64 ± 14.21 | 81.19 ± 14.07 | 73.74 ± 13.53 | < 0.001 | 0.002 |
| Height (cm) | 163.49 ± 8.74 | 171.96 ± 5.85 | 158.17 ± 5.45 | < 0.001 | 164.42 ± 9.05 | 172.92 ± 6.33 | 158.99 ± 5.73 | < 0.001 | < 0.001 |
| Body Mass Index (kg/m2) | 29.12 ± 4.40 | 27.93 ± 3.97 | 29.87 ± 4.49 | < 0.001 | 28.34 ± 4.75 | 27.11 ± 4.27 | 29.12 ± 4.87 | < 0.001 | < 0.001 |
| WC (cm) | 102.14 ± 10.48 | 99.45 ± 10.23 | 103.82 ± 10.28 | < 0.001 | 98.25 ± 11.13 | 96.00 ± 10.75 | 99.70 ± 11.12 | < 0.001 | < 0.001 |
| Wrist (cm) | 17.48 ± 1.28 | 17.91 ± 1.15 | 17.21 ± 1.28 | < 0.001 | 17.35 ± 1.27 | 17.81 ± 1.18 | 17.06 ± 1.23 | < 0.001 | < 0.001 |
| HC (cm) | 103.20 ± 9.04 | 100.51 ± 7.85 | 104.89 ± 9.34 | < 0.001 | 103.66 ± 9.07 | 100.46 ± 7.88 | 105.70 ± 9.20 | < 0.001 | 0.073 |
| BP systolic | 117.90 ± 20.01 | 120.67 ± 18.66 | 116.17 ± 20.64 | < 0.001 | 111.63 ± 17.60 | 115.30 ± 16.99 | 109.29 ± 17.59 | < 0.001 | < 0.001 |
| BP diastolic | 73.09 ± 11.25 | 74.91 ± 11.19 | 71.95 ± 11.15 | < 0.001 | 70.80 ± 11.06 | 72.94 ± 11.06 | 69.43 ± 10.83 | < 0.001 | < 0.001 |
| Heart rate (n) | 80.22 ± 9.86 | 79.14 ± 9.33 | 80.89 ± 10.13 | < 0.001 | 78.12 ± 9.45 | 76.42 ± 9.32 | 79.21 ± 9.37 | < 0.001 | < 0.001 |
| TC (mg/dL) | 193.82 ± 47.781 | 187.41 ± 45.55 | 197.84 ± 48.73 | < 0.001 | 187.57 ± 38.10 | 185.77 ± 37.57 | 188.72 ± 38.39 | 0.004 | < 0.001 |
| TG (mg/dL) | 195.26 ± 143.19 | 204.51 ± 148.06 | 189.44 ± 139.81 | 0.04 | 152.88 ± 91.20 | 173.30 ± 108.71 | 139.84 ± 75.15 | < 0.001 | < 0.001 |
| HDL (mg/dL) | 49.37 ± 11.75 | 45.20 ± 9.74 | 51.99 ± 12.14 | < 0.001 | 50.33 ± 11.87 | 45.95 ± 10.36 | 53.12 ± 11.93 | < 0.001 | 0.004 |
| LDL (mg/dL) | 106.22 ± 36.62 | 102.45 ± 34.01 | 108.57 ± 37.99 | 0.001 | 106.80 ± 32.00 | 105.42 ± 31.60 | 107.68 ± 33.22 | 0.01 | 0.534 |
| FBS (mg/dL) | 178.93 ± 72.11 | 182.02 ± 69.98 | 176.98 ± 73.38 | 0.173 | 93.84 ± 10.24 | 93.58 ± 9.96 | 94.01 ± 10.41 | 0.125 | < 0.001 |
| ALT (U/L) | 21.82 ± 13.77 | 24.98 ± 14.44 | 19.83 ± 12.95 | < 0.001 | 20.79 ± 14.71 | 26.25 ± 16.64 | 17.30 ± 12.10 | < 0.001 | 0.012 |
| AST (U/L) | 17.92 ± 13.13 | 18.24 ± 9.18 | 17.72 ± 15.09 | 0.438 | 18.71 ± 8.18 | 20.74 ± 8.37 | 17.41 ± 7.79 | < 0.001 | 0.003 |
| GGT (U/L) | 32.47 ± 30.57 | 37.25 ± 38.76 | 29.4679 ± 23.58 | < 0.001 | 24.72 ± 16.58 | 30.79 ± 19.48 | 20.8496 ± 13.03 | < 0.001 | < 0.001 |
| ALP (U/L) | 234.89 ± 68.87 | 228.86 ± 65.89 | 238.68 ± 70.45 | 0.005 | 204.70 ± 58.19 | 208.84 ± 53.36 | 202.06 ± 60.94 | < 0.001 | < 0.001 |
| MCV (FL) | 83.79 ± 6.35 | 84.92 ± 6.05 | 83.078 ± 6.44 | < 0.001 | 84.65 ± 6.98 | 85.90 ± 6.76 | 83.865 ± 7.01 | < 0.001 | < 0.001 |
| Energy (Kcal) | 2757.25 ± 711.78 | 3036.46 ± 656.42 | 2581.86 ± 689.13 | < 0.001 | 2906.66 ± 693.83 | 3168.82 ± 631.92 | 2739.21 ± 679.71 | < 0.001 | < 0.001 |
| Physical activity (MET) | 35.83 ± 5.37 | 36.63 ± 6.81 | 35.33 ± 4.16 | < 0.001 | 37.24 ± 5.50 | 37.98 ± 7.21 | 36.77 ± 3.98 | < 0.001 | < 0.001 |
Baseline Characteristics of the Study Population
All anthropometric, hepatic, and cardiometabolic indices were significantly higher in individuals with diabetes compared to healthy individuals (P < 0.001). Among patients with T2DM, women had significantly higher anthropometric, hepatic, and cardiometabolic indices compared to men, except for Atherogenic Index of plasma (AIP), LCI, and CMI (Table 2).
| Characteristics | T2DM | P a | Healthy | P b | P c | ||||
|---|---|---|---|---|---|---|---|---|---|
| Total (N = 1607) | Male (n = 620) | Female (n = 987) | Total (N = 5693) | Male (n = 2219) | Female (n = 3474) | ||||
| WHR | 0.99 ± 0.06 | 0.98 ± 0.05 | 0.99 ± 0.06 | 0.470 | 0.94 ± 0.06 | 0.95 ± 0.05 | 0.94 ± 0.06 | < 0.001 | < 0.001 |
| WHtR | 0.62 ± 0.07 | 0.57 ± 0.05 | 0.65 ± 0.06 | < 0.001 | 0.59 ± 0.07 | 0.55 ± 0.06 | 0.62 ± 0.06 | < 0.001 | < 0.001 |
| WWI | 11.62 ± 0.82 | 10.96 ± 0.57 | 12.04 ± 0.66 | < 0.001 | 11.27 ± 0.82 | 10.67 ± 0.64 | 11.65 ± .68 | < 0.001 | < 0.001 |
| VAI | 3.05 ± 2.55 | 2.95 ± 2.68 | 3.11 ± 2.46 | 0.235 | 2.30 ± 1.84 | 2.45 ± 2.19 | 2.21 ± 1.58 | < 0.001 | < 0.001 |
| AVI | 21.08 ± 4.28 | 19.99 ± 4.09 | 21.77 ± 4.26 | < 0.001 | 19.55 ± 4.39 | 18.66 ± 4.16 | 20.13 ± 4.45 | < 0.001 | < 0.001 |
| CI | 1.36 ± 0.07 | 1.32 ± 0.07 | 1.37 ± 0.07 | < 0.001 | 1.32 ± 0.07 | 1.28 ± 0.07 | 1.35 ± 0.07 | < 0.001 | < 0.001 |
| RFM | 39.00 ± 8.54 | 29.07 ± 3.61 | 45.24 ± 3.13 | < 0.001 | 37.41 ± 8.79 | 27.53 ± 4.18 | 43.72 ± 3.69 | < 0.001 | < 0.001 |
| BRI | 8.18 ± 0.95 | 7.55 ± 0.78 | 8.58 ± 0.85 | < 0.001 | 7.82 ± 0.99 | 7.25 ± 0.82 | 8.19 ± 0.92 | < 0.001 | < 0.001 |
| LAP | 91.79 ± 67.27 | 80.95 ± 61.11 | 98.60 ± 70.04 | < 0.001 | 66.02 ± 46.37 | 63.22 ± 49.66 | 67.81 ± 44.06 | < 0.001 | < 0.001 |
| AIP | 0.54 ± 0.27 | 0.59 ± 0.27 | 0.51 ± .26 | < 0.001 | 0.43 ± 0.26 | 0.52 ± 0.27 | 0.38 ± 0.25 | < 0.001 | < 0.001 |
| CMI | 2.70 ± 2.30 | 2.88 ± 2.62 | 2.59 ± 2.07 | 0.015 | 2.02 ± 1.71 | 2.34 ± 2.14 | 1.82 ± 1.33 | < 0.001 | < 0.001 |
| TIMI risk index | 20.06 ± 7.29 | 19.30 ± 6.60 | 20.53 ± 7.66 | 0.001 | 16.72 ± 6.67 | 16.40 ± 6.54 | 16.92 ± 6.74 | 0.004 | < 0.001 |
| TyG-BMI | 278.04 ± 47.53 | 268.63 ± 45.81 | 283.94 ± 47.66 | < 0.001 | 248.27 ± 46.54 | 240.75 ± 43.99 | 253.07 ± 47.50 | < 0.001 | < 0.001 |
| LCI | 27.30 ± 29.22 | 28.78 ± 31.75 | 26.38 ± 27.49 | 0.110 | 20.30 ± 18.13 | 23.58 ± 18.94 | 18.21 ± 17.28 | < 0.001 | < 0.001 |
| HIS | 91.85 ± 39.85 | 57.13 ± 24.17 | 113.66 ± 31.40 | < 0.001 | 44.09 ± 28.69 | 9.80 ± 3.36 | 66.00 ± 10.53 | < 0.001 | < 0.001 |
| ANI | -10.94 ± 5.99 | -6.19 ± 4.59 | -13.92 ± 4.71 | < 0.001 | -9.46 ± 6.41 | -4.82 ± 5.15 | -12.42 ± 5.29 | < 0.001 | < 0.001 |
Comparison of Anthropometric, Hepatic, and Cardiometabolic Indices Between Patients with Type 2 Diabetes Mellitus and Healthy Individuals
According to Pearson’s correlation coefficient, the waist-to-hip ratio (WHR) had the strongest correlation with fasting blood sugar (FBS) (r = 0.245, P < 0.001). The visceral adiposity index (VAI) consistently showed the most significant correlations with various cardiometabolic variables, including LAP, AIP, CMI, and LCI. The Conicity Index (CI) had the strongest correlation with hepatic indices such as ANI and HSI (Table 3).
| Variables | WC | BMI | WHR | WHtR | WWI | VAI | AVI | CI | BRI | RFM |
|---|---|---|---|---|---|---|---|---|---|---|
| FBS | ||||||||||
| R | 0.122 | 0.049 | 0.245 | 0.119 | 0.148 | 0.180 | 0.120 | 0.055 | 0.169 | 0.119 |
| P | < 0.001 | < 0.001 | < 0.001 | < 0.001 | < 0.001 | < 0.001 | < 0.001 | < 0.001 | < 0.001 | < 0.001 |
| LAP | ||||||||||
| R | 0.505 | 0.423 | 0.409 | 0.454 | 0.301 | 0.854 | 0.501 | 0.271 | 0.361 | 0.455 |
| P | < 0.001 | < 0.001 | < 0.001 | < 0.001 | < 0.001 | < 0.001 | < 0.001 | < 0.001 | < 0.001 | < 0.001 |
| AIP | ||||||||||
| R | 0.214 | 0.159 | 0.274 | 0.103 | -0.003 | 0.831 | 0.204 | -0.098 | 0.087 | 0.104 |
| P | < 0.001 | < 0.001 | < 0.001 | < 0.001 | < 0.786 | < 0.001 | < 0.001 | < 0.001 | < 0.001 | < 0.001 |
| CMI | ||||||||||
| R | 0.241 | 0.197 | 0.255 | 0.174 | 0.076 | 0.984 | 0.236 | 0.009 | 0.133 | 0.175 |
| P | < 0.001 | < 0.001 | < 0.001 | < 0.001 | < 0.001 | < 0.001 | < 0.001 | 0.446 | < 0.001 | < 0.001 |
| TIMI risk index | ||||||||||
| R | 0.088 | -0.104 | 0.325 | 0.146 | 0.368 | -0.001 | 0.090 | 0.101 | 0.378 | 0.145 |
| P | < 0.001 | < 0.001 | < 0.001 | < 0.001 | < 0.001 | < 0.944 | < 0.001 | < 0.001 | < 0.001 | < 0.001 |
| LCI | ||||||||||
| R | 0.136 | 0.093 | 0.201 | 0.092 | 0.054 | 0.674 | 0.129 | -0.021 | 0.095 | 0.092 |
| P | < 0.001 | < 0.001 | < 0.001 | < 0.001 | < 0.001 | < 0.001 | < 0.001 | 0.070 | < 0.001 | < 0.001 |
| HIS | ||||||||||
| R | 0.386 | 0.408 | 0.164 | 0.591 | 0.553 | 0.101 | 0.386 | 0.779 | 0.420 | 0.589 |
| P | < 0.001 | < 0.001 | < 0.001 | < 0.001 | < 0.001 | < 0.001 | < 0.001 | < 0.001 | < 0.001 | < 0.001 |
| ANI | ||||||||||
| R | -0.442 | -0.496 | -0.138 | -0.579 | -0.441 | -0.059 | -0.439 | -0.677 | -0.342 | -0.579 |
| P | < 0.001 | < 0.001 | < 0.001 | < 0.001 | < 0.001 | < 0.001 | < 0.001 | < 0.001 | < 0.001 | < 0.001 |
Pearson’s Correlation Coefficients Between Anthropometric, Hepatic, and Cardiometabolic Indices Among Men and Women
The multivariate-adjusted odds ratios (ORs) and 95% confidence intervals (CIs) for the T2DM risk in males and females are presented in Tables 4 and 5. These models included both unadjusted (Model 1) and adjusted (Model 2) results, where adjustments were made for age, energy intake, physical activity, and wrist circumference. Among the anthropometric, cardiometabolic, and hepatic indices, the Atherogenic Index of plasma had the highest multivariate-adjusted OR for T2DM risk in both males (OR = 3.39, 95% CI: 2.38 - 4.81) and females (OR = 5.68, 95% CI: 4.20 - 7.68).
| Variables | Model 1 a | Model 2 b | ||||
|---|---|---|---|---|---|---|
| Odd Ratio | (95% CI) | P-Value | Odd Ratio | (95% CI) | P-Value | |
| WC | 1.03 | (1.02 - 1.04) | < 0.001 | 1.04 | (1.02 - 1.05) | < 0.001 |
| BMI | 1.05 | (1.02 - 1.07) | < 0.001 | 1.08 | (1.05 - 1.12) | < 0.001 |
| WHR | 1.11 | (1.10 - 1.13) | < 0.001 | 1.09 | (1.07 - 1.11) | < 0.001 |
| WHtR | 1.06 | (1.05 - 1.07) | < 0.001 | 1.06 | (1.04 - 1.08) | < 0.001 |
| WWI | 2.13 | (1.83 - 2.48) | < 0.001 | 1.57 | (1.32 - 1.86) | < 0.001 |
| VAI | 1.09 | (1.05 - 1.13) | < 0.001 | 1.11 | (1.07 - 1.15) | < 0.001 |
| AVI | 1.08 | (1.05 - 1.10) | < 0.001 | 1.09 | (1.06 - 1.13) | < 0.001 |
| CI | 1.89 | (1.65 - 2.16) | < 0.001 | 1.13 | (0.90 - 1.42) | < 0.001 |
| BRI | 1.57 | (1.41 - 1.76) | < 0.001 | 1.34 | (0.94 - 1.92) | < 0.001 |
| RFM | 1.10 | (1.08 - 1.13) | < 0.001 | 1.10 | (1.07 - 1.14) | < 0.001 |
| LAP | 1.01 | (1.01 - 1.01) | < 0.001 | 1.01 | (1.01 - 1.01) | < 0.001 |
| AIP | 2.47 | (1.79 - 3.41) | < 0.001 | 3.39 | (2.38 - 4.81) | < 0.001 |
| CMI | 1.10 | (1.05 - 1.14) | < 0.001 | 1.12 | (1.08 - 1.17) | < 0.001 |
| TIMI risk index | 1.07 | (1.05 - 1.08) | < 0.001 | 1.01 | (0.97 - 1.03) | < 0.001 |
| TyG-BMI index | 1.01 | (1.01 - 1.02) | < 0.001 | 1.03 | (1.02-1.03) | < 0.001 |
| LCI | 1.01 | (1.01 - 1.01) | < 0.001 | 1.01 | (1.01 - 1.02) | < 0.001 |
| HIS | 1.16 | (1.14 - 1.17) | < 0.001 | 1.17 | (1.14 - 1.19) | < 0.001 |
| ANI | 0.95 | (0.93 - 0.96) | < 0.001 | 0.94 | (0.92 - 0.95) | < 0.001 |
Logistic Regression for Investigation of The Association Between Anthropometric, Hepatic, and Cardiometabolic Indices and Type 2 Diabetes Mellitus Risk in Males
| Variables | Model 1 a | Model 2 b | ||||
|---|---|---|---|---|---|---|
| Odd Ratio | (95% CI) | P-Value | Odd Ratio | (95% CI) | P-Value | |
| WC | 1.03 | (1.03 - 1.04) | < 0.001 | 1.03 | (1.02 - 1.04) | < 0.001 |
| BMI | 1.03 | (1.02 - 1.05) | < 0.001 | 1.04 | (1.02 - 1.06) | < 0.001 |
| WHR | 1.11 | (1.10 - 1.12) | < 0.001 | 1.08 | (1.07 - 1.09) | < 0.001 |
| WHtR | 1.06 | (1.05 - 1.08) | < 0.001 | 1.05 | (1.03 - 1.06) | < 0.001 |
| WWI | 2.30 | (2.06 - 2.56) | < 0.001 | 1.64 | (1.45 - 1.86) | < 0.001 |
| VAI | 1.27 | (1.22 - 1.32) | < 0.001 | 1.23 | (1.18 - 1.28) | < 0.001 |
| AVI | 1.09 | (1.07 - 1.10) | < 0.001 | 1.07 | (1.04 - 1.09) | < 0.001 |
| CI | 2.09 | (1.89 - 2.31) | < 0.001 | 1.29 | (1.11 - 1.49) | < 0.001 |
| BRI | 1.61 | (1.48 - 1.75) | < 0.001 | 1.41 | (1.10 - 1.82) | < 0.001 |
| RFM | 1.14 | (1.11 - 1.16) | < 0.001 | 1.10 | (1.07-1.13) | < 0.001 |
| LAP | 1.01 | (1.01 - 1.01) | < 0.001 | 1.01 | (1.01 - 1.01) | < 0.001 |
| AIP | 7.06 | (5.31 - 9.39) | < 0.001 | 5.68 | (4.20 - 7.68) | < 0.001 |
| CMI | 1.34 | (1.28 - 1.40) | < 0.001 | 1.29 | (1.23 - 1.36) | < 0.001 |
| TIMI risk index | 1.07 | (1.06 - 1.08) | < 0.001 | 0.99 | (0.97 - 1.01) | < 0.001 |
| TyG-BMI index | 1.01 | (1.01 - 1.02) | < 0.001 | 1.02 | (1.02 - 1.02) | < 0.001 |
| LCI | 1.02 | (1.01 - 1.02) | < 0.001 | 1.01 | (1.01 - 1.01) | < 0.001 |
| HIS | 1.11 | (1.10 - 1.12) | < 0.001 | 1.12 | (1.11 - 1.13) | < 0.001 |
| ANI | 0.95 | (0.93 - 0.96) | < 0.001 | 0.94 | (0.93 - 0.96) | < 0.001 |
Logistic Regression for Investigation of the Association Between Anthropometric, Hepatic, and Cardiometabolic Indices and Type 2 Diabetes Mellitus Risk in Females
Optimal cut-off values for various indices differed between men and women. For men, the optimal cut-off values were higher for BMI (28.0 vs. 25.48), WHtR (0.64 vs. 0.56), WWI (11.83 vs. 10.76), CI (1.35 vs. 1.29), BRI (8.43 vs. 7.33), RFM (44.63 vs. 28.5), and LAP (67.23 vs. 67.04). For women, the optimal cut-off values were higher for WC (99.45 vs. 98.35), WHR (0.99 vs. 0.96), VAI (2.22 vs. 2.19), and AVI (20 vs. 19.6) (Table 6).
| Variables | T2DM | |||||||||
|---|---|---|---|---|---|---|---|---|---|---|
| Male | Female | |||||||||
| Cut-off | AUC | Sen (%) | Spe (%) | YI | Cut-off | AUC | Sen (%) | Spe (%) | YI | |
| WC | 99.45 | 0.59 | 51.5 | 63.5 | 0.150 | 98.35 | 0.61 | 71.6 | 44.6 | 0.162 |
| BMI | 25.48 | 0.56 | 72.9 | 37.4 | 0.103 | 28.00 | 0.54 | 65.7 | 42 | 0.077 |
| WHR | 0.99 | 0.67 | 55 | 70.2 | 0.252 | 0.96 | 0.70 | 70.1 | 59.5 | 0.296 |
| WHtR | 0.56 | 0.61 | 62.3 | 56.9 | 0.192 | 0.64 | 0.62 | 60 | 59 | 0.190 |
| WWI | 10.76 | 0.64 | 64.7 | 56.1 | 0.208 | 11.83 | 0.66 | 64.4 | 60.9 | 0.253 |
| VAI | 2.22 | 0.58 | 51.9 | 59.9 | 0.118 | 2.19 | 0.65 | 60.8 | 62.7 | 0.235 |
| AVI | 20.00 | 0.60 | 50.5 | 69.5 | 0.200 | 19.60 | 0.61 | 69.7 | 47.2 | 0.169 |
| CI | 1.29 | 0.63 | 65 | 53.6 | 0.186 | 1.35 | 0.66 | 73.2 | 50 | 0.232 |
| BRI | 7.33 | 0.61 | 63.5 | 55.2 | 0.187 | 8.43 | 0.62 | 58.8 | 60.1 | 0.189 |
| RFM | 28.50 | 0.61 | 62.3 | 56.9 | 0.192 | 44.63 | 0.62 | 63.5 | 55.4 | 0.189 |
| LAP | 67.04 | 0.60 | 50.2 | 66 | 0.162 | 67.23 | 0.67 | 63.9 | 60.4 | 0.243 |
The Optimal Cut-off Value for Anthropometric Indices for the Prediction of Type 2 Diabetes Mellitus in Men and Women
5. Discussion
Our study showed that among the anthropometric indices, the VAI had the highest correlation with cardiometabolic indices, while CI had the highest correlation with hepatic indices. In the Hoveyzeh population, the atherogenic index of plasma was the most significant predictor of T2DM in both men and women compared to other indicators.
In our study, the odds ratios in model 2 indicated that among the anthropometric indices, the Weight-Adjusted Waist Index (WWI) and VAI, and among the cardiometabolic indices, AIP, CI, Body Roundness Index (BRI), and Cardiometabolic Index (CMI), as well as Hepatic Steatosis Index (HSI) among the liver indices, were predictors of T2DM. Additionally, men and women in the study showed similar results.
The average energy intake and physical activity levels in healthy individuals were higher than in patients with T2DM, indicating the impact of diabetes on daily life and activity. In our study, systolic and diastolic blood pressure in T2DM patients was higher than in the healthy group, which aligns with findings from other studies in different Iranian populations. Therefore, early diagnosis of T2DM using anthropometric indicators can reduce the complications of diabetes, such as diabetic nephropathy, cardiovascular diseases, and cerebrovascular diseases, over time (26).
In this study, the average of all conventional anthropometric indices (WC, WHR, BMI, and WHtR) and new anthropometric indices, including WWI, VAI, abdominal volume index (AVI), CI, relative fat mass (RFM), and BRI, were higher in T2DM patients than in healthy individuals. Among the conventional and new anthropometric indices, only WHR and VAI did not show a significant difference between diabetic men and women. The conventional and new anthropometric indices measured in our research, except for WHR and VAI, were higher in healthy women than in healthy men.
Different populations have different predictive factors for diabetes, and there are also differences between male and female groups. In studies conducted in British, Chinese, German, European, and Australian native populations, WC was identified as a predictor of T2DM (27-31). Some studies have reported that WHtR is the most sensitive predictive factor for diabetes (32-34). Khader et al. reported that WHtR was the most effective predictor of diabetes in the Jordanian adult population (34). Waist-to-hip ratio is commonly used to determine abdominal obesity, distinguishing between gynoid (buttock) and android (abdominal) obesity (35). In a study conducted in Iran, it was shown that the risk of T2DM is higher in individuals with high WHR compared to those with high BMI and WC, with the increase being greater in women than in men (OR 2.79 vs. 2.36) (32). In our study, the multivariate-adjusted OR for T2DM risk in males for WHR, WC, BMI, and WHtR was 1.09, 1.04, 1.08, and 1.06, respectively, while for women, it was 1.08, 1.03, 1.04, and 1.05, respectively. According to the odds ratio greater than one (OR > 1), common anthropometric indices, including WC, BMI, WHR, and WHtR, and new anthropometric indices, including WWI, VAI, AVI, CI, RFM, and BRI, increase the risk of T2DM.
In our study population, AIP was an important predictor of T2DM compared to other indicators. The AIP is composed of two important parameters, triglycerides (TG) and HDL. The simultaneous use of TG and HDL in this ratio indicates multiple interactions between the metabolism of different lipoproteins, which can be used to predict plasma atherogenicity (36). Atherogenic Index of plasma is an atherogenic factor that can predict atherosclerosis and the risk of cardiovascular events (37, 38). Atherogenic Index of plasma indices are associated with visceral fat area in patients with T2DM in some studies (39).
In our study, BMI, WHtR, WWI, CI, BRI, RFM, and LAP had higher optimal cut-off point values in men than in women. Women had higher optimal cut-off point values for WC, WHR, VAI, and AVI than men. The optimal cut-offs for anthropometric indices to predict T2DM differ among different populations (40). The differences in study results may be largely influenced by the ethnicity, age, gender, and background diseases of the participants, as well as the anthropometric indicators chosen for analysis.
In our research, we found that TC and TG levels were higher in subjects with T2DM compared to healthy subjects. Conversely, HDL levels were higher in healthy subjects than in those with T2DM. We did not observe a significant difference in mean LDL levels between people with T2DM and healthy individuals in our study. This could be due to the use of statin drugs in the diabetic group, which may have reduced their LDL levels and acted as a confounding factor.
One of the limitations of our study was the narrow age range of 35 to 70 years. Expanding the age range to include individuals over 70 years old and under 30 years old could provide a better understanding of the impact of risk factors. Additionally, it's important to note that statin consumption in patients with dyslipidemia and T2DM could influence the results of the lipid profile and could be a confounding factor.
Our research was a cross-sectional study, which has limitations in establishing causal relationships between variables. Since data is collected at a single point in time, it is challenging to determine the temporal sequence of events or to ascertain whether a particular variable directly influences another.
5.1. Conclusions
In our study population, the Atherogenic Index of Plasma is a highly predictive indicator of T2DM. Our results suggest that novel anthropometric and cardiometabolic indices could serve as accessible and cost-effective strategies for assessing health outcomes related to T2DM.
According to previous research, differences in estrogen levels may lead to varying ANI index results in non-menopausal and menopausal women, indicating the need for further investigation to compare this index (41-43).
The study utilized the TyG index to assess insulin resistance. It is recommended to use the insulin resistance model or other standard indices of insulin resistance in future studies to allow for comparison of results, as the TyG Index primarily represents the level of insulin resistance.
Several factors, such as the number of hours slept per day and depression, contribute to the incidence and prevalence of diabetes. Therefore, it would be beneficial to conduct more extensive studies aimed at identifying predictive risk factors for type 2 diabetes, taking these factors into account.
